|
In recent posts, we’ve been tracking the progress of loans coming out of forbearance into various pool types such as Reperforming (RG), Extended Term (ET) and, even Private Label pools[1]. A different perspective can be obtained by looking at the disposition of loans with partial claims. Recall that a partial claim occurs when a borrower with missed payments can resume making payments but does not have the resources to increase payments to compensate for the balance missed. In general, the missed payments are placed into a subordinate lien that comes due when the mortgage is extinguished. It is important to note that a partial claim is not a modification, and a loan with a partial claim does not have to be in a forbearance program. Recently, Ginnie Mae announced that they would disclose the share of loans in pools with partial claims[2]. Below find a summary table of these results reported first ever as of April, 2022 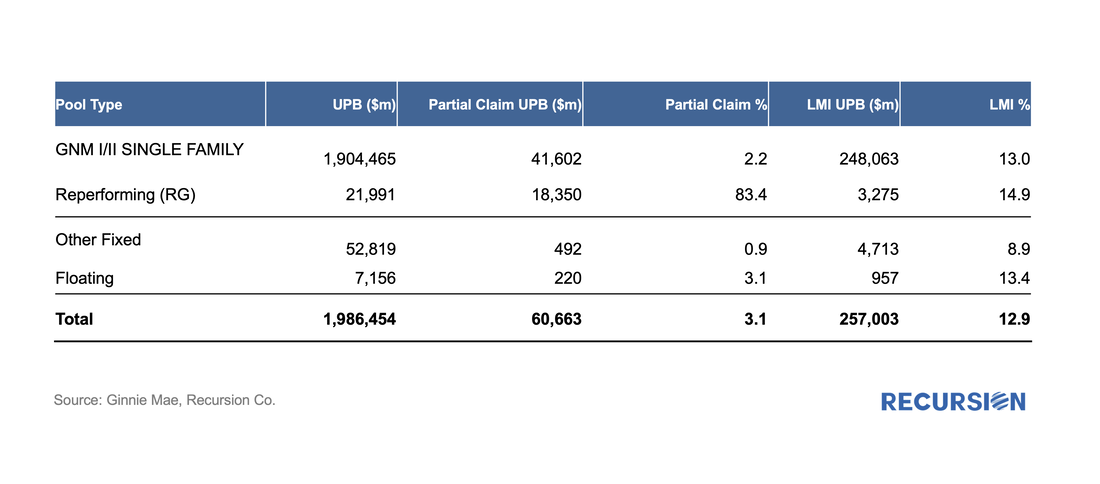 In a recent post[1], we discussed findings obtained with the recent release of 2021 HMDA data. Among other things, we looked at the share of mortgage originations by income group and product type. In this note, we look at the difference in lending patterns between the banks and nonbanks. The incentive behind this approach is policy driven. There is a long history of measures taken to encourage lenders and builders to foster economic development in low-income areas via the housing market. For example, the Community Reinvestment Act (CRA) stipulates that a bank’s performance with regards to compliance of their regulatory requirements depends in part on: “the geographic distribution of loans—that is, the proportion of the bank's total loans made within its assessment area; how these loans are distributed among low-, moderate-, middle-, and upper income locations[2]” To assess this issue, we assign a flag to each of the census tracts designated by HUD as having a greater than 51% share of households with incomes in the Low-to-Moderate (LMI) range in the larger MSA the tract is part of[3], which are called LMI area by HUD, or “low income” tracts by FHFA. Below find a chart of the 10-year trend in the share of loans originated in this category by institution type for conventional and FHA loans: 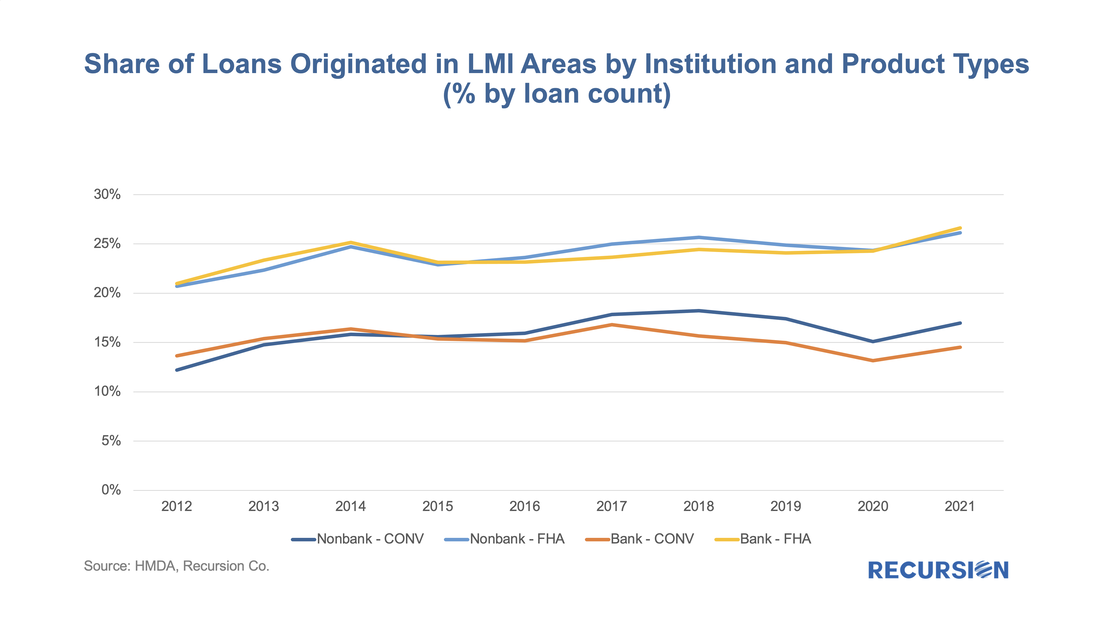 On March 24, the CFPB released HMDA data for 2021[1], with results obtained from 4,316 reporters, little changed from 4,472 reporters in 2020, but well below the 5,505 respondents reached in 2019[2]. There are yet more companies are expected to report to 2021 HMDA. However, our experience from previous year indicates little change in big picture when reporting is finalized. The drop reported in the number of reporters in 2020 vs 2019 is largely due to a reduction in the number of loans that a bank needed to underwrite, requiring a report to be filed starting in 2020. This data is used for market sizing by regulators and market participants, but it also represents a treasure trove of information regarding lender and consumer behavior across a wide variety of economic and market regimes. 2021 was notable for being the second year of the Covid-19 pandemic, which is associated with expansive monetary and fiscal policies and surging house prices. This report will briefly assess trends across a variety of topics. Market Activity After surging by 47% in 2020 to 24.8 million from 2019, the number of loan activities reported in 2021 HMDA ticked up by just 2% to 25.2 million, almost 40% below the record high 41.5 million attained in 2003. Similarly, the number of loans originated reported in 2020 jumped by 57% from the prior year to 14.2 million, while in 2021 the figure rose by only 3% to 14.6 million, down by about one-third from the 2003 peak of 21.4 million. 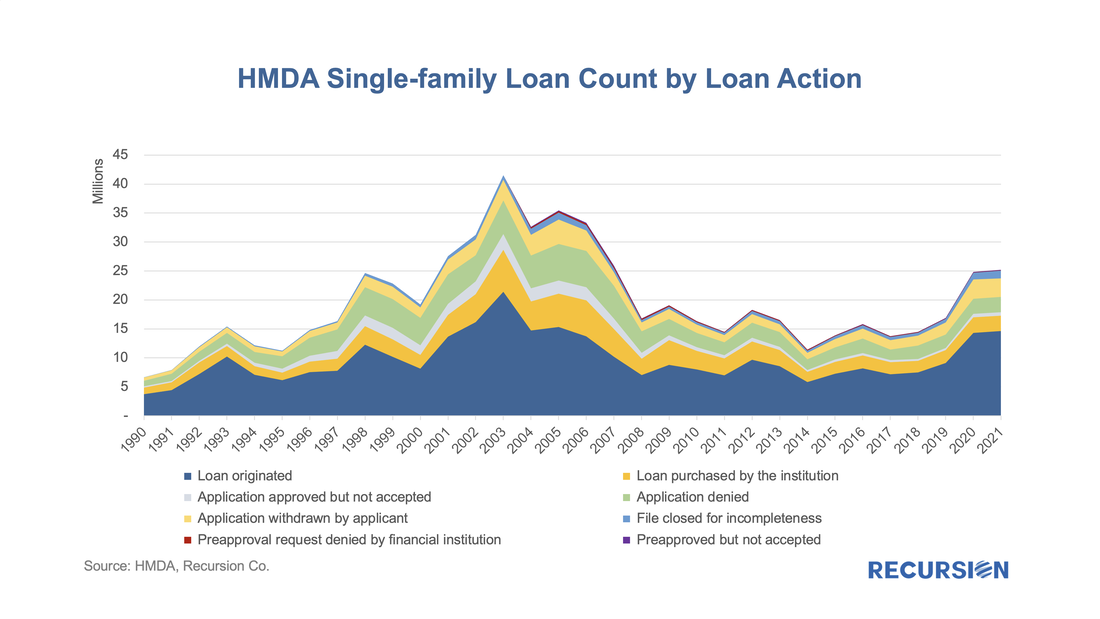 Recently, the GSE’s Fannie Mae and Freddie Mac released loan-level data associated with their “Special Eligibility Programs” that look to extend credit to low-income borrowers. As housing policy is increasingly focused on providing this market segment access to this market segment, this data will prove useful to housing analysts looking to assess the effectiveness of these programs as well as to traders looking to understand the impact on the performance of MBS containing these loans. Briefly, each agency has three programs. There are many differences in details between the programs.
As the refi programs are relatively new and volumes are small, in this post we focus on the first two. For convenience, we refer to the first as the “Low-Income Programs” and the second the “HFA Programs”. Below find the market share of Home Ready and Home Possible out of total volumes for their respective Agencies by loan count: 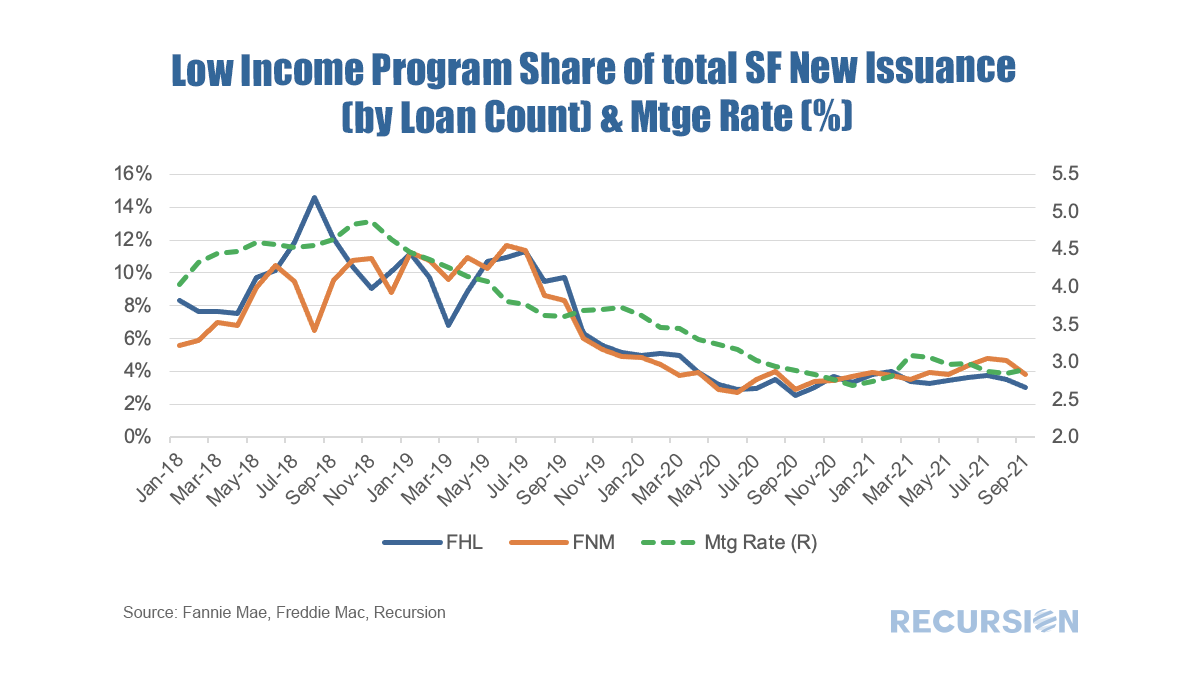 With affordable housing for Low-Moderate Income (LMI) households at the top of the policy agenda, we take a look at loan data for manufactured housing (MH). In a recent report, the CFPB provided a comprehensive survey of this market based on enhancements to the HMDA data first made available in 2018[1]. These include data on Secured property type:
In their survey, the CFPB looked deeply into the data for 2019. In this note, we update some of their work with 2020 HMDA data. This is important because of the onset of Covid-19 that year. The site-built market performed strongly, but this cannot necessarily be presumed to carry over to MH as Covid is a supply shock, impacting labor markets and supply chains. Another innovation in this note is that rather than looking at this market by state the way the CFPB does, as a policy guide we look at it bifurcated between rural and nonrural MSAs. Below finds a chart of the progression of single-family manufactured housing origination volumes for personal loans (securitized by chattel) and mortgages (securitized by real property) from 2018-2020, along with the share of all single-family manufactured housing loans (personal loans plus mortgages) of the total single-family mortgages including those for site-built homes. 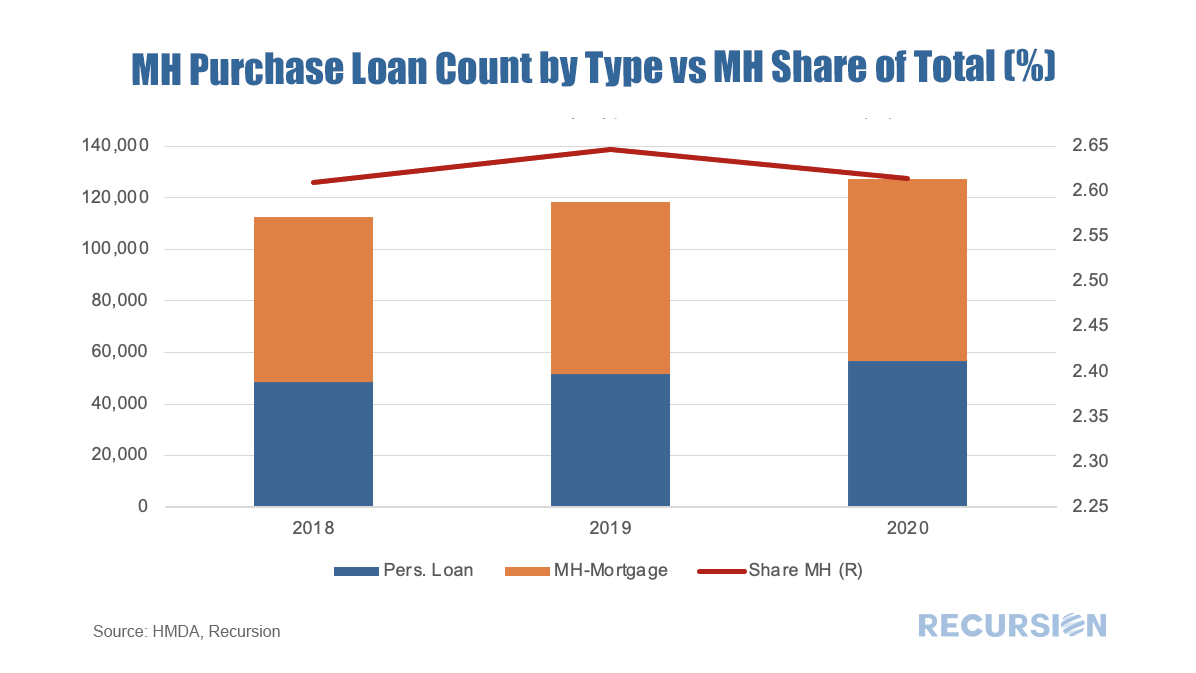 In a recent post[1] we looked at the evolution of the FHA purchase mortgage market share broken down between areas with a high percentage of Low-Moderate Income (LMI) households and those without. While the overall FHA share has generally declined since the onset of the pandemic, its share has held up in areas with a preponderance of LMI households. There are many factors behind these trends, but a natural consideration is underwriting standards. To examine this factor, we use the Recursion Matched Dataset[2], where we create a large sample of loans with characteristics from both HMDA and the Agency disclosure data. A very high share of mortgages can be matched using our proprietary algorithm over the years 2018-2020. The coverage ratio from the Matched Dataset is provided in a previous post[3]. We proceed by looking at three major underwriting characteristics for LMI and non-LMI areas for FHA and the GSE’s: Credit Score (CS), Loan-to-Value (LTV) and Debt-to-Income (DTI), Most interesting is Credit Scores: 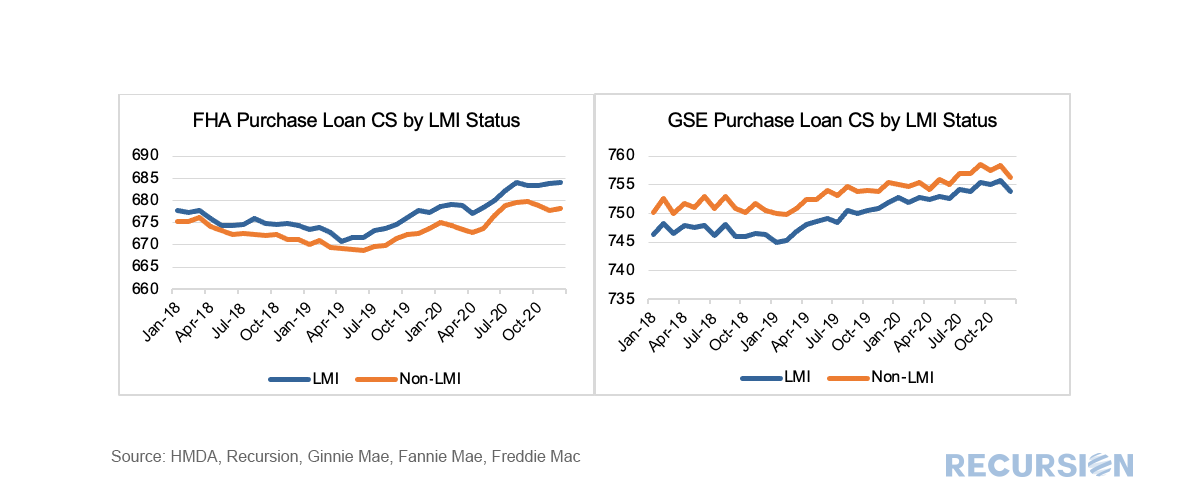 In a recent post[1], we looked at the declining FHA share of the purchase mortgage market relative to the GSE’s across a variety of price points. Another way to look at this question is by a geographic breakdown focusing on those census tracts with a Low-Moderate Income (no greater than 80% of area median income) population greater than 51% (we will call these LMI areas)[2]. To address this issue, we utilize the HMDA dataset, and then apply the LMI information to compute shares of originated purchase loans delivered to FHA vs GSE. This is done on both a loan count and loan balance basis. 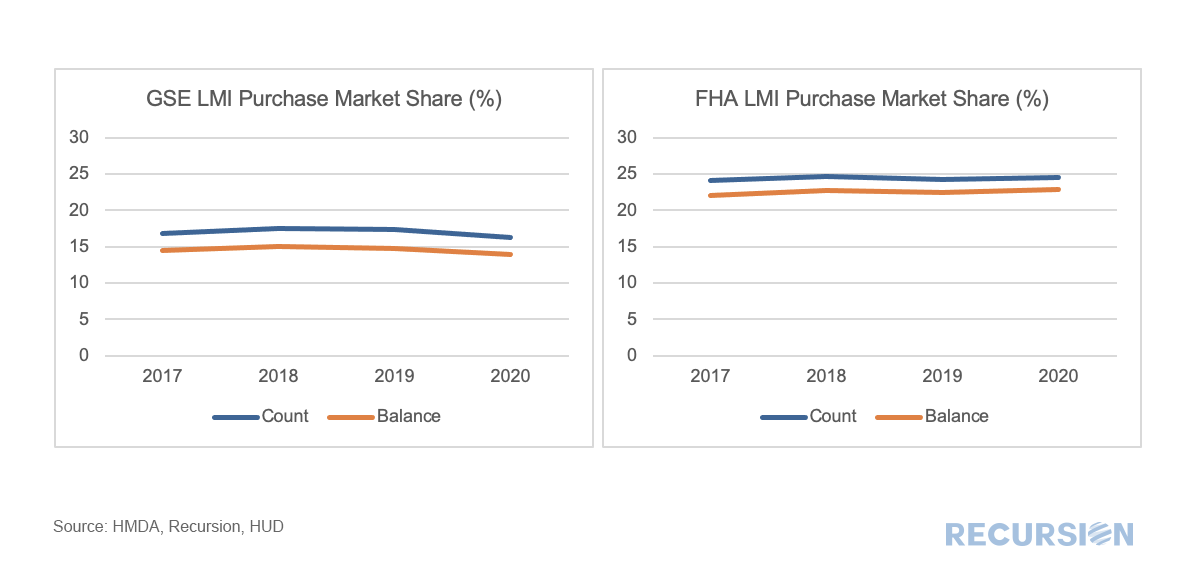 Credit provision is one of the great areas of concern addressed by the New Housing Policy. In a previous post[1], we mentioned that we have integrated HUD LMI Neighborhood information with our tools. We can view aggregate credit creation through Cohort Analyzer, and its composition through HMDA Analyzer. 2020 marked an unprecedented year for mortgage production as the pandemic sparked aggressive moves by the Federal Reserve driving mortgage rates to record lows, coupled with a flight of households away from density towards more sparsely populated areas. Trends in the major programs by loan count can be seen here: 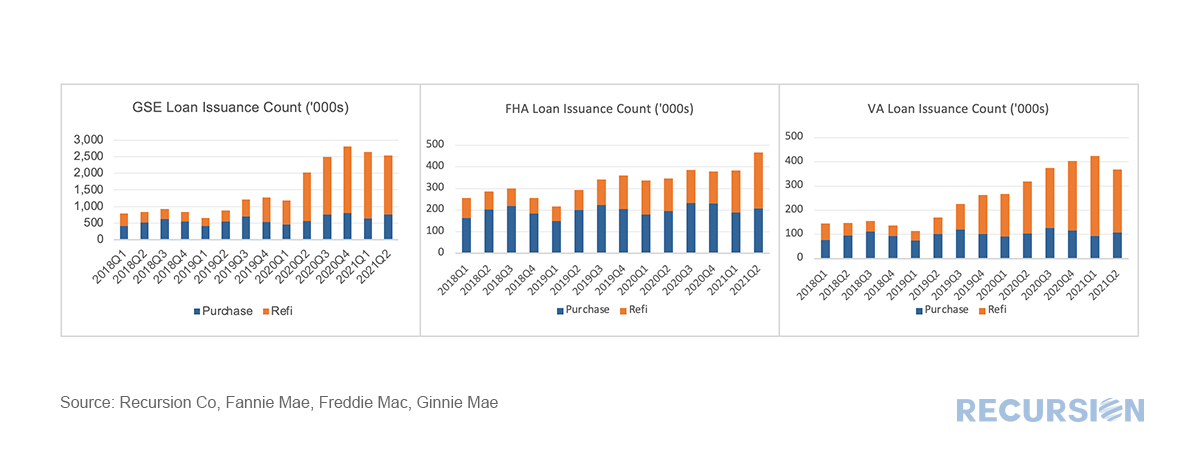 *This chart can be duplicated using the above two queries
|
Archives
July 2024
Tags
All
|
 RSS Feed
RECURSION |
|

Copyright © 2022 Recursion, Co. All rights reserved.