|
On June 5, Housing Wire published an article, “Analysis: Loan repurchase patterns at Fannie, Freddie are divergent” which discussed the declining rate of repurchases on the part of Fannie Mae and Freddie Mac. “A review of the same agency loan-level data by mortgage-analytics firm Recursion shows that Freddie Mac’s repurchase-loan count, as of the first quarter of 2022, stood at about 2,500 loans, compared to about 1,500 repurchased loans for Fannie Mae. As of the fourth quarter of last year, however, that gap had all but disappeared, with each agency repurchasing about 1,000 loans each. “[Freddie] has come way down [in its loan-repurchase count], and now they’re about the same [as Fannie], and that’s really interesting,” said Richard Koss, chief research officer at Recursion.”  Recursion is always pleased to see its data utilized to shed light on important industry developments.
https://www.housingwire.com/articles/analysis-loan-repurchase-patterns-at-fannie-freddie-are-divergent/ (paywall) A little while ago, we wrote about DPAs and noted that there are distinct differences in how these are reported between the GSEs and FHA[1]. Subsequently, we looked into the issuers of these FHA DPA loans and noted that DPA usage has been broadening to include a growing set of lenders in recent years[2]. We now turn to the GSEs. We noted in our earlier reports that while there is no DPA flag for the Enterprises, we can derive some information about their use from the fact that DPAs are only allowed through their specified second lien programs. This leads us naturally to broaden our investigation to consider those cases where new loans are delivered in tandem: a first or primary mortgage along with a second lien or “piggyback” mortgage. The Enterprises refer to these as “secondary” mortgages. The question of course is do we have the information necessary to assess the scope and performance of loans with accompanying seconds? Given that the GSEs disclose the CLTV as well as the OLTV of a loan, if the former is higher than the latter, we can consider it as a piggybacked loan. Grist for the Recursion mill. To start, we limit ourselves to purchase loans, and we look at the share of deliveries with accompanying second liens by agency: 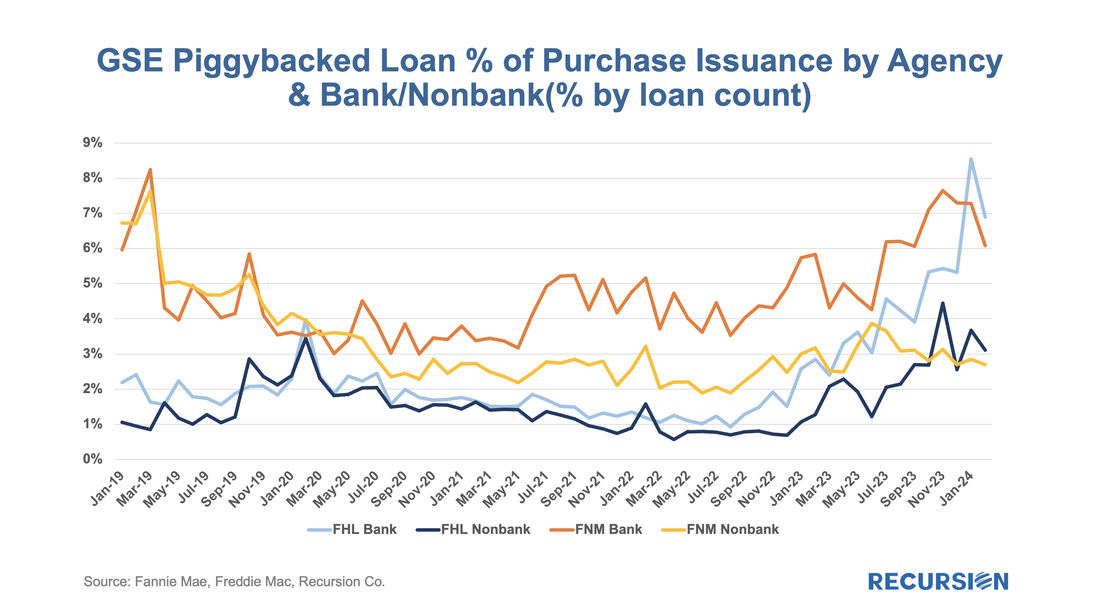 Mortgage Servicing Right (MSR) owners can sell excess servicing fees (ESF) when pricing is supportive or when they need cash. The securitization vehicle for this activity is Agency ESF strips without a Principal-only (PO) component, which are disclosed by Fannie Mae and Freddie Mac. In recent years, issuance of cash strips has been rare, and most strips issued by the GSEs are ESF strips. The following chart shows the amount of ESF securitized each year --- as we can see here Fannie Mae had no activity in such deals in 2020 and 2021 but came back into the market in 2022. To close the gap with Freddie Mac Fannie Mae enhanced its related data disclosures at the beginning of 2023[1]. Fannie Mae’s market position improved from 0% in 2021 to 5.5% in 2022 and to 29.3% in 2023 and 25.8% in the first two months of 2024. 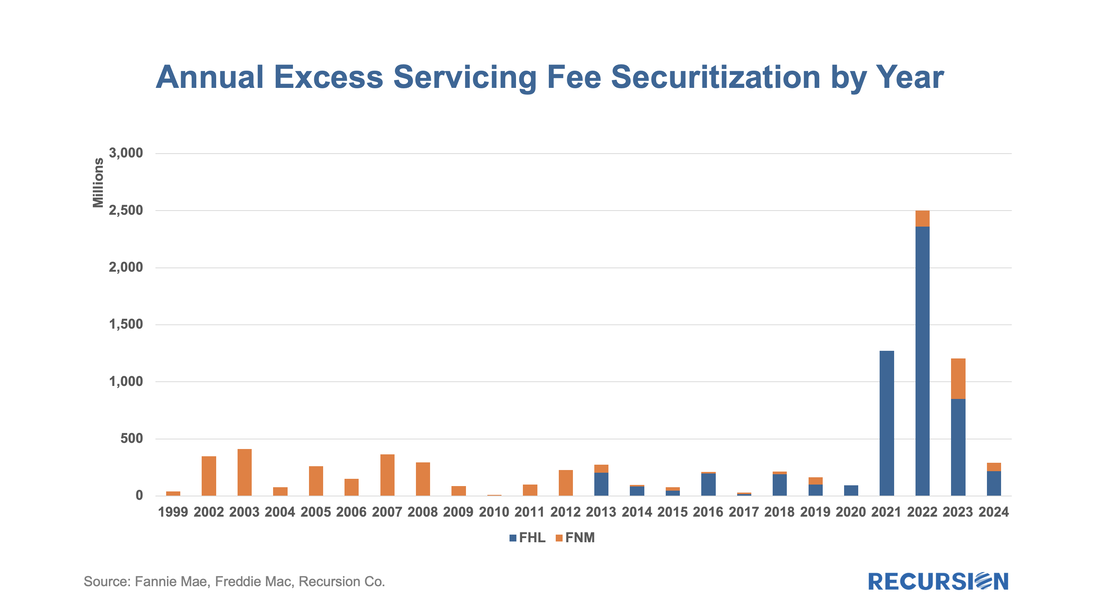 In Mortgage Winter, affordability is job one for housing policy. In our most recent quarterly macro report, we noted that the share of loans with buydowns posted significant increases across all three agencies in the second half of 2023[1]. To see how widespread these sorts of supportive actions are, we look at down payment assistance (DPA) programs. To start, the GSEs only allow downpayment assistance through specified second lien programs: “Community Seconds” for Fannie Mae[2] and “Affordable Seconds” for Freddie Mac[3]. While there are technical differences between programs, they are second liens funded by an approved list of government agencies, nonprofits, and private sector lenders. The liens are subordinate to the first mortgage and face various limits on combined LTV (CLTV) and note rates. These liens are neither securitized by the Enterprises nor directly reported in the data disclosures. However, we could identify those (we call it “piggyback”) by looking for loans with the original combined LTV higher than its original LTV. Below find the number of owner-occupied loans containing “piggyback” liens for the HFA programs, the low-income programs (FNM “Home Ready” and FHL “Home Possible”), and other[4]: 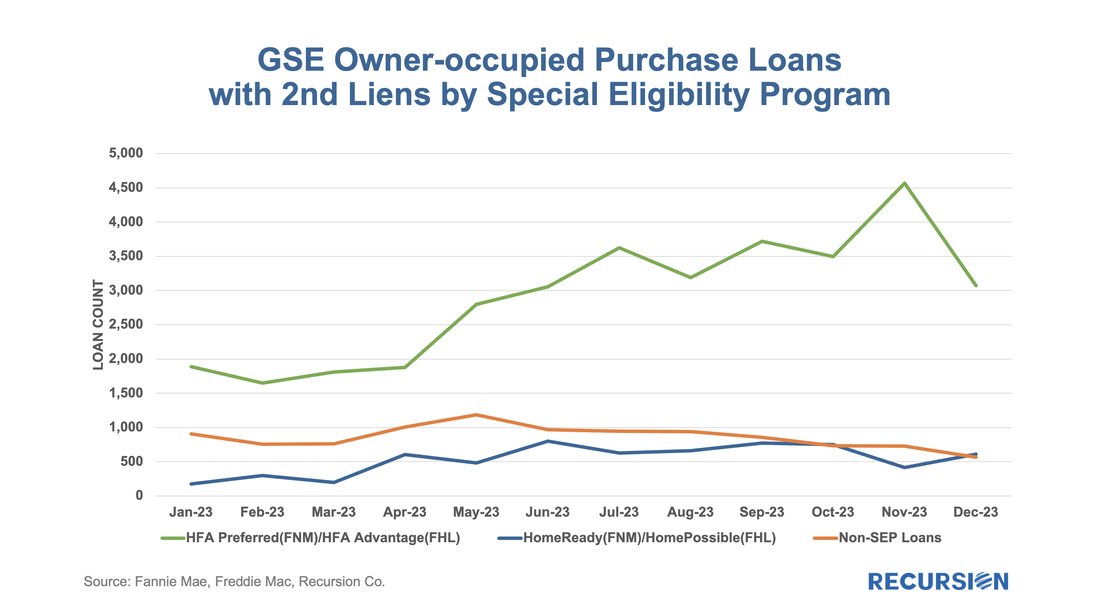 This is the third and (for now) final entry in our series of posts regarding appraisal modernization. The first describes the framework of data disclosures provided by the GSEs[1], while the second looks at differences in usage of the various programs between Fannie Mae and Freddie Mac and between banks and nonbanks[2]. In this note, we look at loan prepayment performance and the drivers behind it. Here we see 1-month CPRs and loan rates for purchase loans issued in 2023 with waivers and those eligible for waivers but did not obtain one: 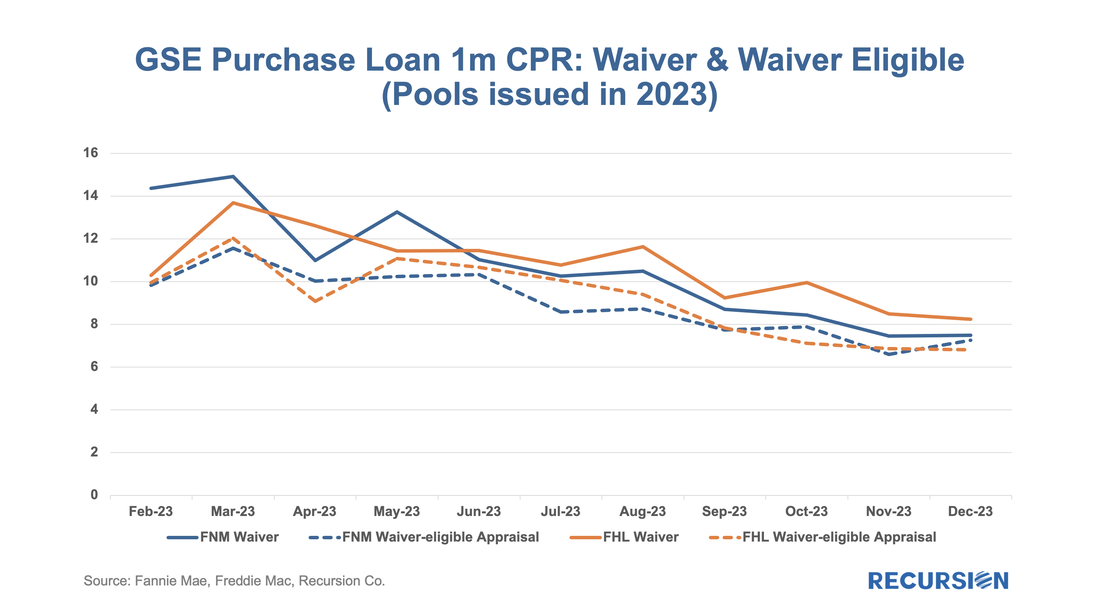 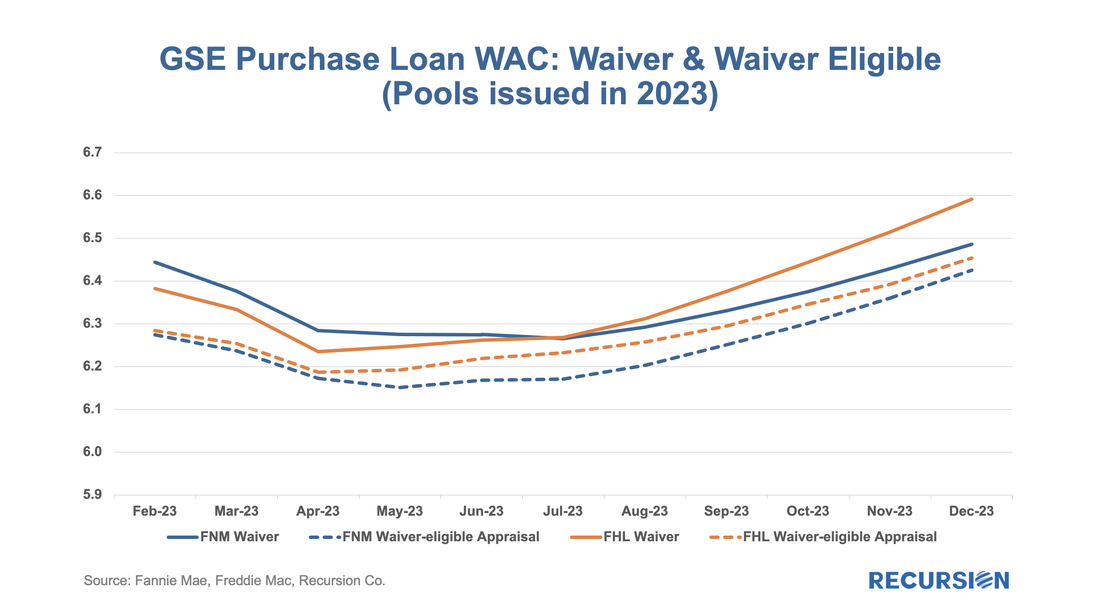 Those loans eligible for waivers but that obtain appraisals have lower loan rates and prepayment rates than loans with waivers, likely due to relatively reduced uncertainty surrounding valuation. Another key result that can be obtained from the chart is the more recent development whereby loans delivered to Freddie Mac with waivers have displayed persistently higher speeds than those delivered to Fannie Mae over the last six-month period. This corresponds with an increase in the pace of growth in FHL coupons compared to those of FNM over this period. It’s natural to ask if there are differences in loan characteristics that account for this gap. Below find the corresponding data for average credit scores across these categories: 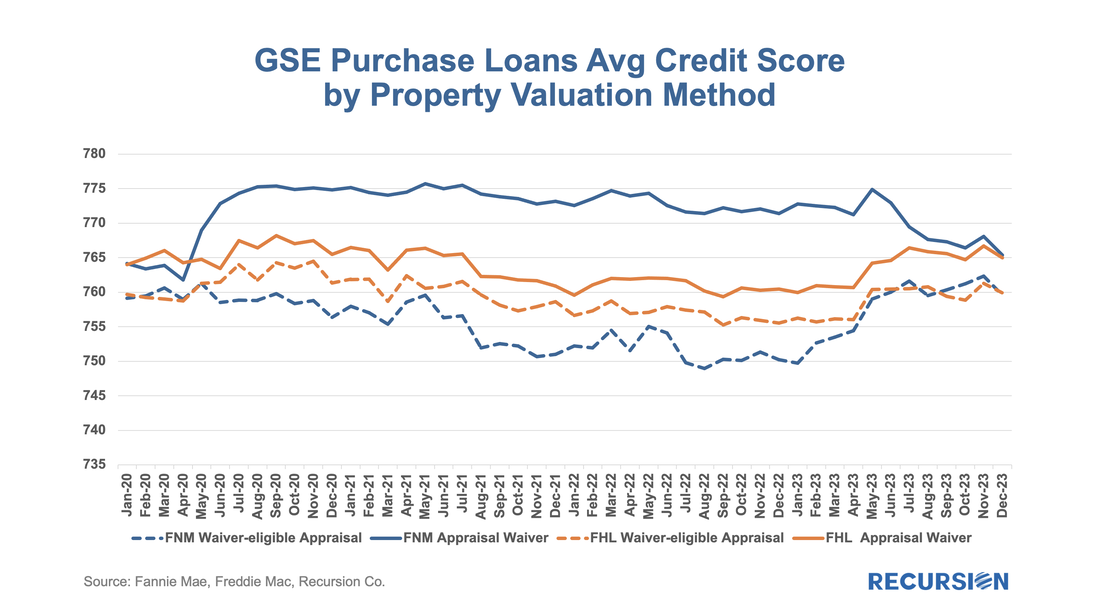 Over the past six months, FNM has loosened its credit standards for waivers as measured by credit scores relative to Freddie Mac. As this would tend to boost FNM coupons vs FHL, another explanation would seem to be required. We can speculate that FHL is discouraging waivers for its own risk-management purposes, but there is no verifiable support for this view. We can, however, see if this pattern persists in the newer appraisal types. 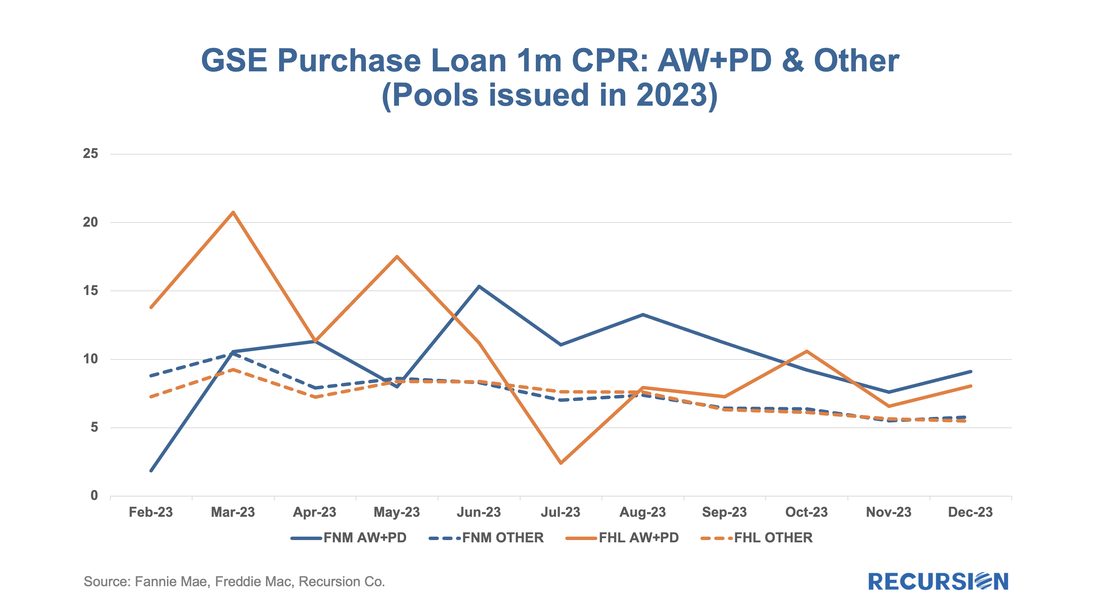 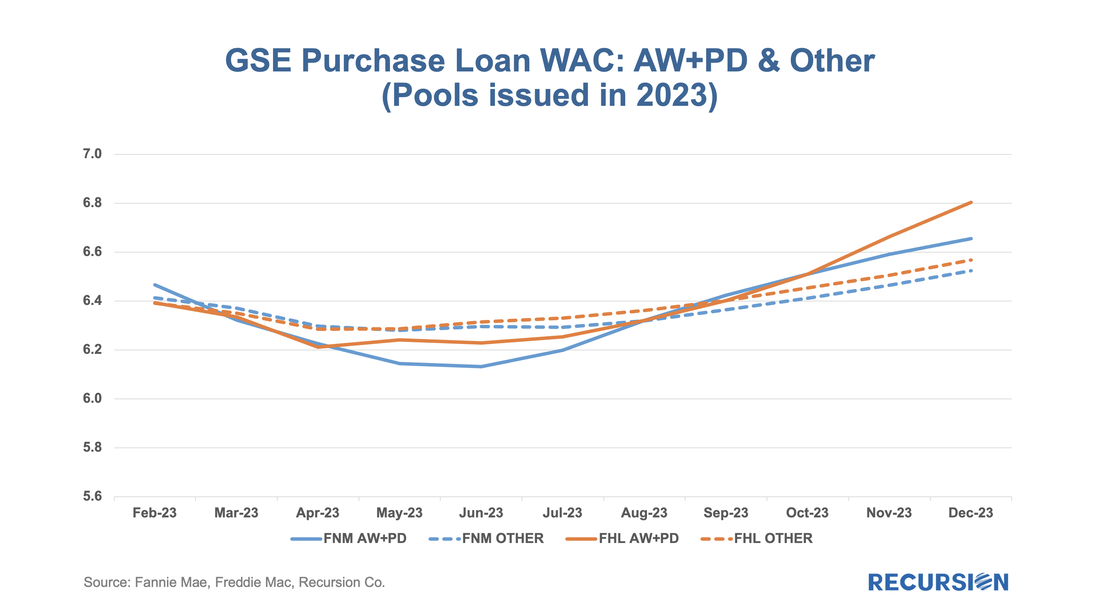 The loan counts here are quite small, so it is not surprising to see a noisy CPR chart for these categories. On the other hand, the trend increase in FHL AW+PD loans relative to those of Fannie Mae can be seen, although it is a more recent development in this case. Our conclusion is there is enough distinction here to say that modelers and traders ought to keep an eye on collateral risk as an independent factor in their decisions. The single-family agency MBS market benefits from a set of consistent standards that allows traders and analysts to make straightforward judgments about relative value between securities. This is particularly the case for the conforming mortgage market since the single security UMBS market was launched in June 2019. The result is a market that is very liquid, supporting homeownership and affordability. There is a very different situation in the multifamily space. The programs are very distinct across, and even within Agencies. This is particularly the case for the Ginnie Mae program, which consists of construction loans that are lines of credit that are drawn upon, and then converted to project loans. The two largest programs within the GSE multifamily space are the Fannie Mae DUS program[1], where losses are shared between Fannie Mae and the underwriting banks, and the Freddie K-deals, where losses are shared with investors[2]. Both Agencies have numerous smaller programs as well with their own distinct characteristics. In the single-family space, the unit of analysis is the mortgage. These are pooled, and pools and loans are sometimes, in turn, aggregated into CMOs (We classify highly-structured deals such as Freddie K, Q, ML, SB, etc., as CMOs, too). Investors have a complete picture of activity in this market. In the multifamily space, however, the picture is murkier. There are two reasons for this. First is the multitude of different programs across the Agencies as cited above. The second is that a consistent data set for multifamily loans across the three agencies is not easily produced, as loans are typically securitized into pools, however, Freddie tends to securitize loans directly into structures more like CMOs, such as Freddie K, Q, SBL programs[3]. A year ago, we posted a note that described our bottom-up approach to sizing the multifamily market and validated this by comparing our calculation to similar figures obtained from the Federal Reserve Z.1 report. We are pleased to report that this approach continues to provide an accurate picture of total market size as our figures for the third quarter have consistently aligned within a margin of 0.5% for the past three years. 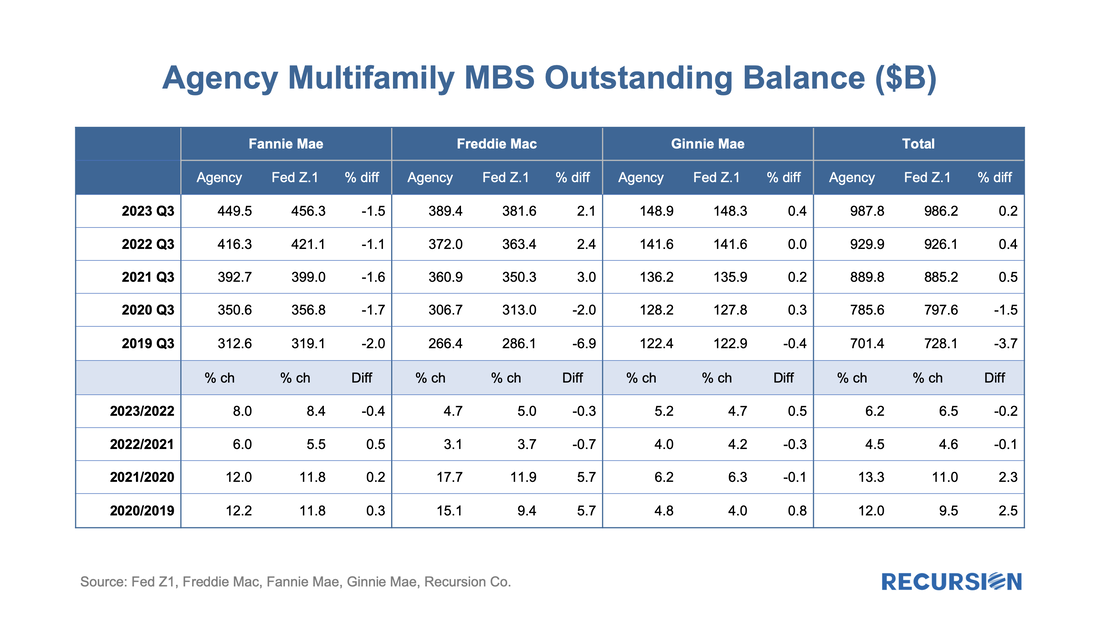 Some months ago, we set off to assess the impact of high interest rates on the usage of appraisal waivers. It soon became clear that we first needed to look in some detail at recent developments in the structure of the new market for appraisal modernization[1]. In this piece, we return to the original question. To begin we look at the landscape of loan deliveries for Freddie Mac and Fannie Mae across the suite of available approaches towards appraising property values. Below find such charts for purchase mortgages. 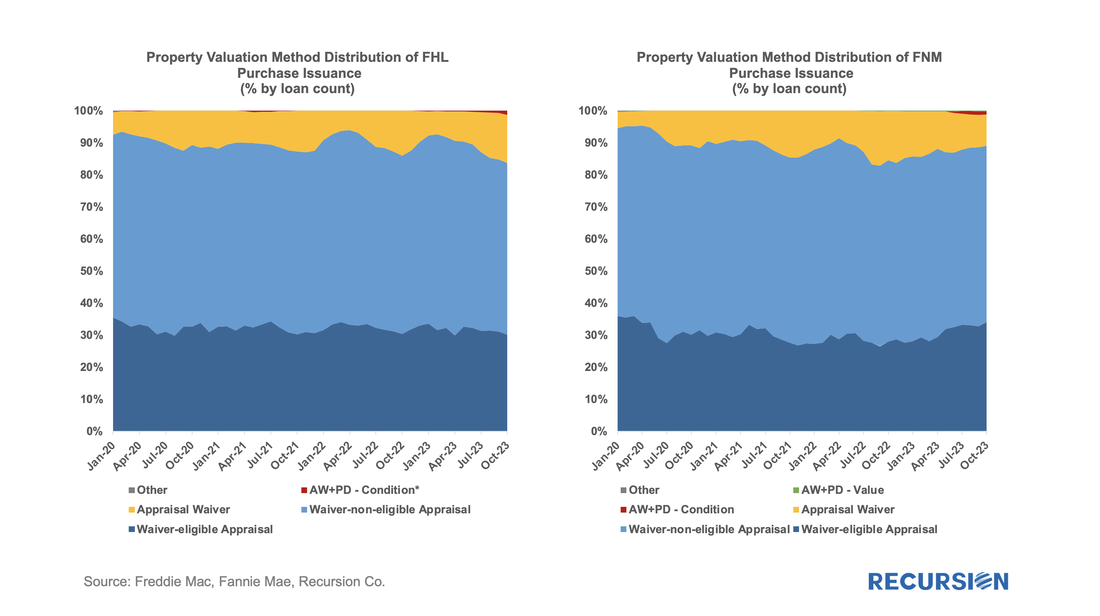 On June 29, 2023, both Fannie Mae and Freddie Mac announced enhancements to their MBS disclosures starting with the September monthly release[1]. The data covers active pools issued back to January 2022. As rates were quite low prior to this time, these disclosures cover the relevant period of high demand for buydowns: 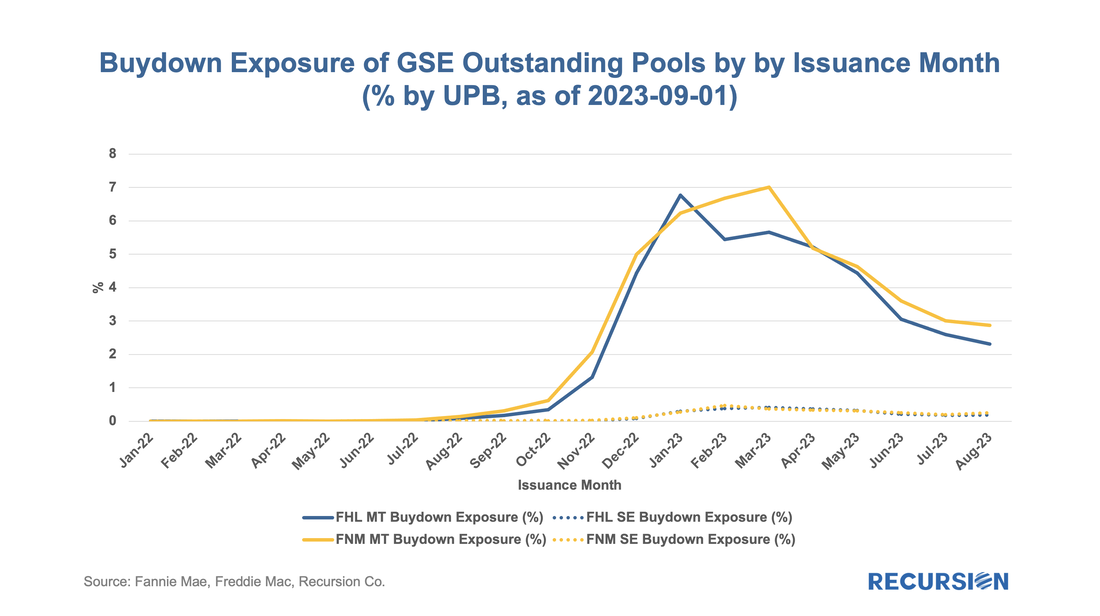 |
Archives
July 2024
Tags
All
|
 RSS Feed
RECURSION |
|

Copyright © 2022 Recursion, Co. All rights reserved.