|
New research by Yihai Yu at MSCI shows that historically high mortgage paydowns and price premia related to the Covid-19 crisis creates a situation where MBS securities could exhibit negative durations.
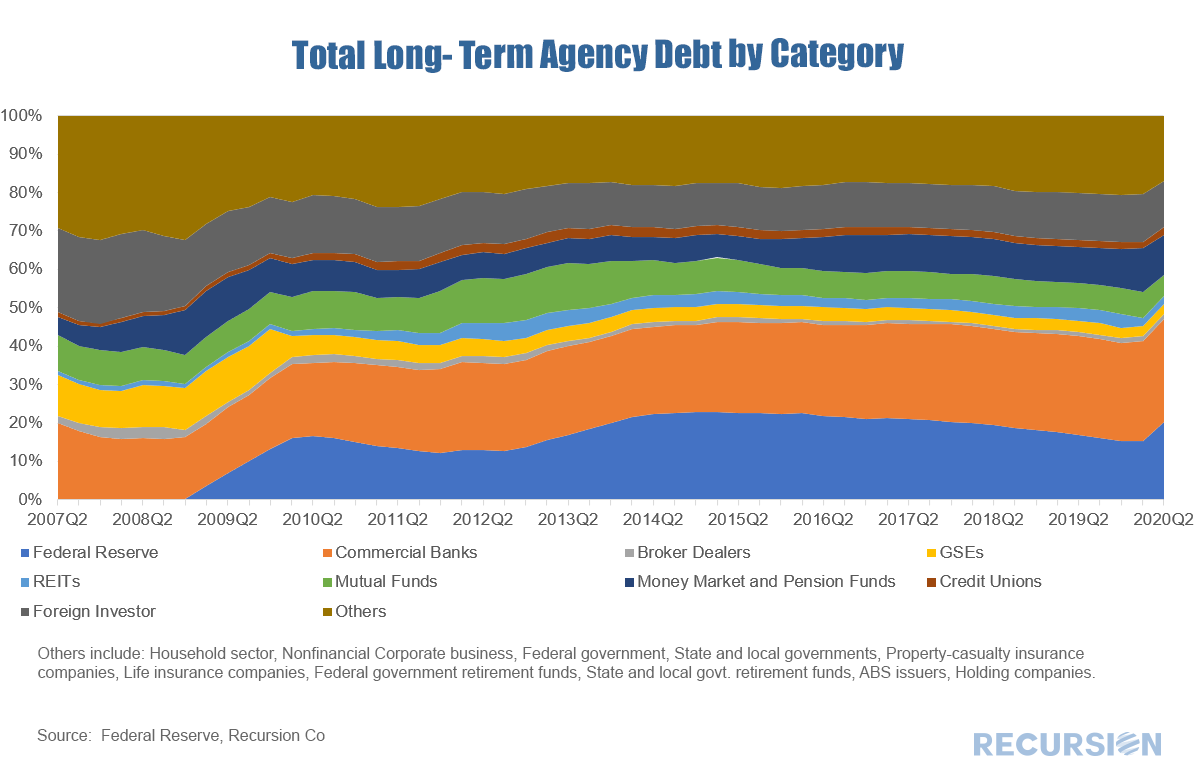
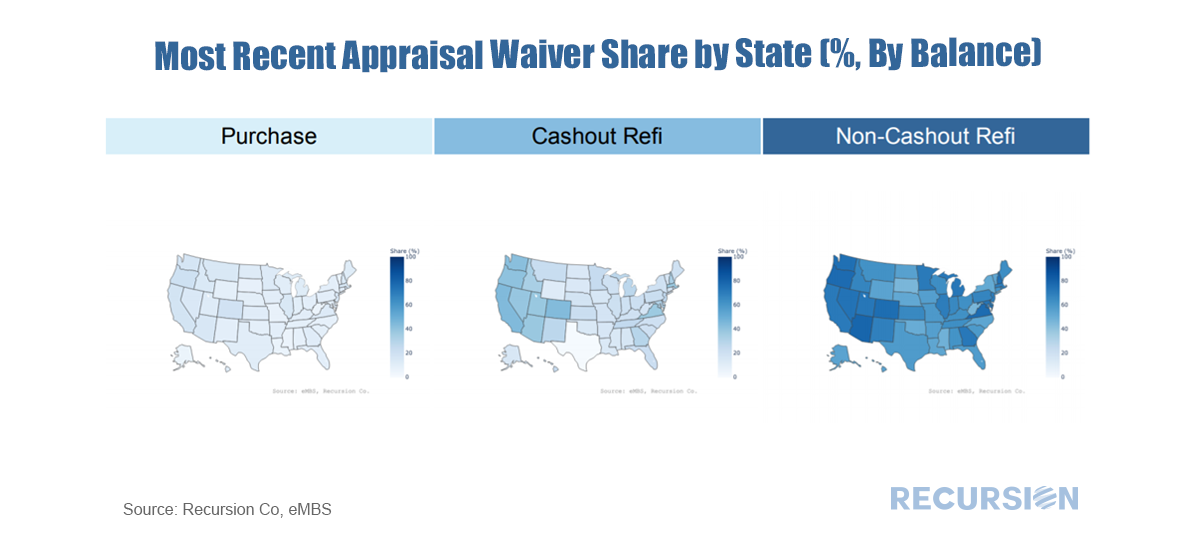
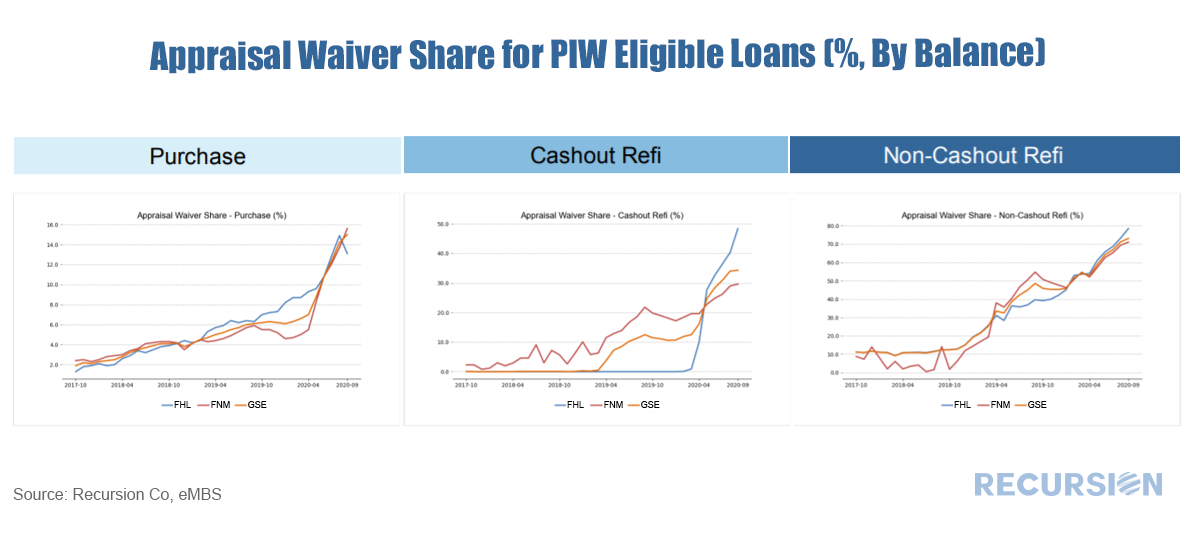
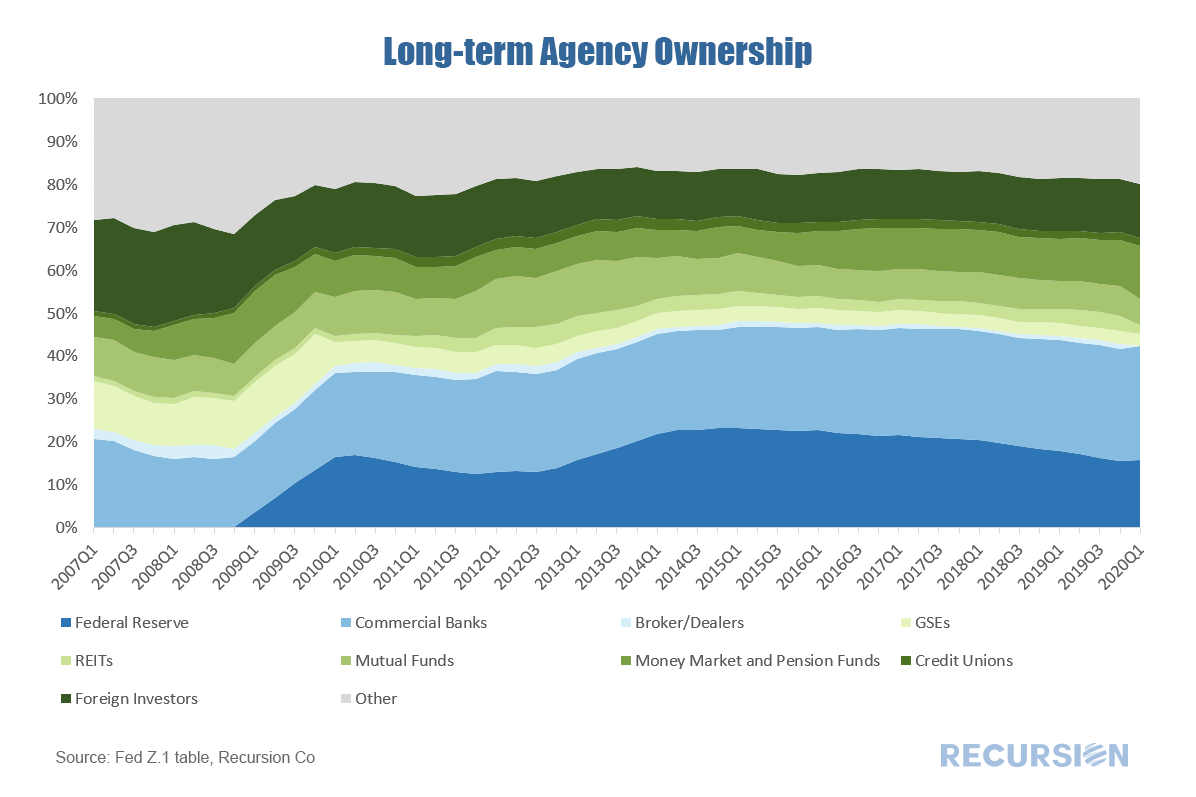
https://www.msci.com/www/blog-posts/can-mbs-duration-turn-negative/02108224451 This unusual situation arises because the extremely fast prepayment speeds can exceed the price impact of lower yields. This nuanced observation relies on careful calculations of the dollar amount of paydowns derived from Recursion data. The Federal Reserve recently released its quarterly Z.1 report: The Financial Accounts of the US (formerly known as the Flow of Funds) for Q2 2020. This voluminous dataset contains very detailed information describing financial flows and stocks across all major segments of the economy. For our purposes the key chart is the distribution of holdings of Total Long-Term Agency Debt (Agency MBS + Agency notes and bonds): The clear takeaway for Q2 is the central bank gained share as it took unprecedented actions to stabilize the financial system in the wake of the Covid-19 crisis. The Fed’s share of the stock of Long-Term Agency Debt jumped by about 4.9% from Q1 to Q2, a record high increase. The biggest losing category was “Others” which fell by 3.6%. This loss came largely from the household subsector within this category. The “Commercial Banks” share rose by 0.9%, but this does not necessarily imply greater appetite for mortgage risk as depositories are increasing their securitization rate by swapping whole loans for securities[1]. Finally, the “Foreign Investor” category lost 0.5% to a 7-quarter low. In March 2020, both Fannie Mae and Freddie Mac began to release information regarding “Property Valuation Method” in their loan-level data releases. Based on the availability of this flag, Recursion Co has developed the GSE Property Inspection Waiver Monthly Report to reflect mortgage underwriting trends in this area, beginning in early October. Below are some sample contents of the report. Recursion has programmed the appraisal waiver eligibility guidelines for each GSE into its Cohort Analyzer. The following charts show the shares of PIW loans for each state by loan purpose. For GSE newly issued loans, the West Coast has an overall higher PIW share than the East Coast. The report also provides information about PIW usage. The onset of the Covid-19 pandemic has resulted in an accelerating trend for loans with appraisal waivers across all loan purposes. If you would like to learn more details about Recursion’s GSE Property Inspection Waiver Report, please contact [email protected].
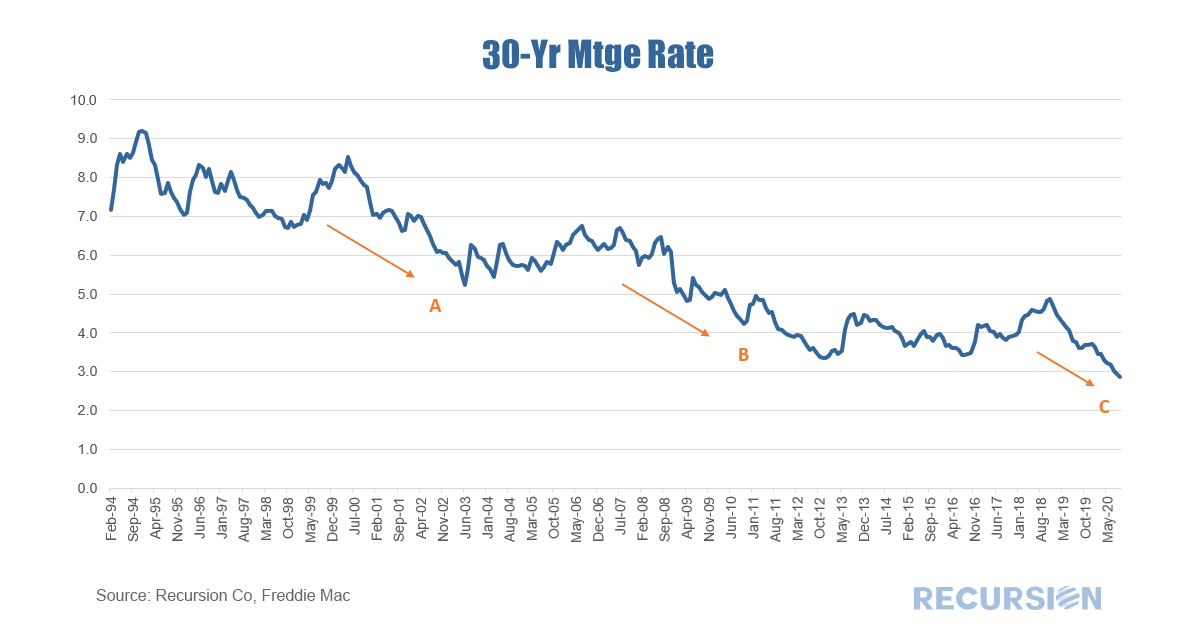
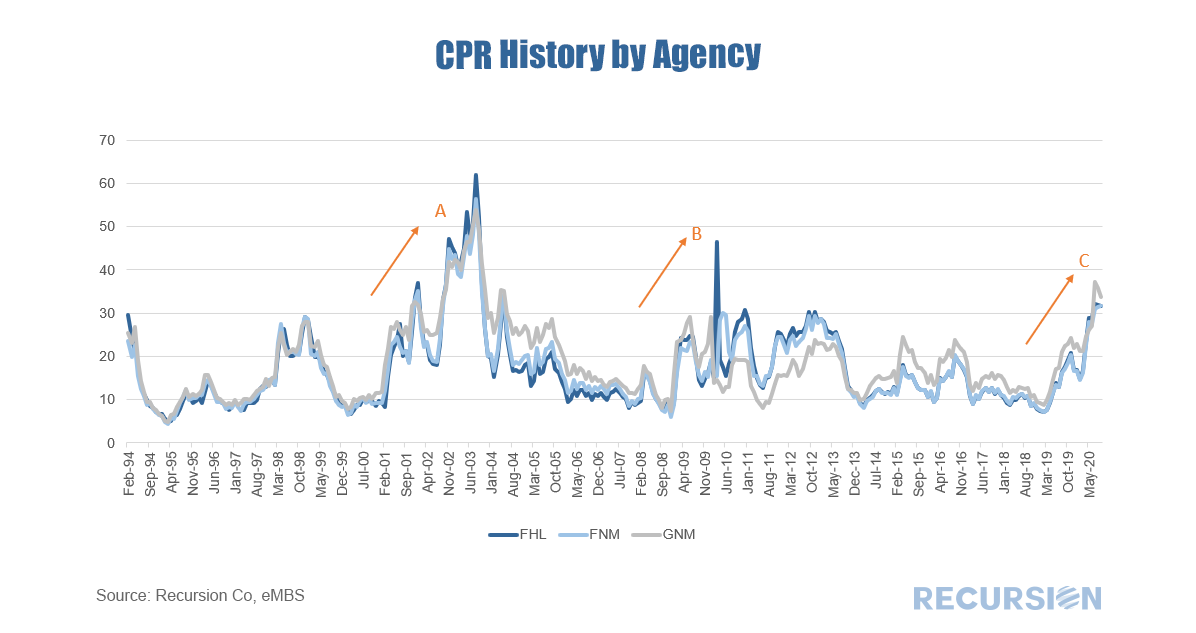
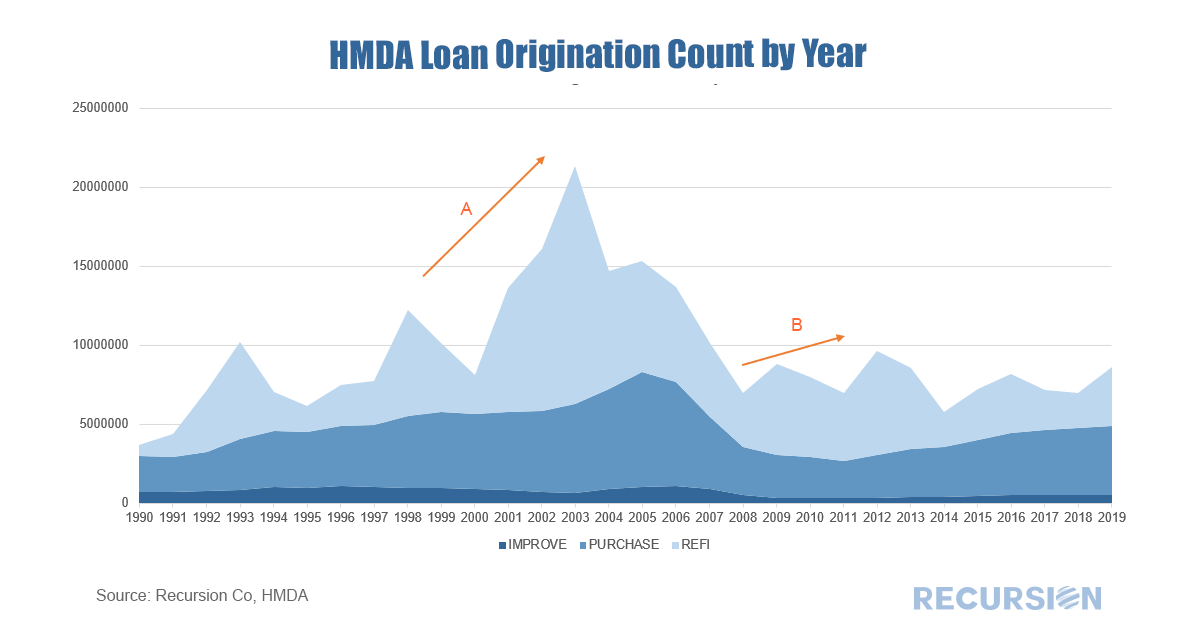
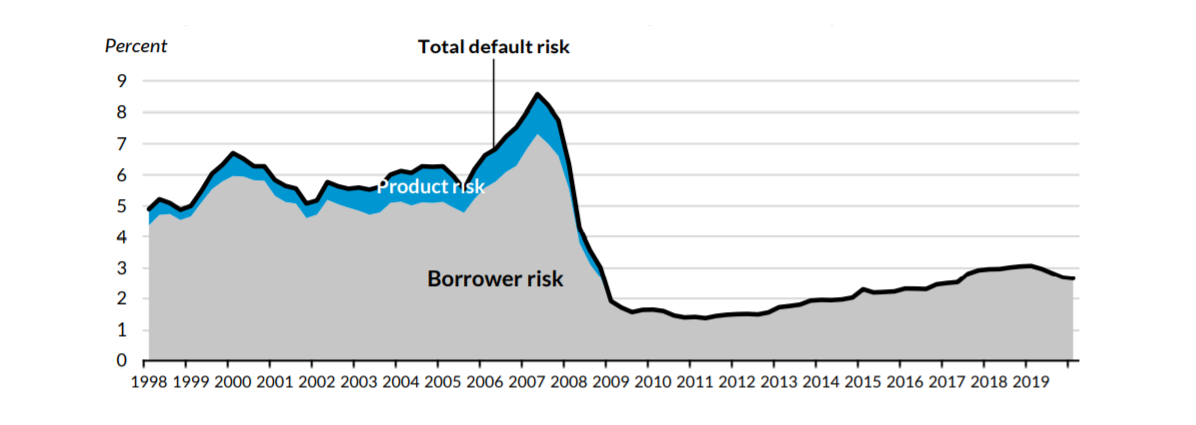
The Covid-19 pandemic has resulted in a great economic shock that has been met with a tremendous policy reaction in the form of interest rate cuts and MBS purchases by the central bank. Prepayments have picked up substantially during the year. The question arises as to whether the magnitude of the response is unusual compared to previous episodes of rate declines, and whether they can rise further should borrowing costs fall further. The magnitude of the relationship between rates and refis is complex and depends crucially on a number of factors. First, the relationship is path-dependent. That is, it doesn’t just matter if rates fall 1.0%, but whether this decline takes rates to new lows so that the biggest possible set of borrowers can profitably refinance. Great gobs of sophisticated statistics and modeling go into forecasting prepays on the part of lenders and investors. But a look at prepays over time shows three main waves of refis over the past 20 years. The first (A) is 2000-2003, (B) 2008-2013, and (C) 2019-2020. In all three instances, rates reached new lows. The dates correspond roughly to the times when the mortgage rate broke to a new low until a new trough was formed (or the present in the case of “C”) Here are the corresponding periods for prepays: Here are the corresponding periods for originations: Here is a summary of the three periods: Notably, the biggest jump in prepays occurred in the early 2000s, reaching a record high of 60 CPR. Rates had fallen substantially based on aggressive Fed ease in the wake of the bursting of the tech stock bubble. This passed right through to refis. There was also a substantial decline in rates with the Global Financial Crisis(GFC), but the refi response was more muted due to declining house price, but perhaps also more stretched out in time (off and on through 2013). The current episode with Covid-19 has resulted in record-low mortgage rates, and a substantial spike in refis, but still well below the experience of 2002-04. What might explain the differences? A clear place to look is at credit conditions. If rates drop the same amounts in time periods X and Y, but credit conditions are tighter in Y than X, we can reasonably expect a bigger refi impact in X than Y. Below shows the Urban Institute’s Housing GSE Credit Availability Index, which is used to evaluate lender’s risk tolerance: Note: Urban Institute’s Housing Credit Availability Index for GSE Chanel. Adapted from Urban Institute Housing Finance at a Glance (August 2020). (https://www.urban.org/research/publication/housing-finance-glance-monthly-chartbook-august-2020)
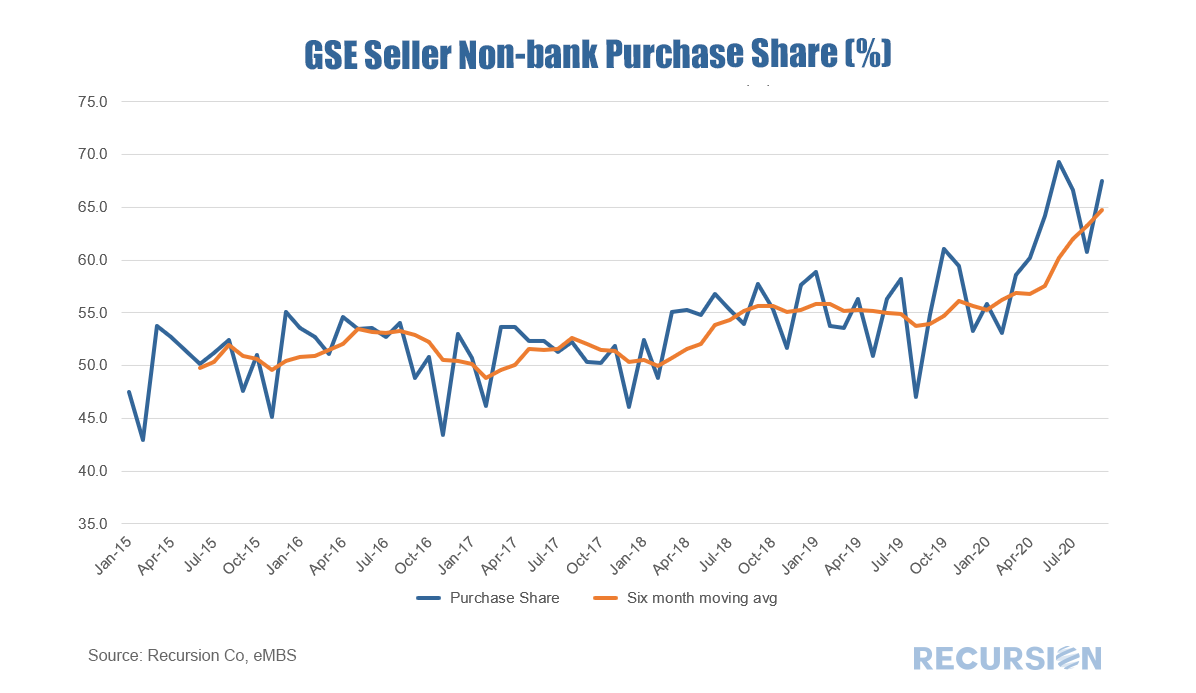
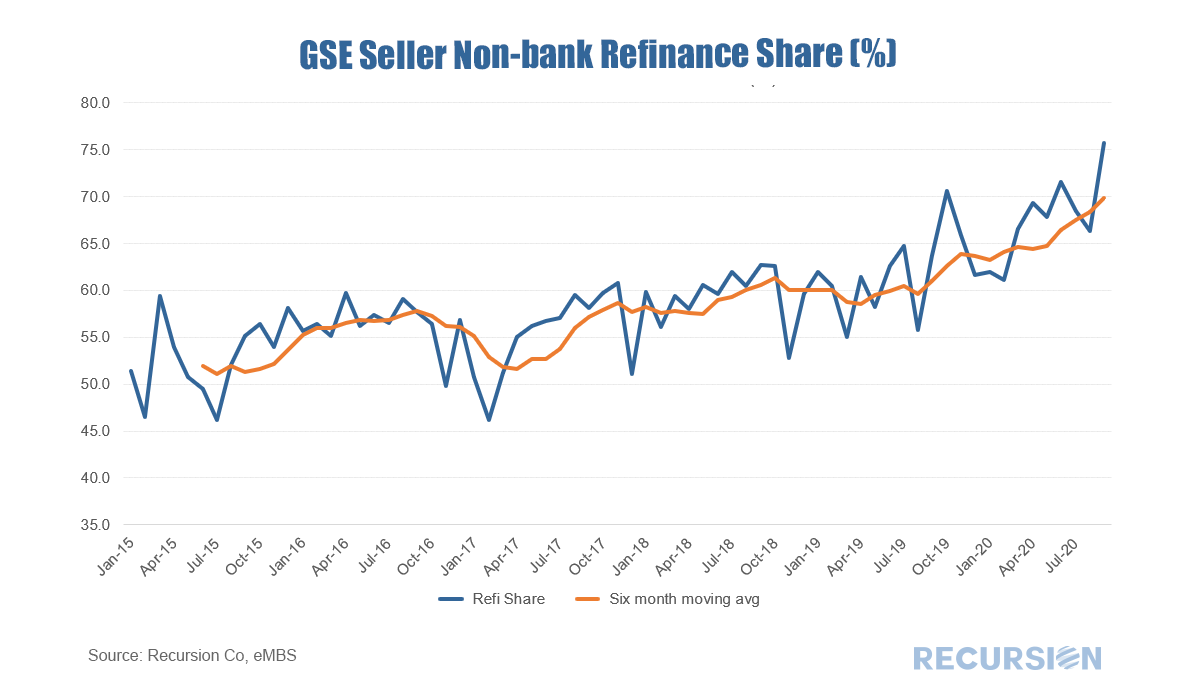
As can be seen, credit was extremely loose before the GFC, very tight thereafter, followed by a period of modest loosening until 2019. This correlates well with the magnitude of the response of prepays to interest charges in the three regimes. Too hot, too cold and just right? Maybe. All of this is important not just for investors but for the central bank as the Fed attempts to steer the economy through this uniquely uncertain period. Recently, credit conditions appear to have started tightening. It’s unclear whether this is a “normal” market reaction as volumes rise and capacity is constrained (good credits are easier to process) or whether lenders are becoming more cautious based on a more pessimistic view of the economic outlook. There is a big difference between the two in terms of choosing a successful investment strategy or an optimal monetary policy. The answer is unlikely to come from attempts to model borrower and lender behavior in a nuanced way and more likely to be discerned by careful observation of emerging trends in big data sets. We have commented previously on the rising share of nonbank deliveries to the GSE’s in the wake of the Covid-19 crisis[1], but the data just released for the month of July shows this trend to be picking up at an astonishing pace. This time, let’s break the market up into two pieces: Purchase and Refi:
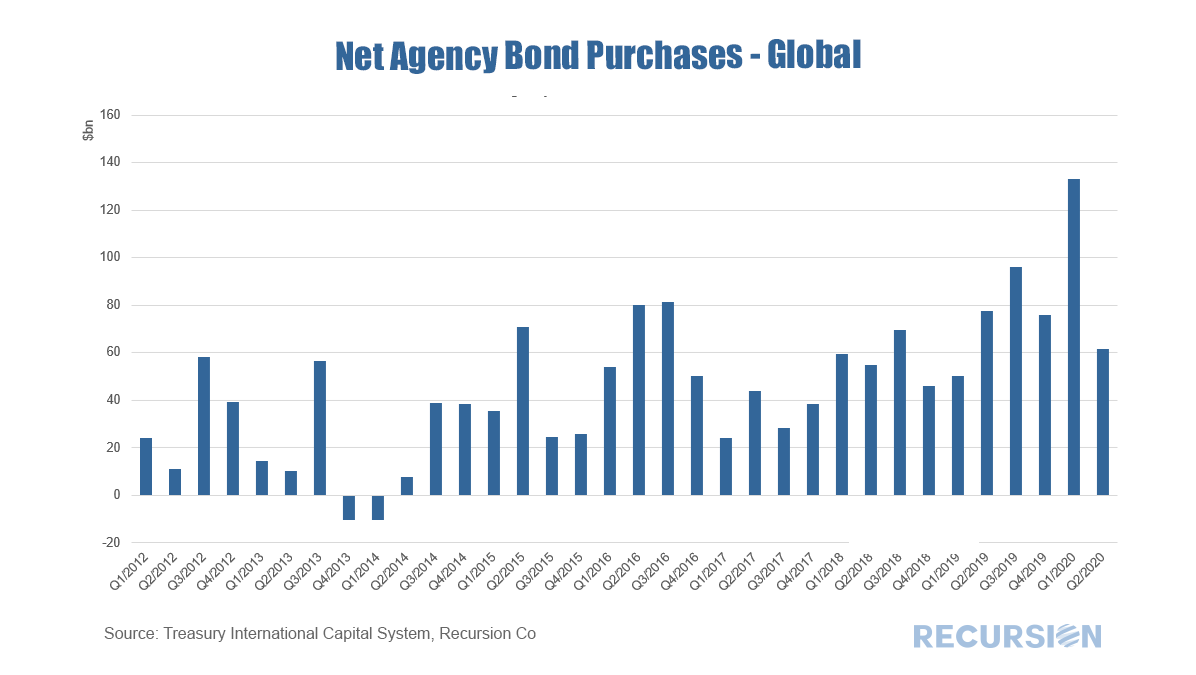
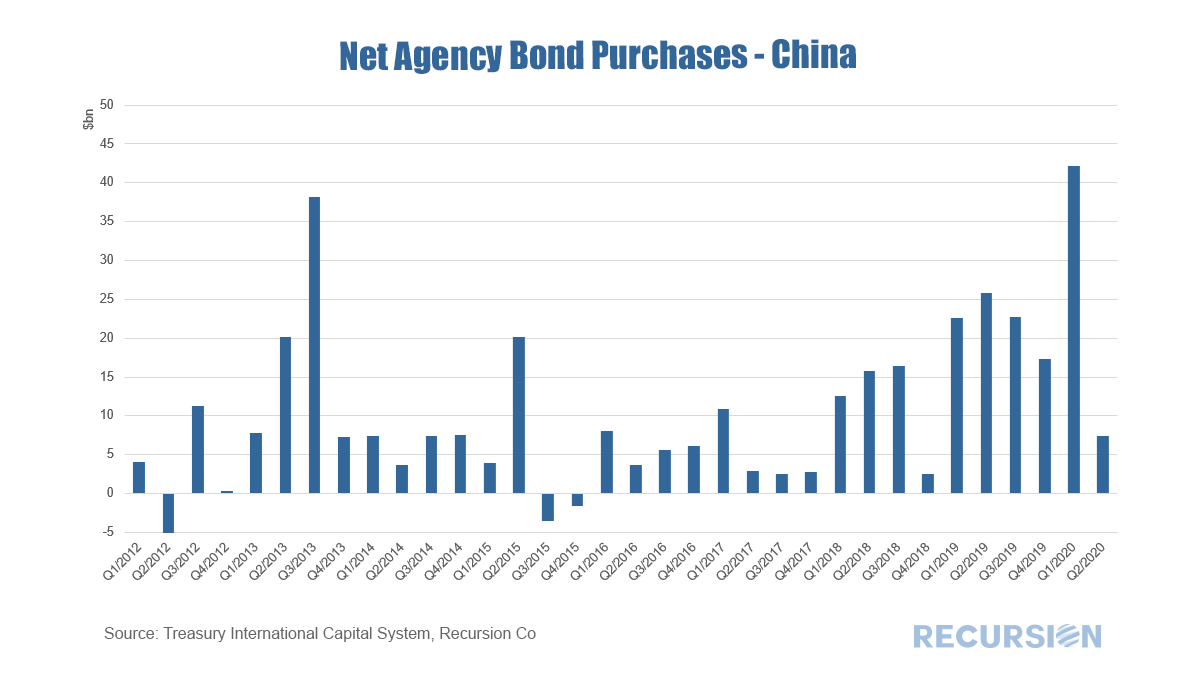
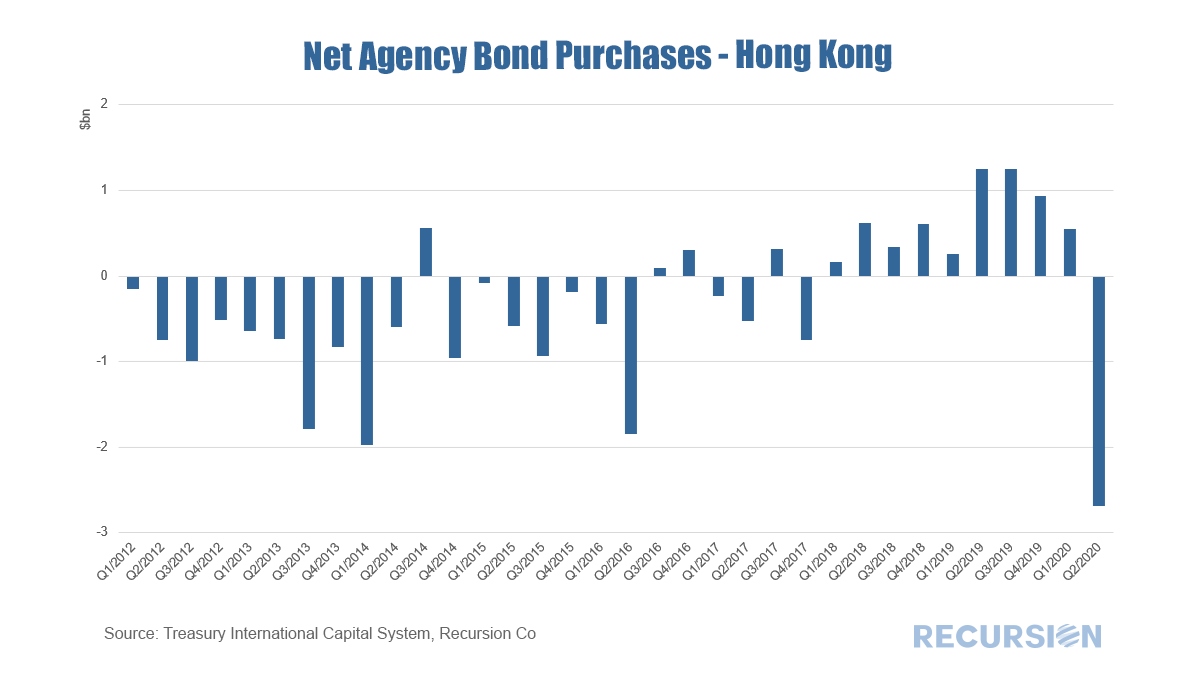
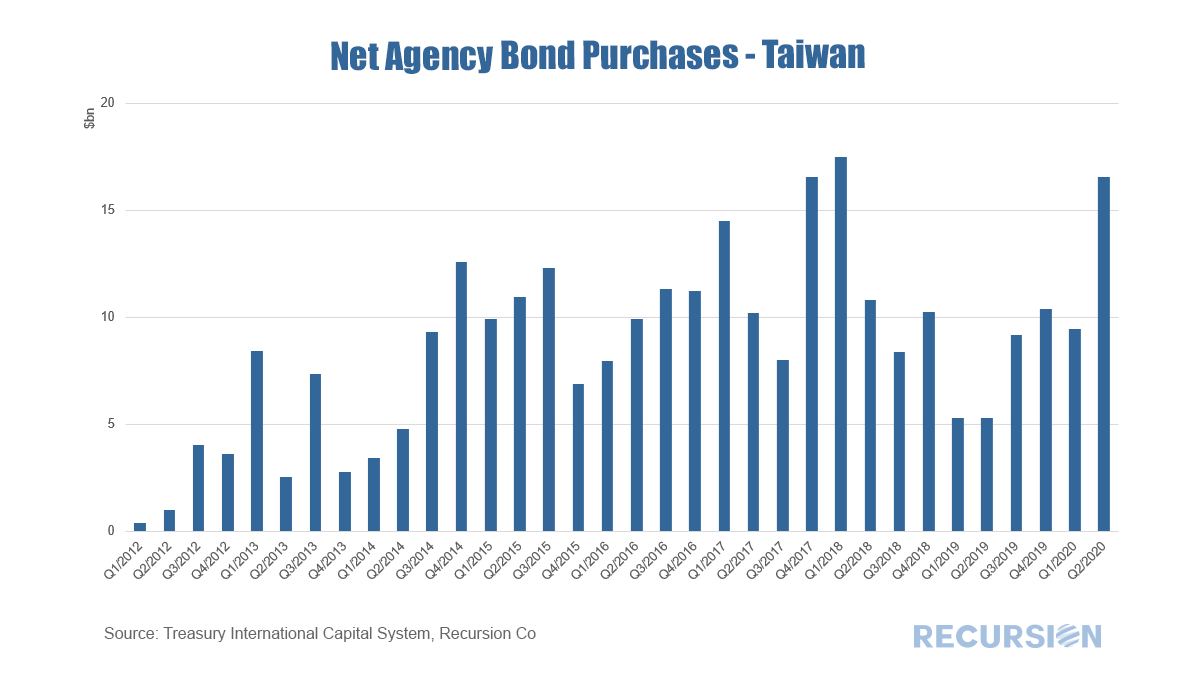
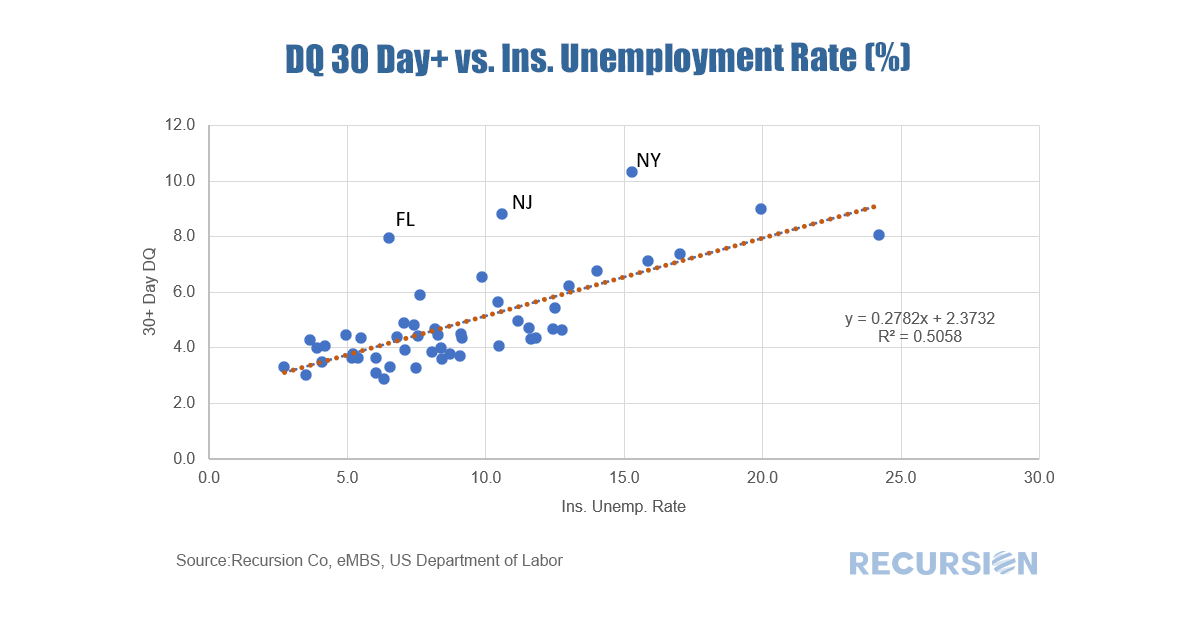
In a previous blog, we pointed out the importance of overseas investors to the mortgage market.[1] We looked at the share of holdings from this sector, as well as on the country breakdown within the sector. These shares tend to move somewhat smoothly over time as they represent very large portfolios of assets. There is, however, a second data set released in the TIC system every month, namely net capital flows. These data are purchases (or sales) and can be quite volatile in the short term. But they may provide a picture of emerging trends that will not show up in the holdings data for some time. The same important caveat that applies to the holdings data applies as well to the flow data: the data on purchases and sales of assets reported for a country may be on behalf of agents domiciled in a different location, even the US. We also noted in that post the many motivations behind foreign holdings of stocks of long-term agency assets and these apply to the flow data as well. There is another caveat for the flow data, however. A key characteristic of MBS is prepayment. That is, homeowners have the right at any time to prepay their mortgage if rates fall. Also, if a homeowner sells the home the mortgage is typically prepaid and a new mortgage obtained if a new home is purchased. So if an investor faces prepayments, but wants to hold their stock of MBS steady, they may purchase new securities. Such purchases are not based on any assessment of near-term returns in various asset classes, but is rather an automatic flow based on longer-term considerations. This phenomenon is particularly notable in an environment of falling interest rates, as prepayments would be expected to rise. An interesting group of countries to look at in this regard is Asia ex-Japan. The bulk of these holdings are maintained by official entities looking to maintain portfolio liquidity and generate favorable long-term returns. The issue of country of the beneficial owner is less important here. Yet, they are not immune to conditions in the current investment environment. The charts below show net purchases in total and for three Asian entities: China, Hong Kong and Taiwan. As we have been in a declining rate environment since the start of 2019, it is not surprising that purchases of long-term agency securities have been generally strong from the point of view of asset replacement over that time. But Q2 2020 marked a break in the pattern with the onset of the Covid-19 crisis. Flows were smaller than in Q1, notably so for China, but markedly so for Hong Kong which engaged in outright sales of assets. Interestingly, Taiwan bucked the trend and added substantially to its holdings in Q2 compared to the prior quarter. In the background, the economic and financial environment remains highly uncertain. Added to that is the increasing factor of rising geopolitical uncertainty as we head into the US election. Following these flows may provide useful insights into how different agents assess these considerations. In a prior post, we demonstrated how the loan-level data for the CRT reference pools could produce a good estimate for delinquency rates by state in the conforming mortgage market[1]. One way to confirm this would be to compare these to the unemployment rates by state. In fact, a scatter plot of 30+ day dq’s from the Freddie Mac STACR program vs unemployment rates reveal a striking correlation:
The MBS market is the second-most liquid market in the US after the Treasury market. The collateral for these securities is completely domestic but a significant share of the ownership is held by offshore entities. As such, investors need to be cognizant of the attitudes of overseas investors towards this market, particularly in the current highly charged geopolitical climate.
The following chart shows total holdings of Agency and GSE-backed securities over time broken down by a broad category of investors. The most recent figure is as of Q1 2020; Q2 data will be released later in September. |
Archives
July 2024
Tags
All
|
RECURSION |
|
Copyright © 2022 Recursion, Co. All rights reserved.


 RSS Feed
