• HOME
  • solutions
    • RECURSION ANALYZERS
    • Agency XRay
    • Mortgage Company Data
    • Recursion DataCloud
    • Customized Solutions
  • BLOG
  • CLIENT LOGIN
    • Agency XRAY
    • Recursion Analyzers
  • ABOUT US
    • OVERVIEW
    • OUR TEAM
    • Recursion In News
    • STRATEGIC PARTNER
  • CONTACT
RECURSION CO
  • HOME
  • solutions
    • RECURSION ANALYZERS
    • Agency XRay
    • Mortgage Company Data
    • Recursion DataCloud
    • Customized Solutions
  • BLOG
  • CLIENT LOGIN
    • Agency XRAY
    • Recursion Analyzers
  • ABOUT US
    • OVERVIEW
    • OUR TEAM
    • Recursion In News
    • STRATEGIC PARTNER
  • CONTACT
BLOG

Using GSE Credit Risk Transfer Data to Track Delinquencies at the State Level

7/8/2020

 
The loan level tapes, delivered by the GSEs each month, unfortunately only contain delinquency data (DQ’s) at the pool level, unlike the Ginnie Mae tape which is at the loan level. One implication of this discrepancy is that state-level DQ’s can be calculated for the Ginnie programs but not, in general, for the GSE’s. An alternative approach for tracking GSE DQ’s at the loan level is to examine the performance of the reference loans in their Credit Risk Transfer (CRT) deals.

The sample of loans contained in the CRT tapes is a significant portion of the total deliveries to the entities but are not a complete sample. For CAS, the UPB represents 25%-30% of all FNM balances, while for STACR, it represents 50% of all FHL balances.
​
The primary question here is whether the CRT reference loans are a representative sample of the total for delinquencies. The way to validate the assumption is to compute a national aggregate of delinquencies for the whole set of loans in the CRT pools and compare these to the DQ data contained in the GSE monthly summaries[1].
Picture
Run Underlying Query
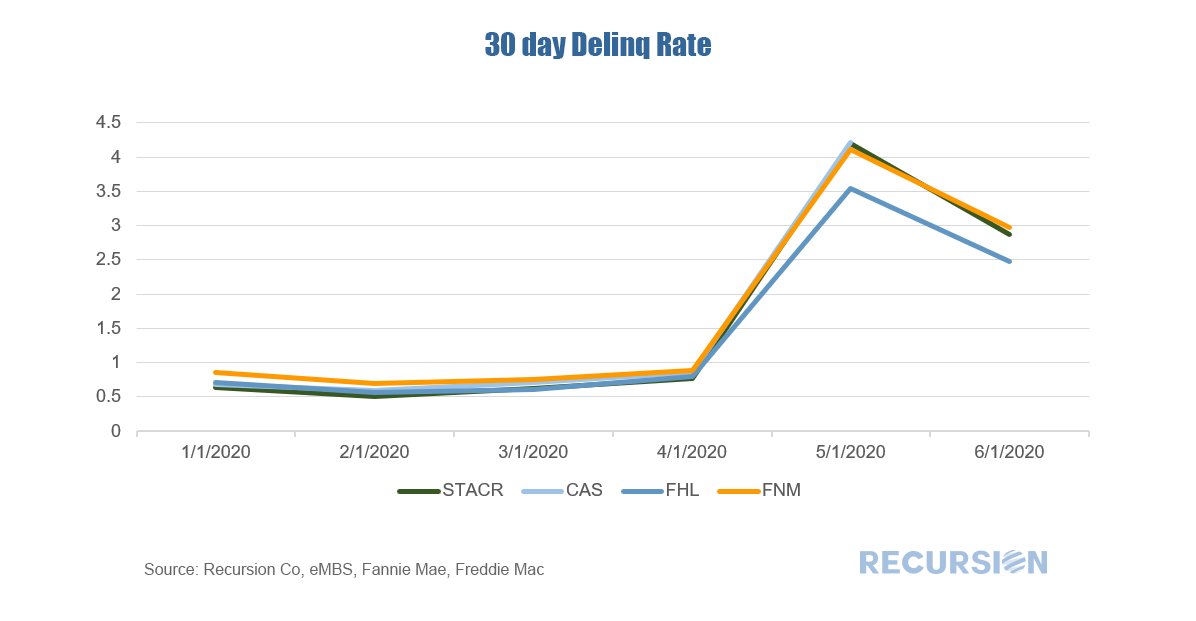
​There are a couple of important technical points that should be addressed. First, loan level data for the GSE’s is delivered during the evening of the 4th business day. The CRT data are delivered on or after the 25th.  In particular, the CAS program information is a month delayed from the STACR data.

We conclude that using STACR data as the proxy to calculate the delinquency rate at the state level would be a good choice as STACR covers 50% of FHL loans with only about a 2-week delay from the regular data release.
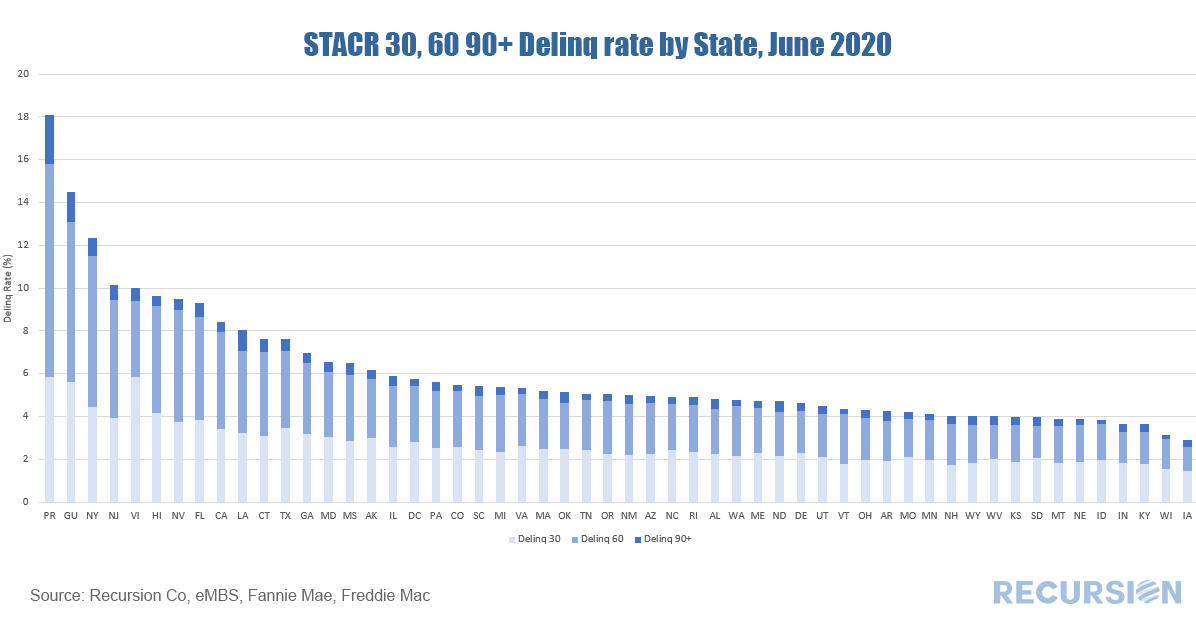
Picture
Run Underlying Query

[1] See https://www.fanniemae.com/portal/about-fm/investor-relations/monthly-summary.html and http://www.freddiemac.com/investors/financials/monthly-volume-summaries.html

    Archives

    February 2021
    January 2021
    December 2020
    November 2020
    October 2020
    September 2020
    August 2020
    July 2020
    June 2020
    May 2020
    April 2020
    March 2020
    February 2020
    May 2019
    March 2019
    February 2019

    Tags

    All
    Banking
    CMBS
    Cohort Analyzer
    Commercial Mortgage
    COVID 19
    CRT Analyzer
    EBO
    Fed Policy
    FHA
    Forbearance
    Ginnie Mae
    GSE
    HECM Analyzer
    HMDA Analyzer
    Mortgage Market
    Pool Level Analyzer
    Prepayment
    Recursion Achievement
    Recursion In News
    Reverse Mortgage
    Risk
    Team Building
    UMBS
    Underwriting

RECURSION

SOLUTIONS ​
Recursion Analyzers
​Agency XRay
​
Mortgage Company Data
Recursion DataCloud
Customized Solutions


ABOUT US  ​
Overview
​Our team
​Strategic Partner
CLIENT LOGIN   ​
Recursion Analyzers
​
Agency XRay

CONTACT

224 West 30th St., Suite 303, New York, NY 10001
Contact Us

Picture
Copyright © 2020 Recursion, Co. All rights reserved.​
  • HOME
  • solutions
    • RECURSION ANALYZERS
    • Agency XRay
    • Mortgage Company Data
    • Recursion DataCloud
    • Customized Solutions
  • BLOG
  • CLIENT LOGIN
    • Agency XRAY
    • Recursion Analyzers
  • ABOUT US
    • OVERVIEW
    • OUR TEAM
    • Recursion In News
    • STRATEGIC PARTNER
  • CONTACT