|
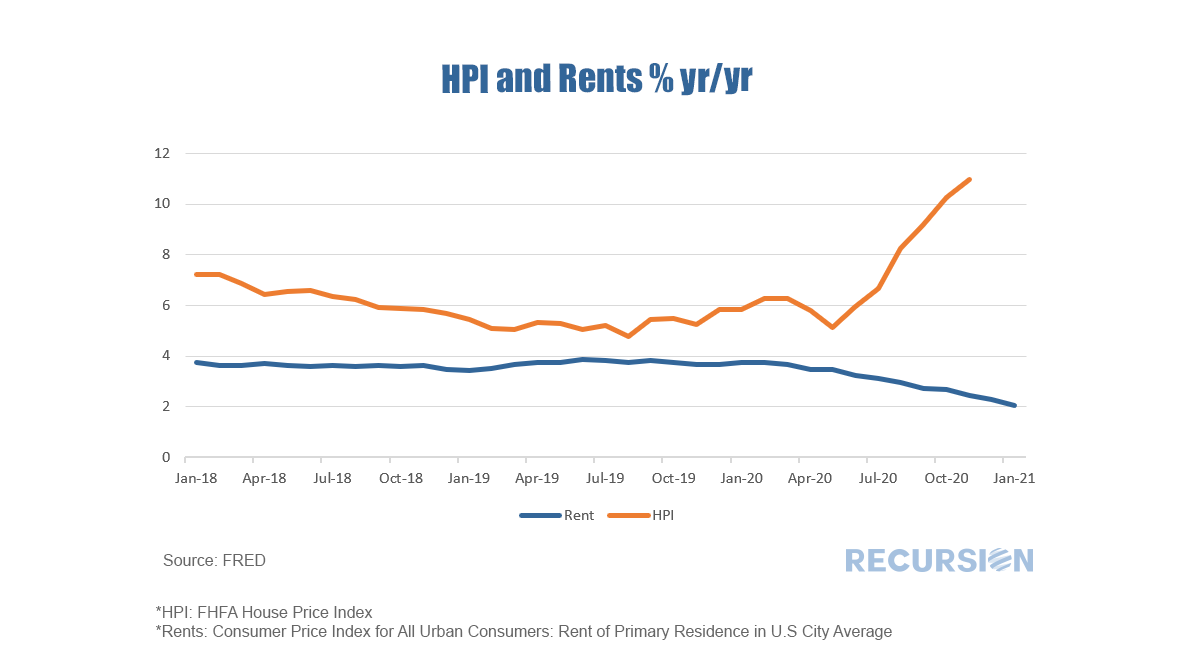
Assigning letters to economic recoveries (“V”, “L”, “U” etc.) has become a standard part of the economist’s toolkit for expressing a view on the nature of a particular forecast. The Covid-19 crisis has added a new letter to the lexicon, “K”. In a “K-shaped” recovery, some segment of the population experiences relatively strong growth, while others are left behind. Since housing tenure is an essential determinant of the distribution of household wealth, it is not surprising that we can clearly see this shape in the relative trends in house prices versus rents:
Quoting Recursion Data, Debtwire reported that Non-Bank EBOs fell back in February, even though the level is still multiple times greater than the average recorded across most months in 2020.
The analysis was performed using Recursion’s flagship product: Cohort Analyzer. MSCI’s MBS senior research analyst Yihai Yu shows how MSCI’s prepayment model closely tracked 2020’s month-by-month prepayment surge and how MBS prepayment regimes shifted in the past two decades using Recursion Data. The analysis was done using Recursion’s flagship product: Cohort Analyzer.
Recursion has been certified as a Participant in the U.S. Small Business Administration’s (SBA) 8(a)[1]. Business Development Program after submitting an initial application in 2019. Recursion’s sam.gov profile has been updated by SBA with its new 8(a) status.
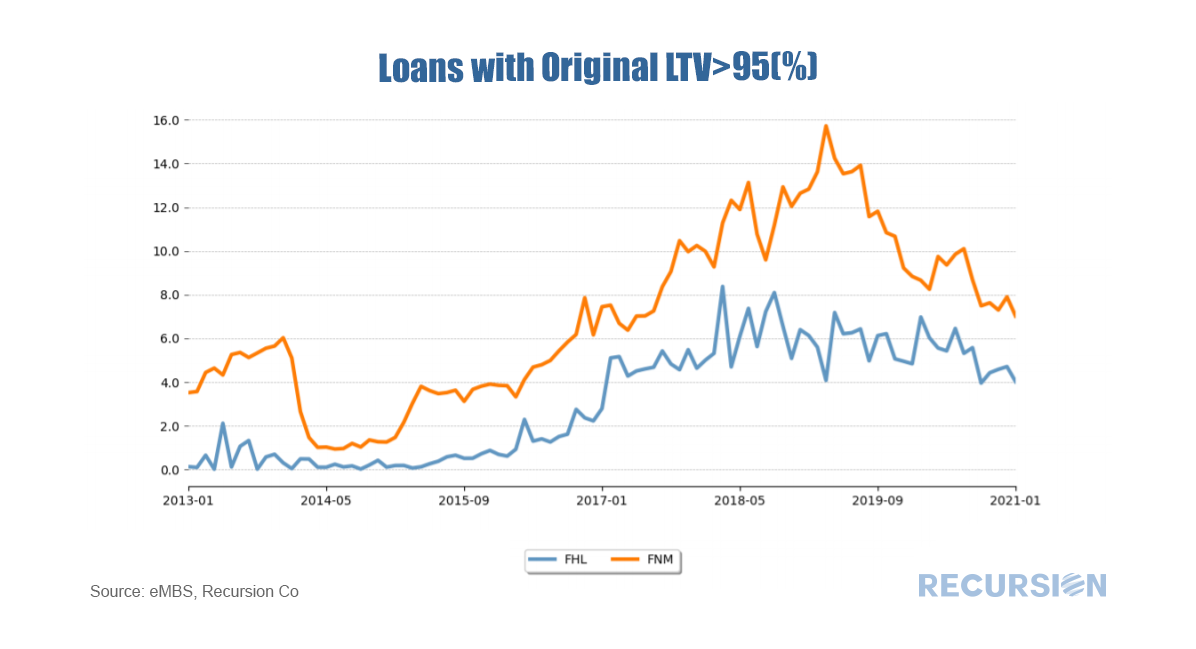
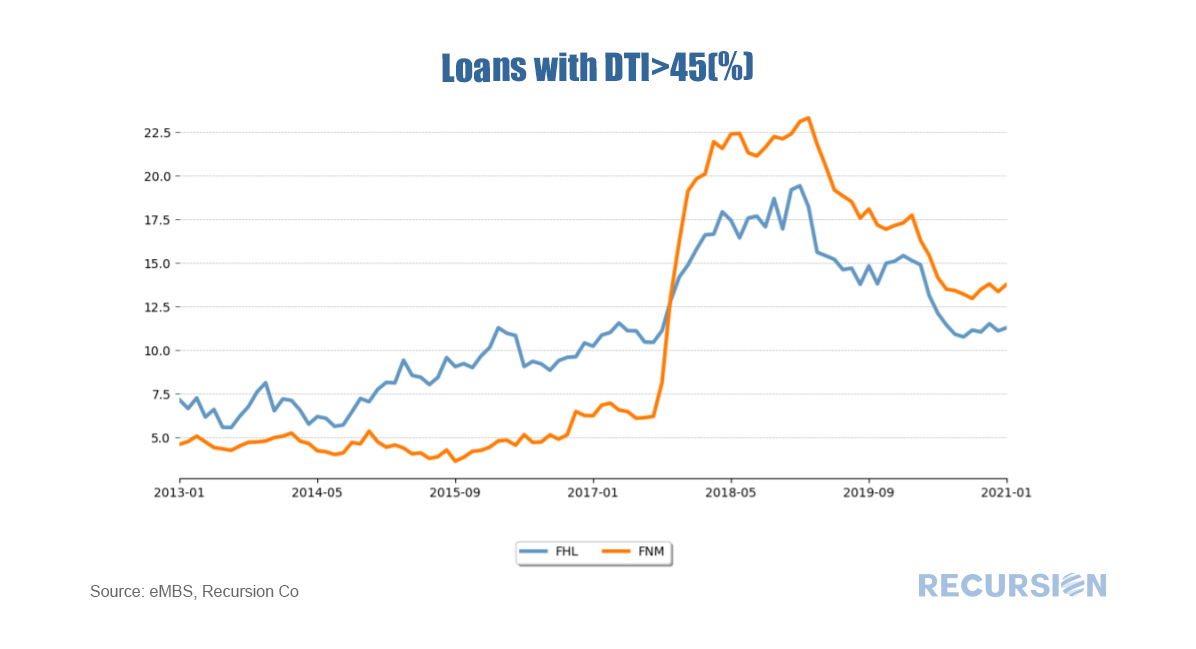
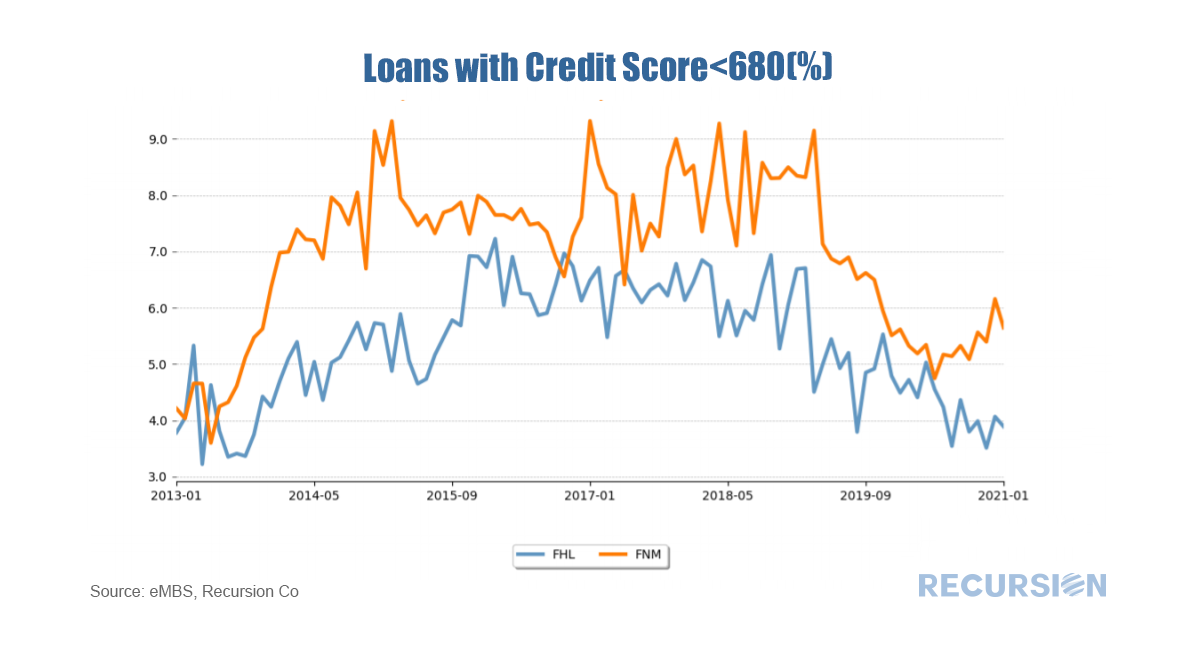
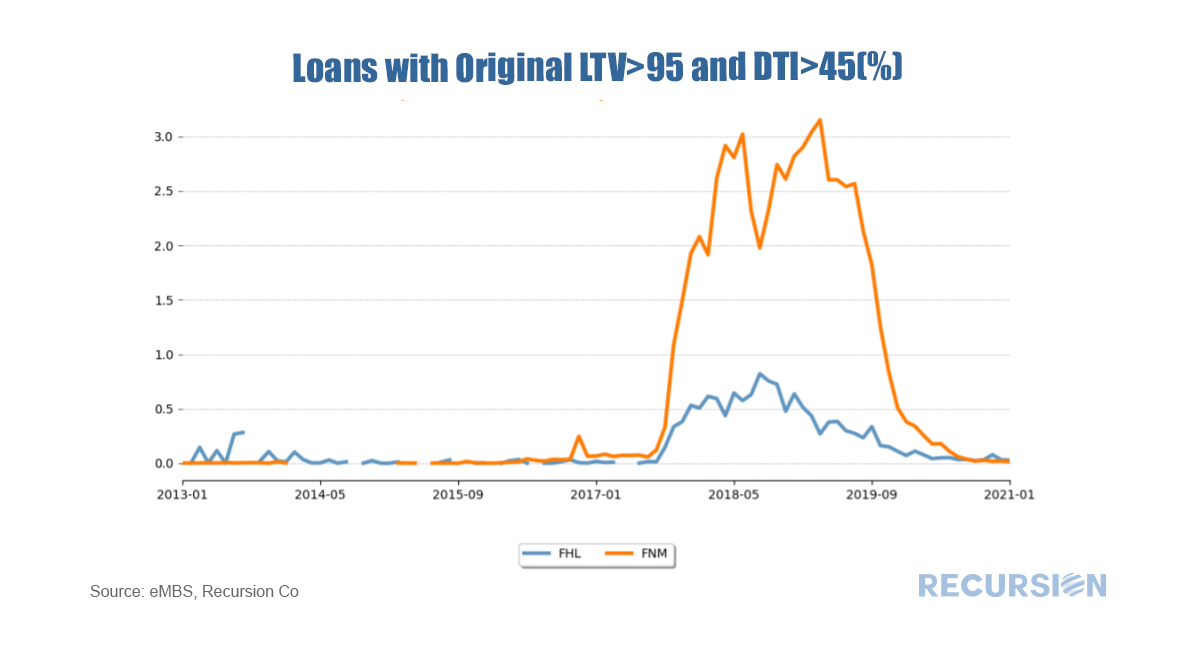
Our last post demonstrated that Fannie Mae performance at the pool level has been lagging that of Freddie Mac since the start of the pandemic[1]. The question remains as to why. The challenge in answering this question is that unlike the case for Ginnie Mae programs, Fannie Mae and Freddie Mac have not been releasing performance data on the loan level[2]. Those who subscribe to our monthly risk reports know that we have been tracking relative underwriting standards between the two mortgage giants for some time. We do this not by looking at the average levels of underwriting characteristics, but rather at looking at the tails of these characteristics. Our experience is that this is a far superior method for this as distinct policy about risk come in much clearer this way. We focus on the share of GSE deliveries with LTV>95, DTI>45, and credit score<680.
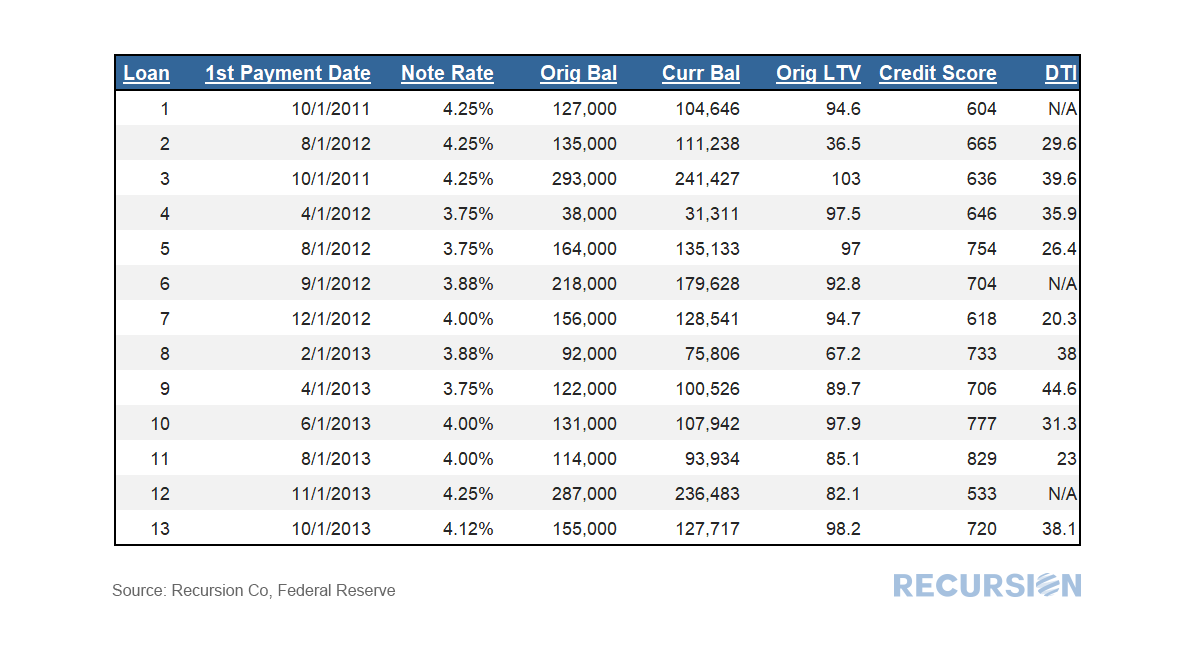
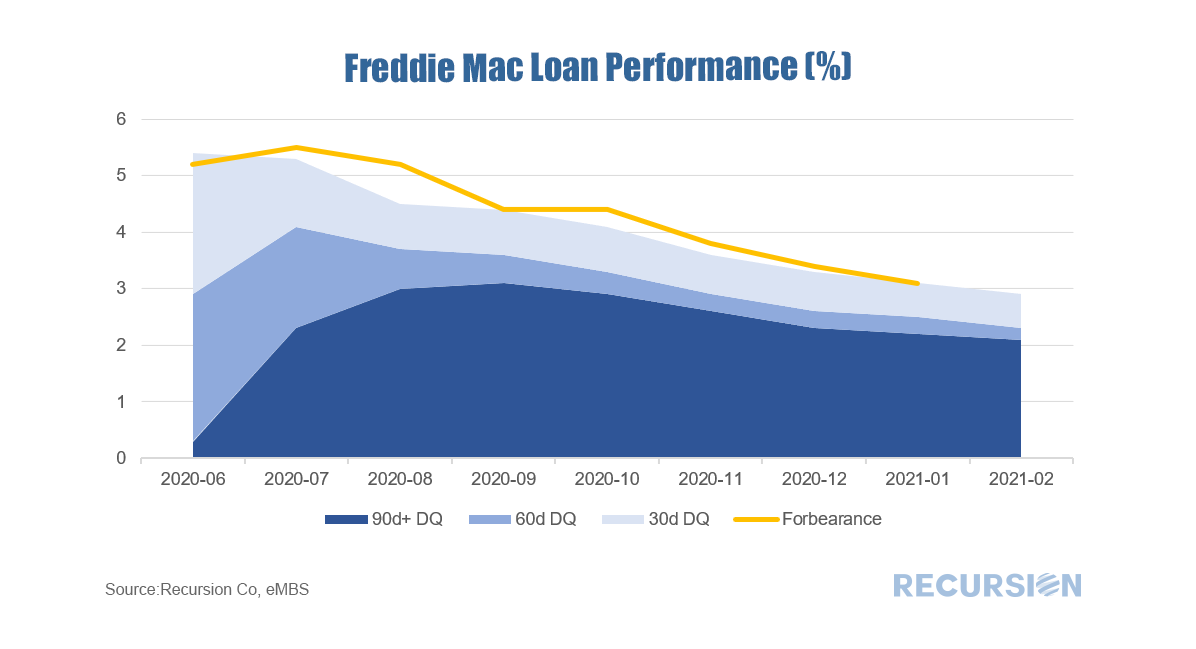
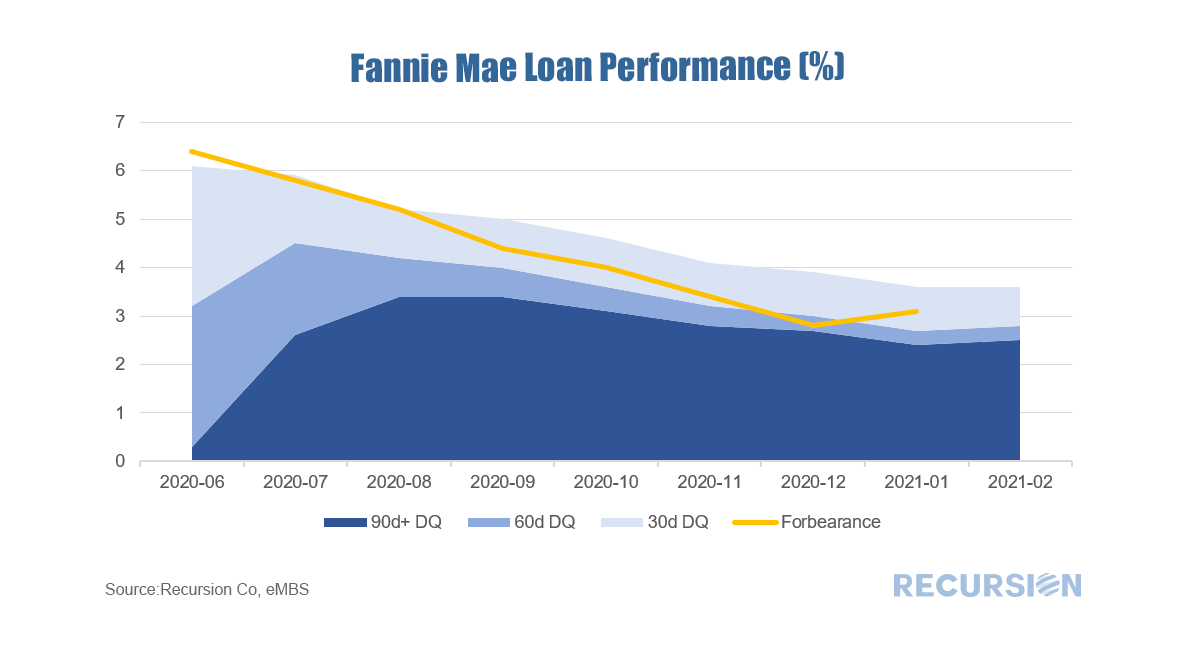
Sometimes, future trends can be seen in the weeds. In this case it’s the 12 FHA and 1 VA mortgages (out of tens of millions) that were securitized this month in Ginnie Mae pool G2 CA8080, the very first RG pool, issued by PNC Bank, delivered to the GNMII20C program. This pool type was first announced by Ginnie Mae last December 4[1], and consists entirely of loans that were bought out of pools and cured with partial claims. These are eligible for resecuritization after 6 months without a missed payment. A previous announcement was made by Ginnie Mae last June that prohibited loans in forbearance from being bought out of pools and resecuritized into any existing pool type[2]. This rule was enacted after large banks purchased a massive number of loans in forbearance and resecuritized them immediately, leading to concerns on the part of investors[3]. Is there anything interesting about these loans? The loans were all originated in 2011-2013, so they are pretty seasoned. Note rates range from 3.75% - 4.25%. Underwriting characteristics vary considerably, with credit scores ranging from 533 to 829, for example. While original LTV’s are generally high (8/13 greater than 90) home price appreciation over the last 8-10 years likely implies that borrowers have considerable equity. More of this to come as forbearance programs begin to run out later this year. Data released last evening showed that total delinquencies for loans in Fannie Mae pools were unchanged in February at 3.6% in February, the first month that the rate did not decline since the Covid-19 Pandemic struck last spring. Notably, the same rate for Freddie Mac pools declined by 0.2% to 2.9%, the low reached since April 2020.
|
Archives
July 2024
Tags
All
|
RECURSION |
|
Copyright © 2022 Recursion, Co. All rights reserved.




 RSS Feed
