|
In “FHFA’s Capital Rule is a Step Backward”, Jim Parrott, Bob Ryan, and Mark Zandi comment on the FHFA’s recently proposed capital rule for Fannie Mae and Freddie Mac, which requires the two entities to hold capital at least equal to a certain percentage of their total assets [1]. The authors conclude that this proposed framework would lead to higher mortgage rates, lower market share for the GSEs, higher GSE credit risk exposure, and a less stable housing finance system. The authors used Recursion data to demonstrate the impact of mortgage rate changes under the proposed capital framework on mortgage market shares. The paper is accessible through the link below: https://www.economy.com/getlocalq=298f7a13834466aa81c0b495a99f6bbc&app=eccafile Freddie Mac started to release forbearance data on its STACR CRT program in the July reporting cycle. Previously, the GSEs disclosed only pool-level delinquency and forbearance information [1]. As the loans in the STACR program have a UPB representing over 50% of total deliveries to FHL balances with no obvious state level bias, they would serve as a representative sample in calculating GSE state level delinquency [2]. Similarly, the new STACR data is helpful in assessing the impact of the COVID-19 crisis on forbearance at loan level. From the July STACR data release, we can see a clear correlation between total delinquency rates and forbearance rates at state level. States with higher delinquency rates, such as New York, New Jersey, Hawaii, and Nevada, also have higher forbearance rates. 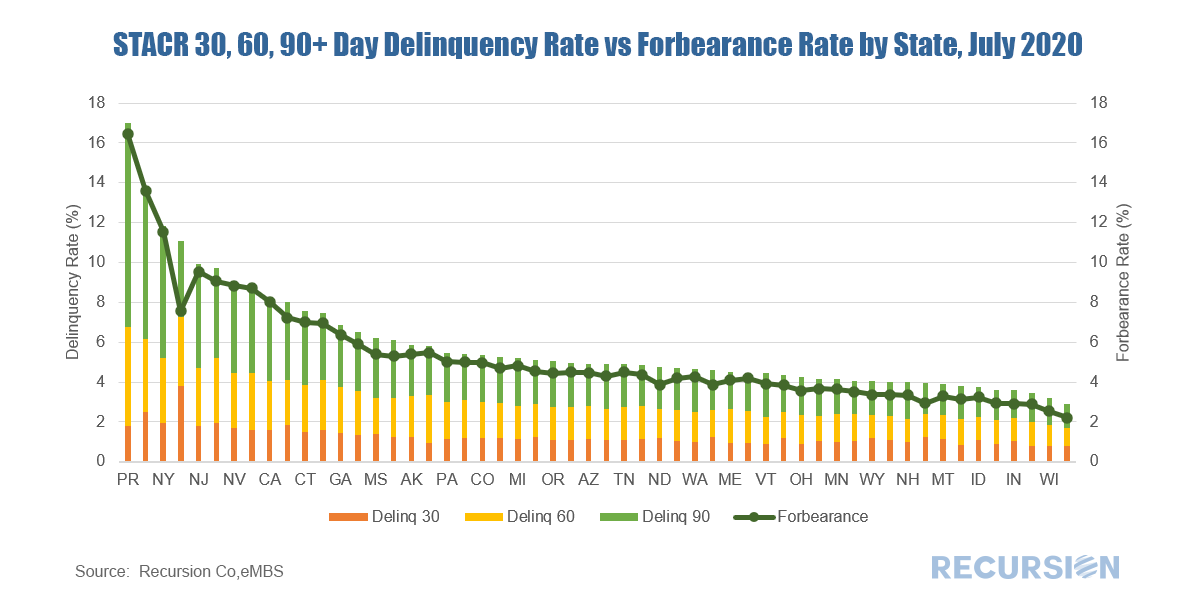 *The Chart can be duplicated using the above two queries This is not a surprise as we noted in an earlier post that Freddie Mac servicers are not required to report loans in forbearance if loans are current [3]. In fact, for STACR data, only 0.95% of current loans are in a forbearance plan, but the forbearance rate for loans in 30 day delinquency, 60 day delinquency, and 90+day delinquency are 30.64%, 92.98%, and 92.12 % respectively. 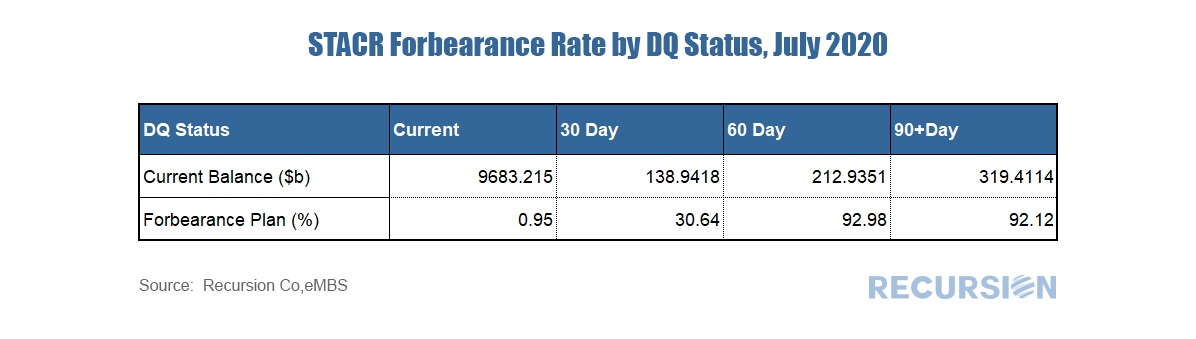 One of our major rules at Recursion is that we are a fintech data and analytics company and that we don’t give investment advice. So spoiler alert: the answer to the question is that anything is possible. But we noticed in the most recent weekly Freddie Mac survey that the 30-year mortgage rate edged up to 3.01% from a record-low 2.98% the prior week, the first sub-3.0% level ever recorded. Market lore says that at a certain level, rates give lenders sticker shock and mark a point below which they are reluctant to venture. In an early blog post we noted that mortgage rates were at record lows, but that Treasury yields were deeper into record-low territory, so mortgage spreads were actually quite wide[1]. Mortgage rates are set in the market reflecting offsetting pressures including: downward pressure from Federal Reserve purchases, upward pressure from record demand, and the costs of forbearance borne by servicers that they seek to recoup with higher margins on new business. Below is an update to the March chart with a new variable added: the inelegantly named OPUC: 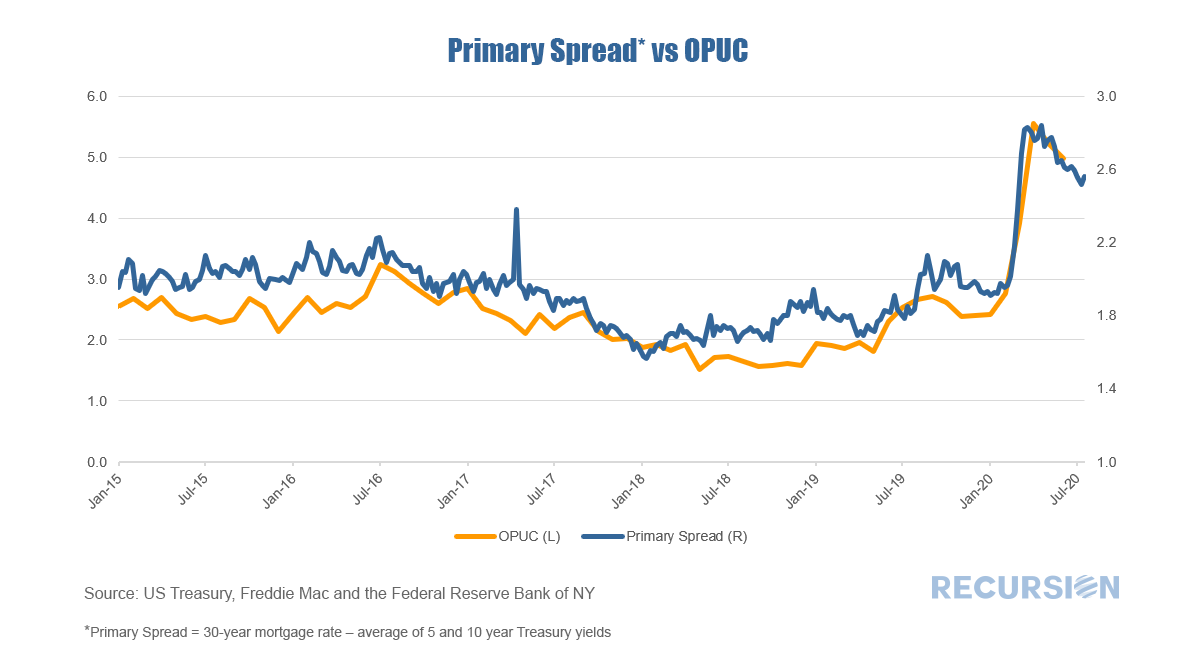 The long-raging and complex debate about housing finance policy basically boils down to two issues: first, how much risk should there be in the system, and second, who should bear it? Previous posts have addressed the use of big data in looking at the first issue by examining the trade-off between credit standards and delinquencies[1]. With regards to the distribution of risk, the topmost issue is the breakdown between the public and private sectors. This note approaches the second question by looking at the market shares of a government agency, FHA, vs that of the GSEs, which represent a mixture of public and private risk[2]. The competitiveness of one agency vs another is a multifaceted subject, as there are multiple aspects to their interaction. Among other approaches, they may compete via price (insurance fees) or via loan underwriting standards or product innovation. To launch this analysis, we just look at relative prices for purchase loans. As a proxy for price, we compare the weighted average coupon (WAC) between FHA and conforming loans in this category: 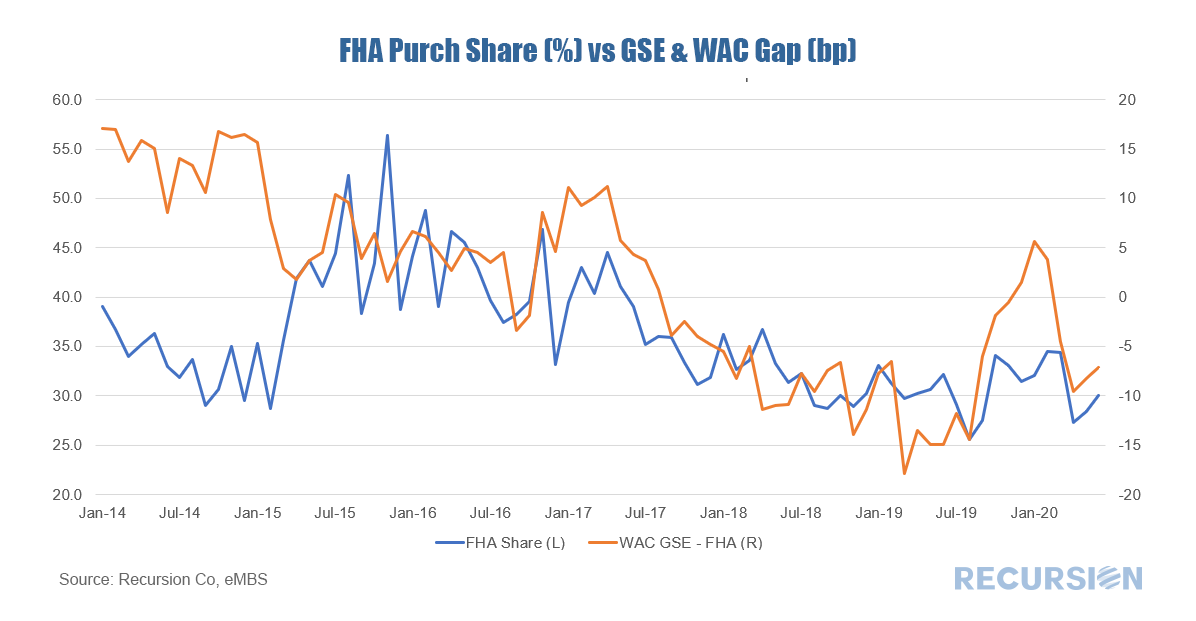 In a recent post[1], we pointed out an acceleration in the trend towards an increasing share of deliveries of purchase mortgages to the GSEs. This trend continued with the release of June data earlier this month, so a deeper dive is called for. First, the trend is far more evident for deliveries to Fannie Mae than Freddie Mac: 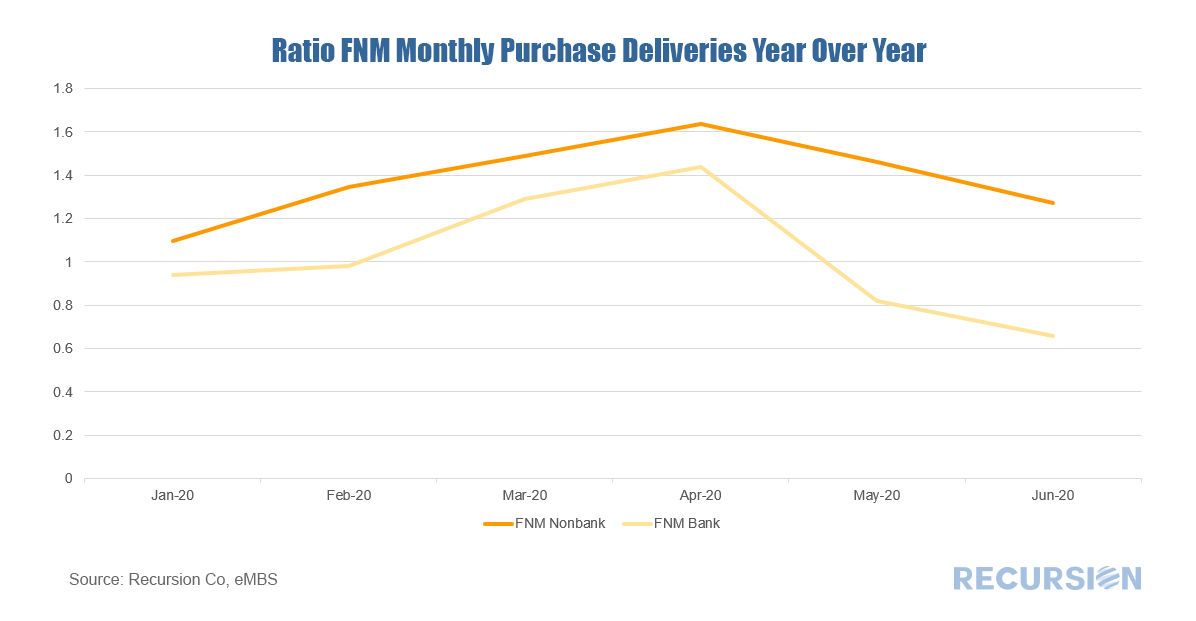 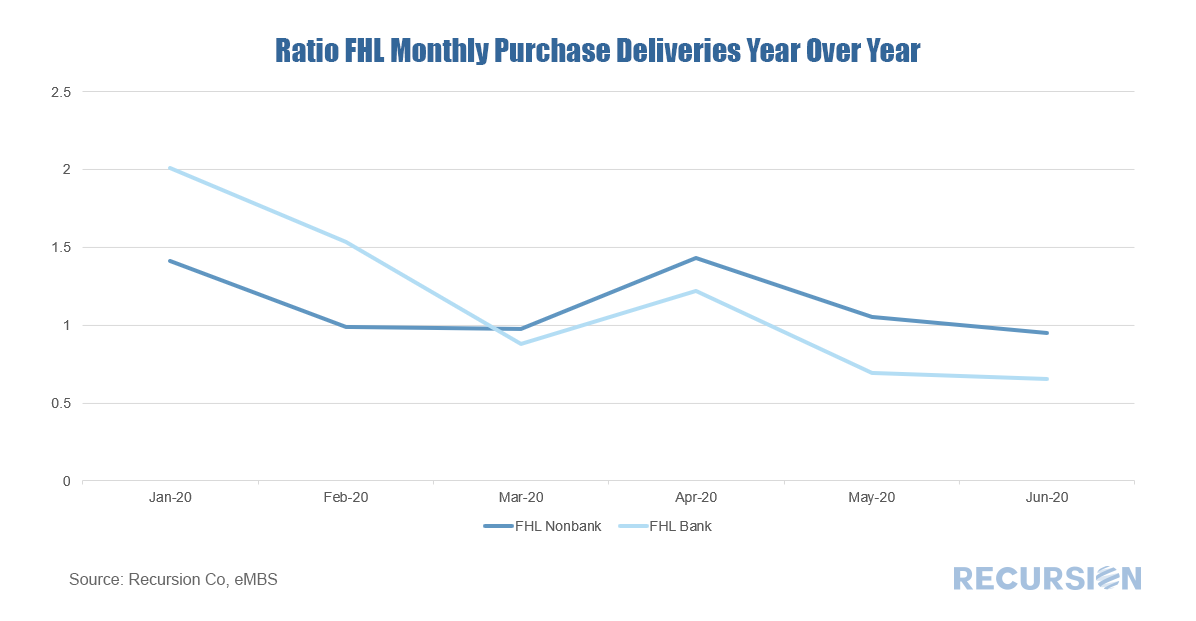 The drop in the 30-yr mortgage rate to close to 3.0% has worked to keep purchase mortgage securitizations relatively steady while refinancing activities have soared to record highs. Refis in Q2 2020 for the GSE’s came in at more than twice the next highest quarterly figure reported over the past seven years: 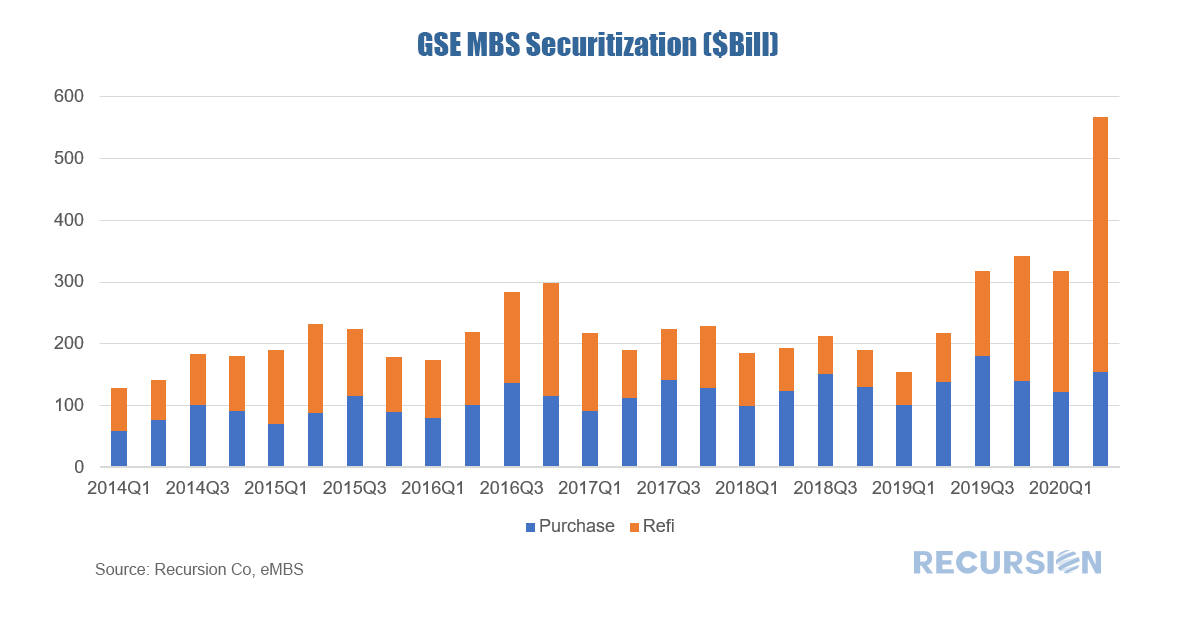 Besides the sharp drop in rates, another factor in this sudden surge compared to previous years is the increasing use of Property Appraisal Waivers. With the transaction costs of refinancing going down as a result, it appears that refis accelerated compared to prior episodes of falling rates. To look at this a bit deeper, below find 1-month prepayment speeds of both PIW loans and PIW eligible purchase loans for the two agencies[1]: 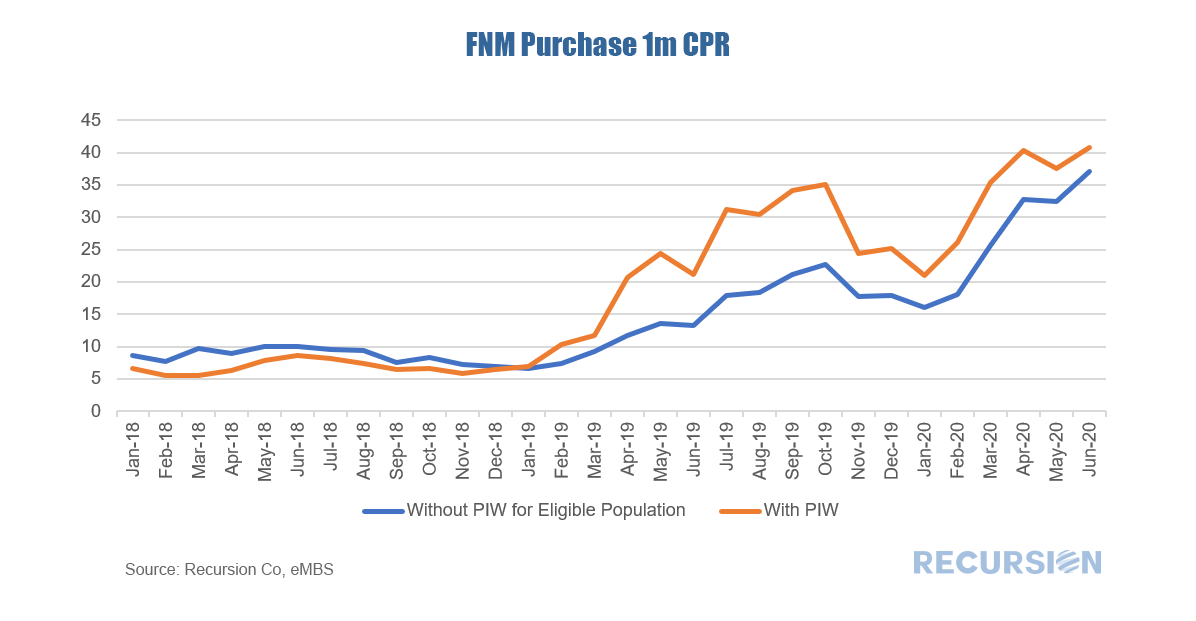 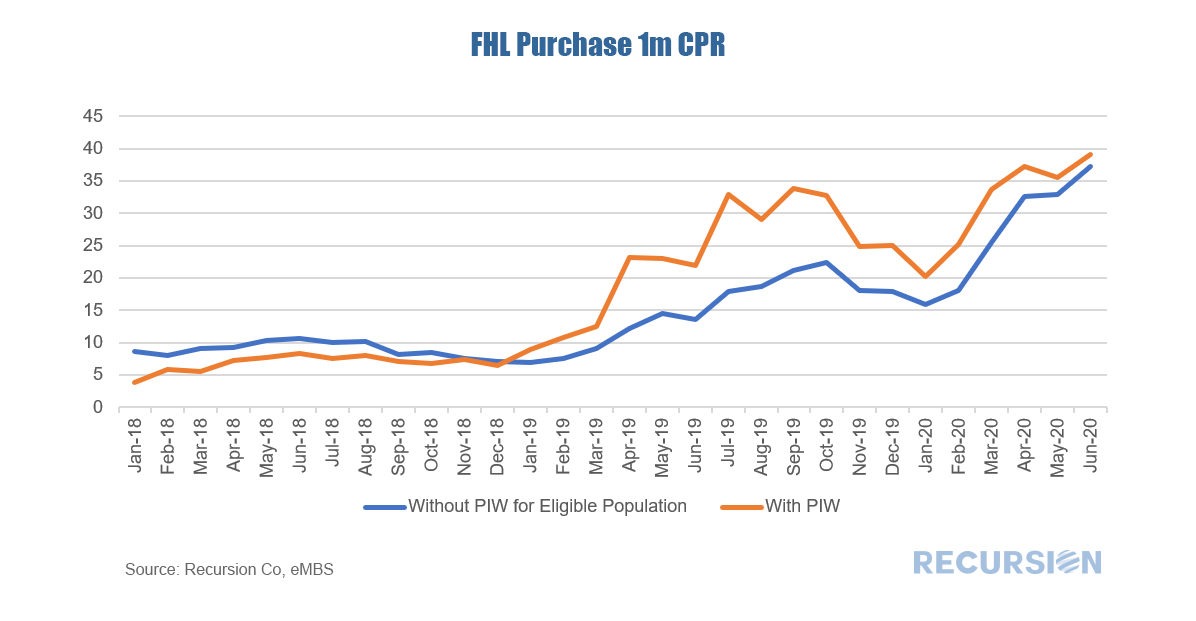 For both agencies, it appears that loans with appraisal waivers prepay faster than eligible loans without, but the impact diminishes over time in part because there are fewer such loans with a PIW left that haven’t prepaid. In fact, for non-cashout refis the impact is even more pronounced: 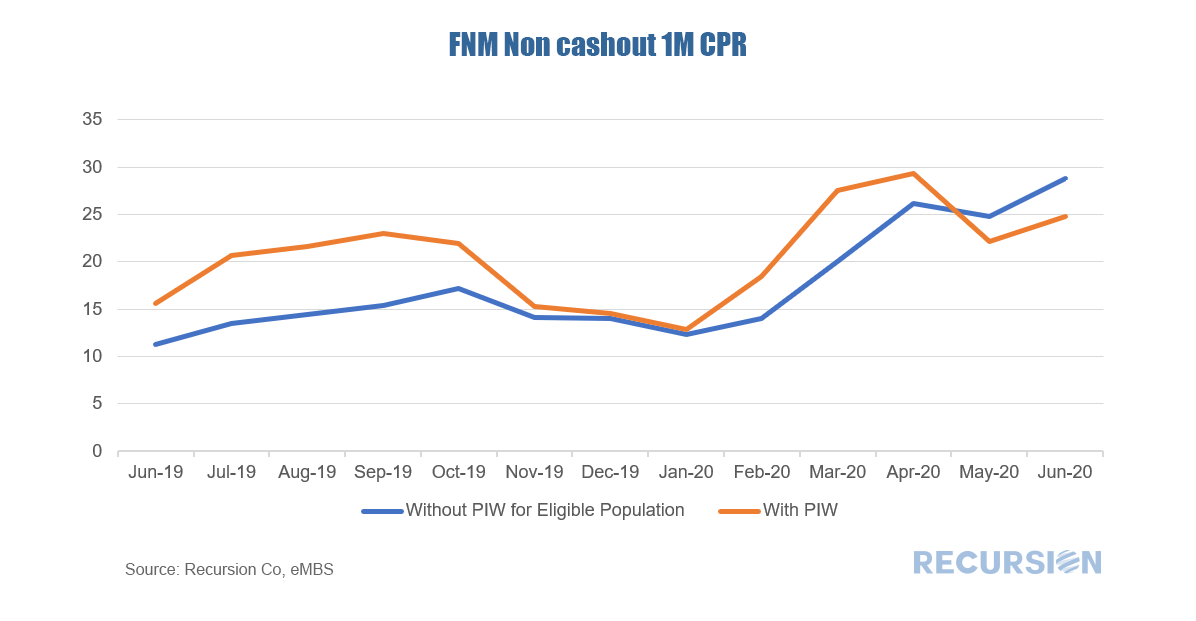 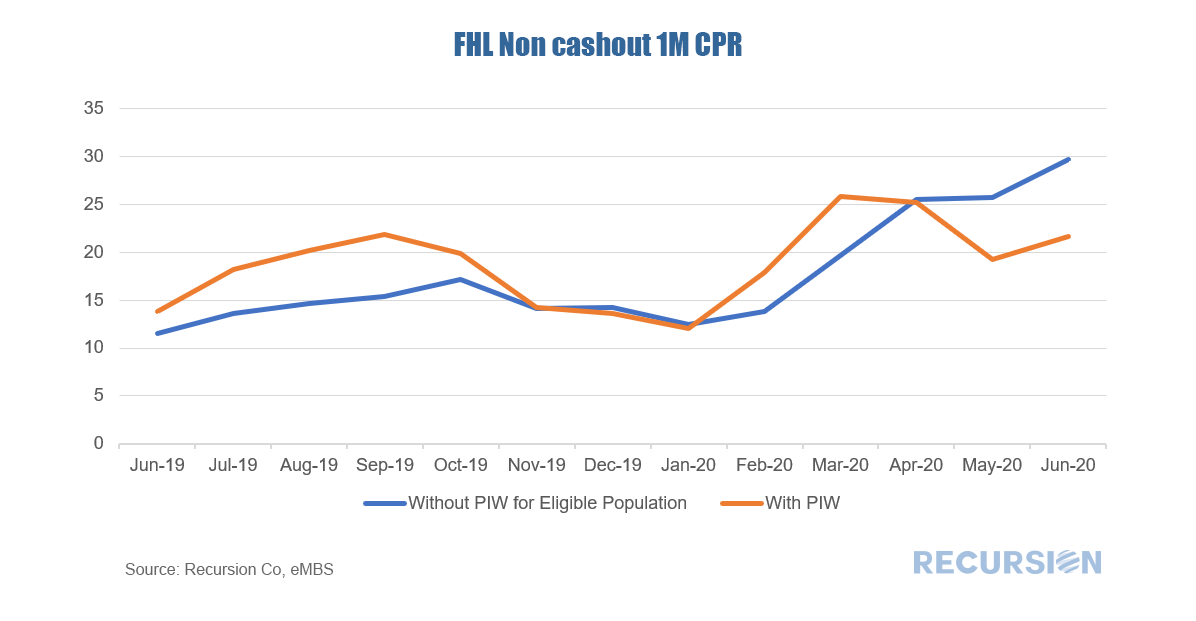 In this case not only have prepayment speeds for this category of loans with appraisal waivers slowed relative to others, but in the last couple of months they have actually become slower compared to other eligible loans. A combination of unprecedented policy moves and market developments have served to upend conventional mortgage market analysis, underscoring the need for new thinking, and new tools. [1] For a description of eligibility criteria see https://www.recursionco.com/blog/property-inspection-waiver-eligible-population
In a recent post[1] we noted that prepayment speeds jumped in June, led by a startling 12.4% rise in 1-month FHA speeds to 36.1, likely due to a change in pool rules that prohibited loan buyouts from being re-securitized beginning on July 1. This bears looking into. If this jump is due to such a policy change then one would expect that prepayment speeds would rise more for banks than thinly capitalized nonbanks. Indeed, this is the case, and remarkably so. 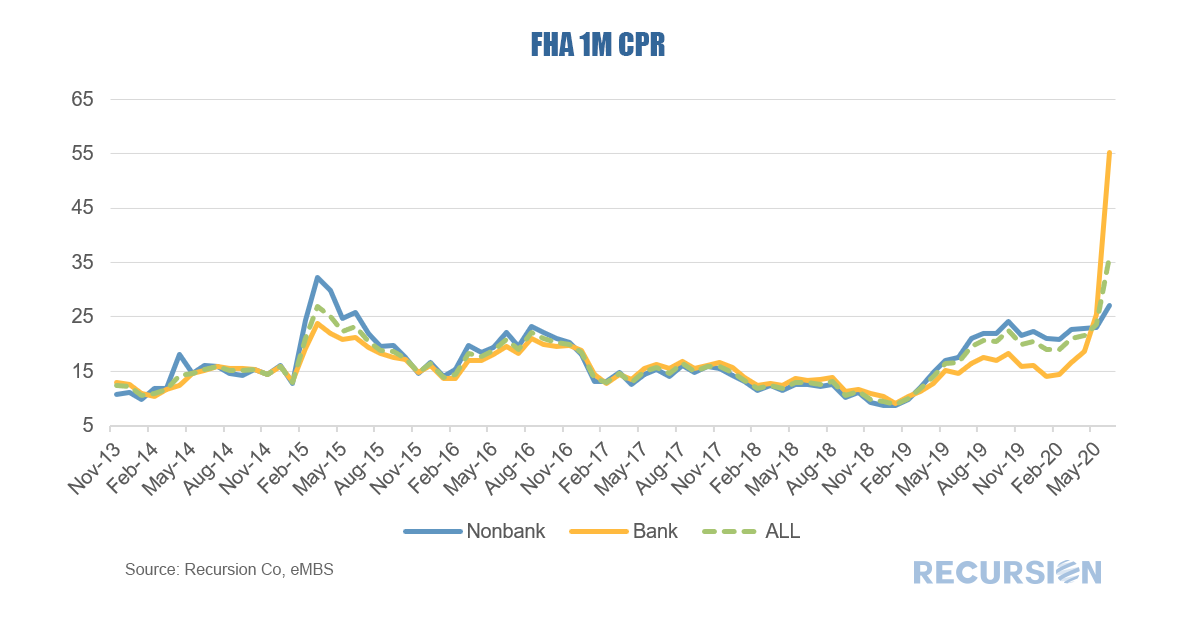 Two data releases Monday night paint a picture of hyper-kinetic refinancing activity and new deterioration in GSE credit performance. First, all three agencies released prepayment data for June showing record refinancings, led by Ginnie Mae programs which skyrocketed by over 10 CPR to 37! This is a much greater increase than experienced by both Fannie Mae (+3.4 to 30.9), and Freddie Mac (+3.2 to 32.0). A significant portion of GNM CPR’s increase could derive from elevated involuntary prepays (CDR), quite possibly driven by the very recent change made to GNM pooling rules regarding reperforming loans[1]. 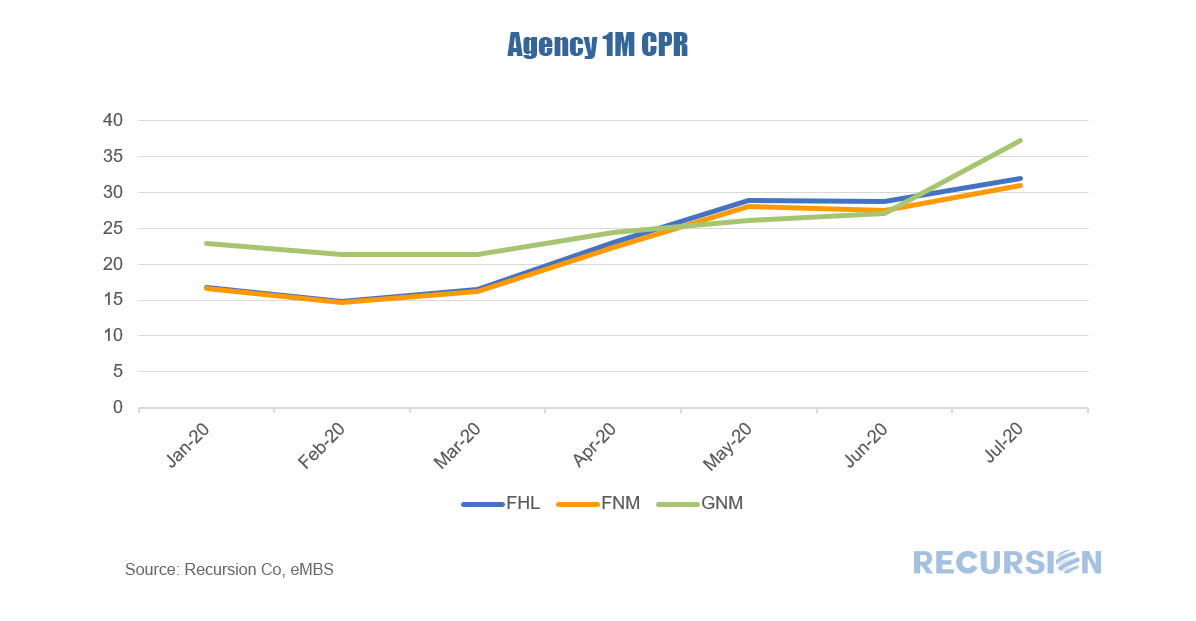 |
Archives
July 2024
Tags
All
|
 RSS Feed
RECURSION |
|

Copyright © 2022 Recursion, Co. All rights reserved.