|
Last August we reported that we had downloaded 2019 HMDA and detailed queries were accessible to our clients via HMDA Analyzer[1]. Recently, the CFPB provided a preliminary release of 2020 data, with information from smaller reporters coming a bit later in the year. Nevertheless, the new data is available on HMDA Analyzer and several insights can already be gained. 1. Total Origination loan count grew to its highest level since the runup to the Global Financial Crisis, driven by a surge in refinancings: 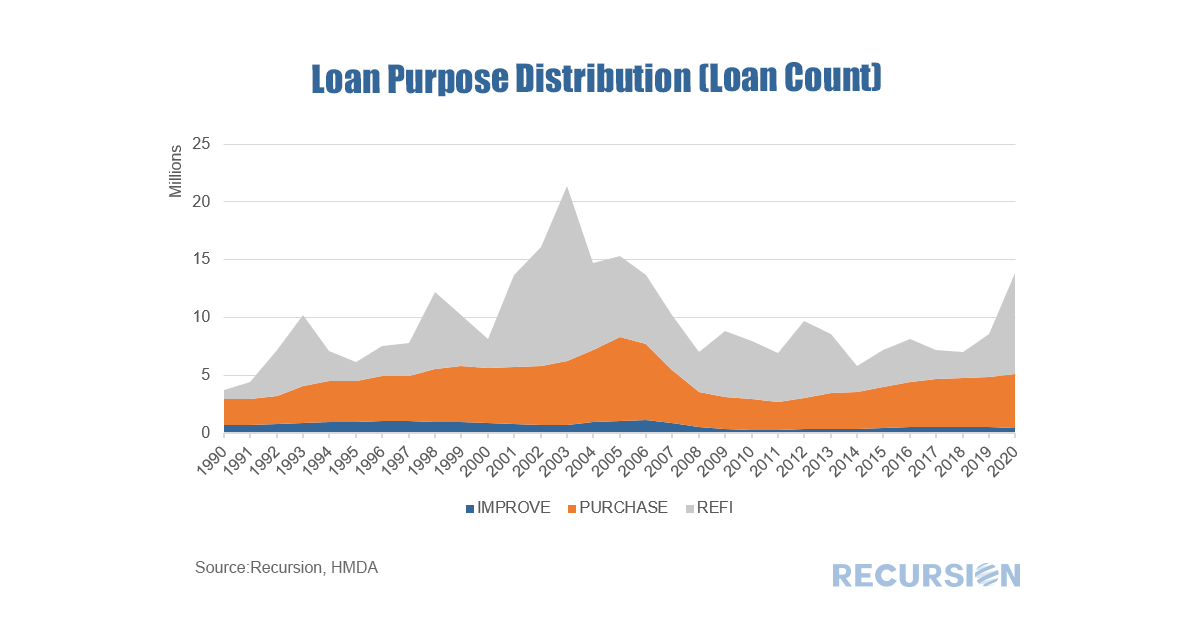 2. Nonbanks Rule – Covid 19 accelerated the long-term trend increase in nonbank lending share: 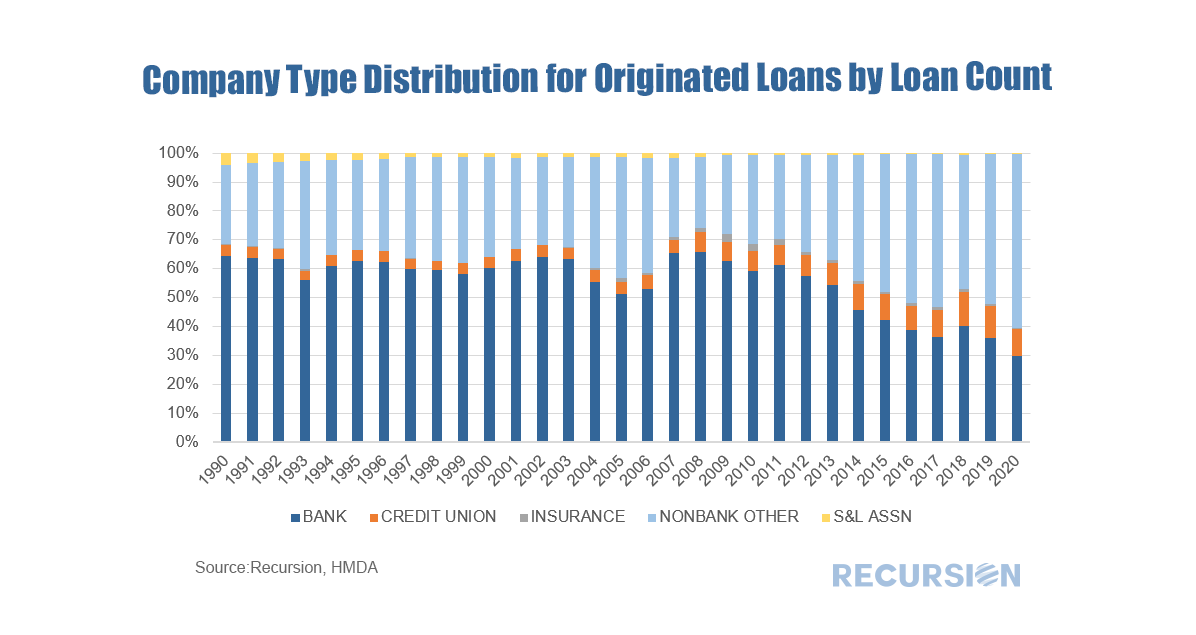 3. The held on book share collapsed, as banks preferred to hold mortgage risk in the form of MBS to avoid the potential for credit losses:  Much more can be found through with just a few clicks of the button. On January 19, the Federal Housing Finance Agency (FHFA) issued a Request for Information (RFI) on “Climate and Natural Disaster Risk Management at the Regulated Entities”[1]. This RFI was issued as “A growing body of research is studying the risks that climate change and natural disasters pose to the stability of the economy, the financial system, the national housing finance markets, and FHFA’s regulated entities.” There are two main policy topics in which FHFA is seeking comment: 1. Identifying and Assessing Climate and Natural Disaster Risk
Recursion joined with a consortium of experts in this field, including the Lincoln Institute of Land Policy, the Roosevelt Institute, the Carbon-Free Buildings Program and the Vulnerable Communities Initiative Inc that submitted a comment letter to FHFA Director Calabria on April 19[2]. This letter spelled out a statement of principles that reflect Recursion’s mission of building “Data Democracy”, including:
We are pleased to work with such distinguished colleagues on this important topic. The economic news in March got off on a strong note with the release of payroll employment data showing a hike of 916,000, a seven-month high. This coincided with the first anniversary of the onset of the Covid-19 Pandemic. The Cares Act forbearance program was launched at the end of March 2020 and was originally designed to last for one year. More recently, the program was extended for six months, but borrowers need to recertify their status as economically impacted by Covid every three months from the 1-year anniversary data[1]. So naturally the end of March was a time in which many borrowers had to recertify. This was a natural time for households to reassess their financial positions, setting the stage for the possibility that they could begin repaying their mortgage obligations. In fact, they did, and we saw a sizable drop in the number of loans in Covid-related forbearance[2] in April, particularly for Ginnie Mae programs: 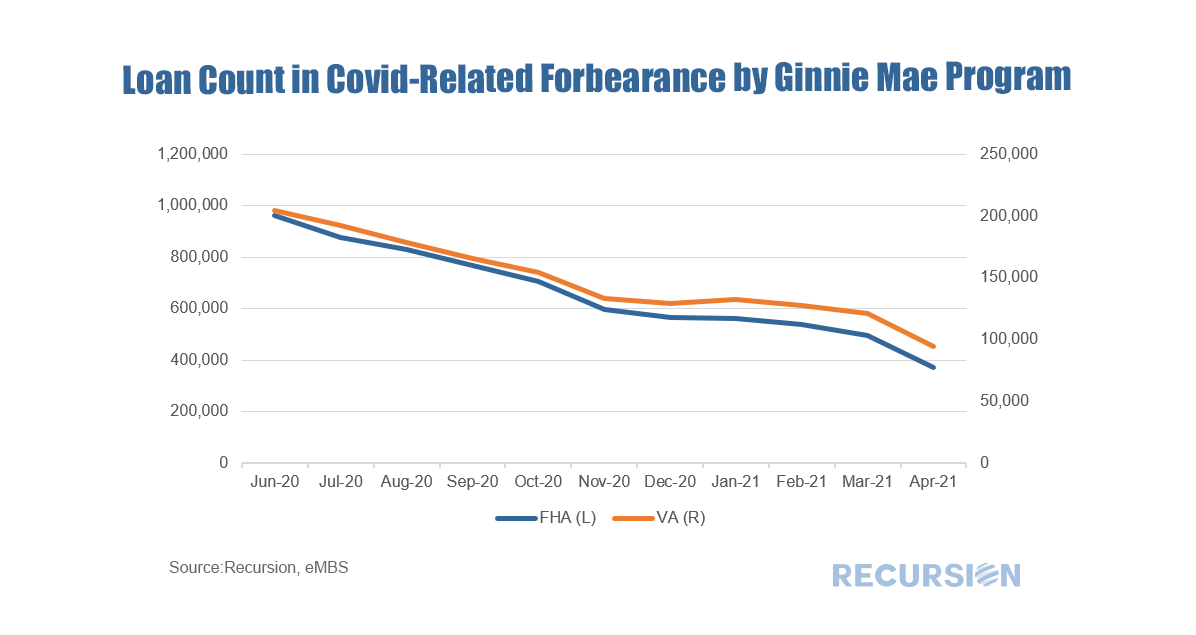 The economic fundamental driving this decline is the improvement in the labor market, and a distinct correlation can be seen between declining forbearances and unemployment: 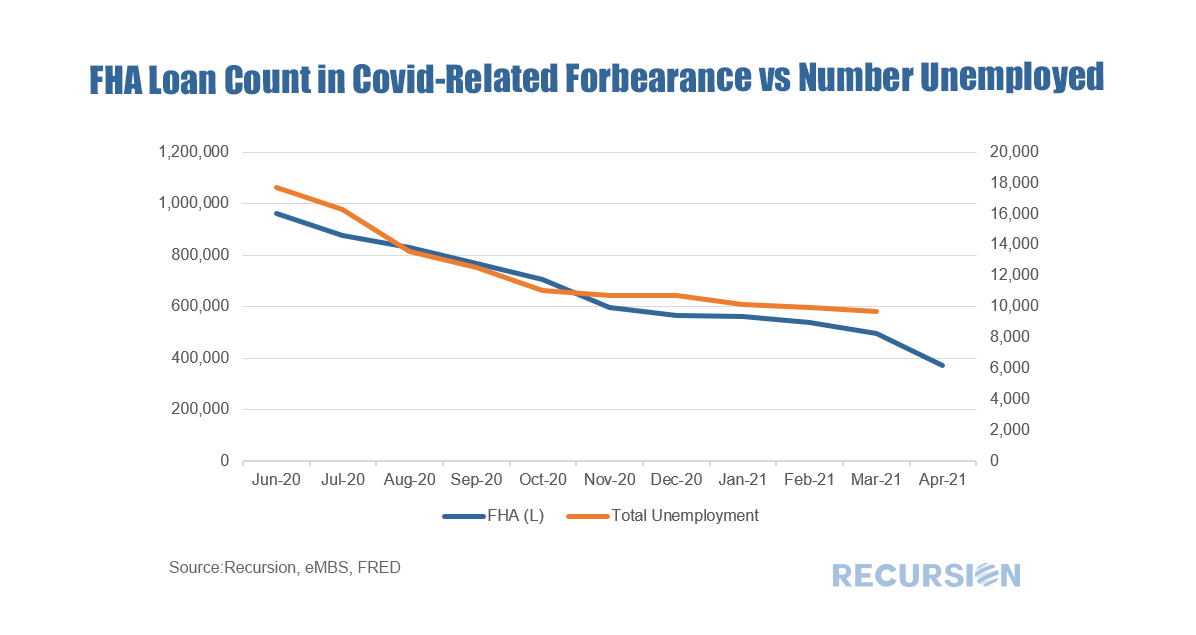 A bit more analysis is in order here. The forbearance data come from loans in agency pools, so there is always the possibility that the number of loans in forbearance decreases because some of those loans were bought out of pools by servicers. To check this, we looked at the disposition of loans in forbearance at the beginning of March that remained in pools at the beginning of April but were not in forbearance. For FHA programs the number was 111,153 loans compared to the one-month decline in the number of loans in forbearance of 125,202. For VA the similar statistic is 27,247 compared with a 26,810 decline in the number of loans in forbearance. It seems clear that improving labor market fundamentals are the primary driver of the decline in the number of loans in forbearance in these programs. To test the idea that the 12-month renewal period played an important role in this process, below we look at the loan age of those mortgages that left forbearance but stayed in pools in April. For FHA programs, the number with loan age of one month was 79,212 or 71% of the total, while for VA it was 17,863 or 66%. The next important date will be June before the program is scheduled to end at the end of September. 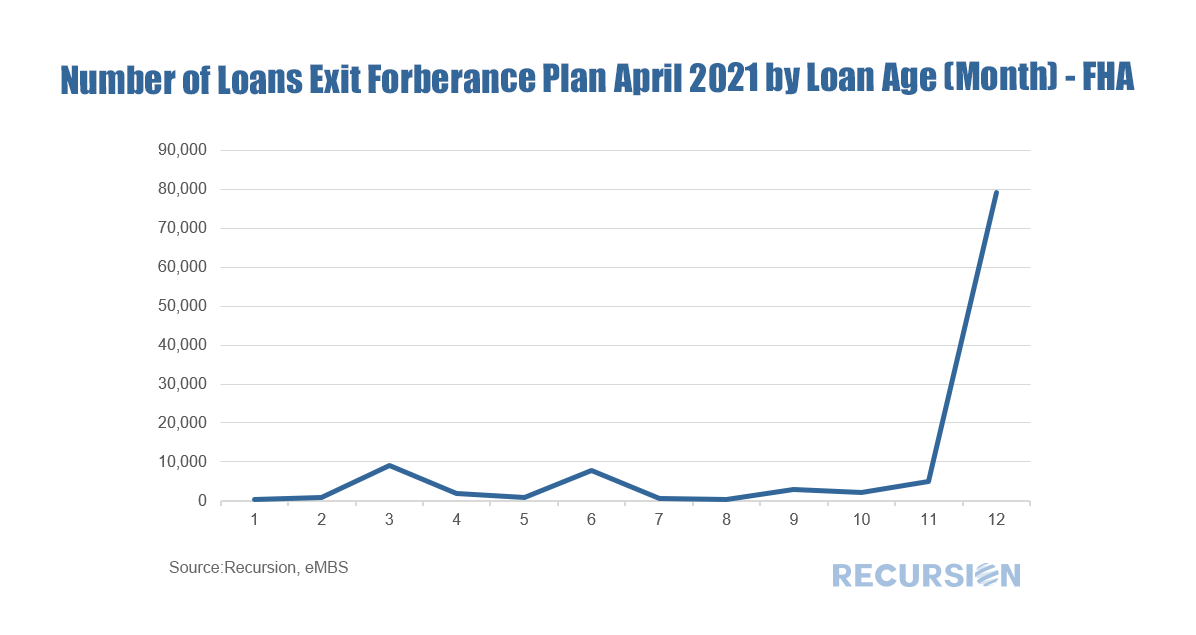 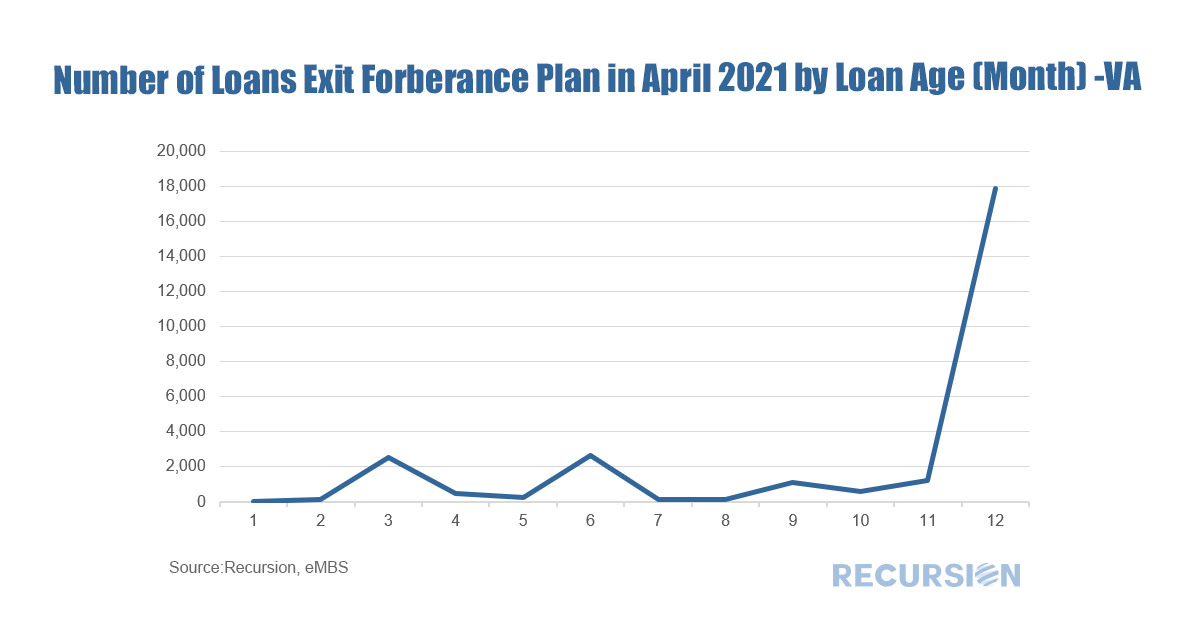 As can be seen from the above table, the vast majority of the number of loans that were recorded as in forbearance in March but not in April did not exit due to buyouts. The data do not precisely add up because other outcomes are possible, including FHA – conventional refis or sales of homes, for which we have no tracking mechanism. But the close match between cures and the declines in forbearance across programs is evidence that the main impetus is improving fundamentals. [1] https://www.consumerfinance.gov/coronavirus/mortgage-and-housing-assistance/help-for-homeowners/extend-forbearance/
[2] In this blog, we only analyze Covid-related forbearance The increase in the number of cashout refis has led to some concerns about the implications for the quality of household balance sheets, similar to what occurred in the run-up to the Global Financial Crisis[1]. At that time, many homeowners were tempted to use their houses as a “piggy bank” as the national savings rate hit all-time lows. In the runup to the Global Financial Crisis, the national savings rate hit a sixty-year low of 2.2% while over the 2016-2019 period the rate averaged a much healthier 7.6%[2]. It is useful to scale the magnitude of assets being cashed out and Freddie Mac releases a very useful file documenting this quarterly for their book of business back to 1994[3]. In the fourth quarter of 2020, the amount cashed out reached $48.4 billion, about 58% of the $84.0 billion peak attained in the second quarter of 2006. As a share of household net worth, the most recent data point is 3.7%, well below the peak of 12.7% reached in Q2 2006. 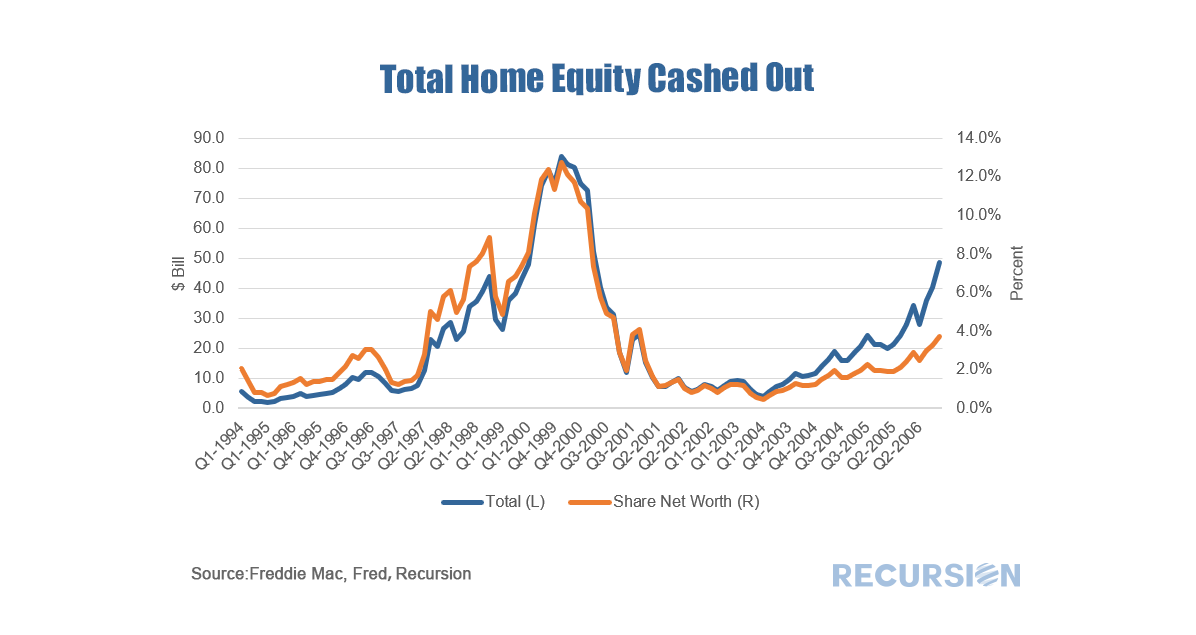 It’s useful along these lines to ask about the credit profile of cashouts compared to other refinancings. Freddie Mac didn’t report cashout refi separately until 2008 Q3, but the following useful picture can be obtained. 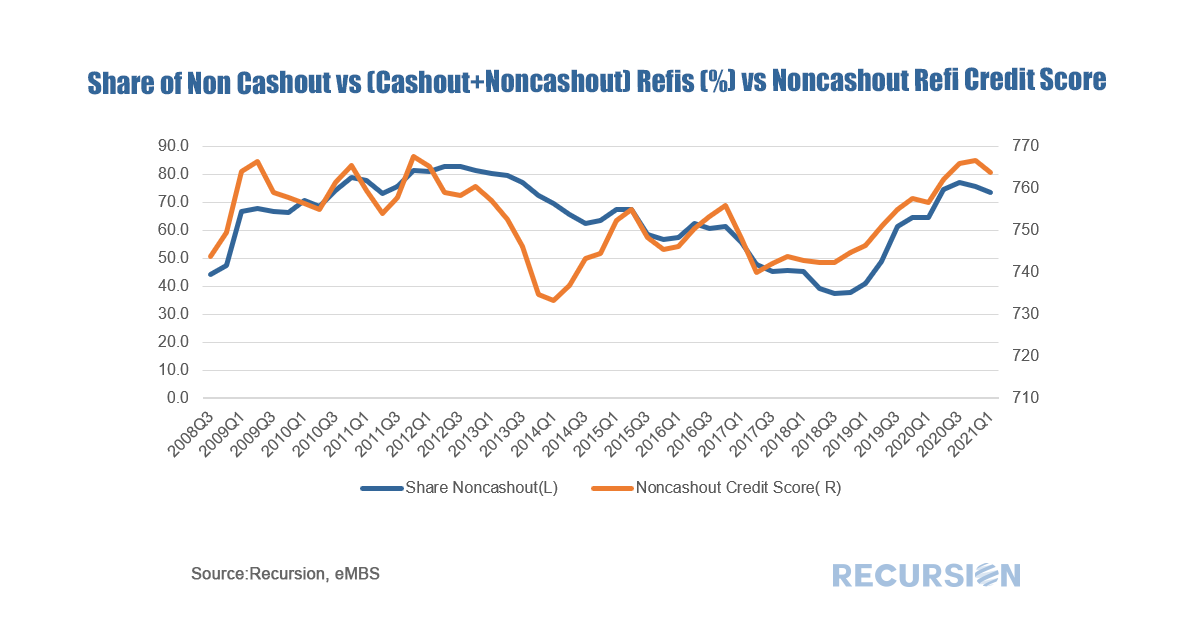 In general, lenders tend to “lean against the wind” by loosening credit conditions when demand for credit declines, and vice versa. Interestingly, it appears that the share of noncashout loans follows a pattern in which the share rises when credit in general is tightened. At the present time, the average FICO score in March for noncashouts was a tight 764, vs 753 for cashouts. It is difficult to pin the rise in equity cashouts in the current cycle to loosening credit conditions. Of course, the proof is in performance, and now that we have loan-level DQs for the GSE’s beginning last month, we can look at this broken down by loan purpose for the Freddie Mac book: 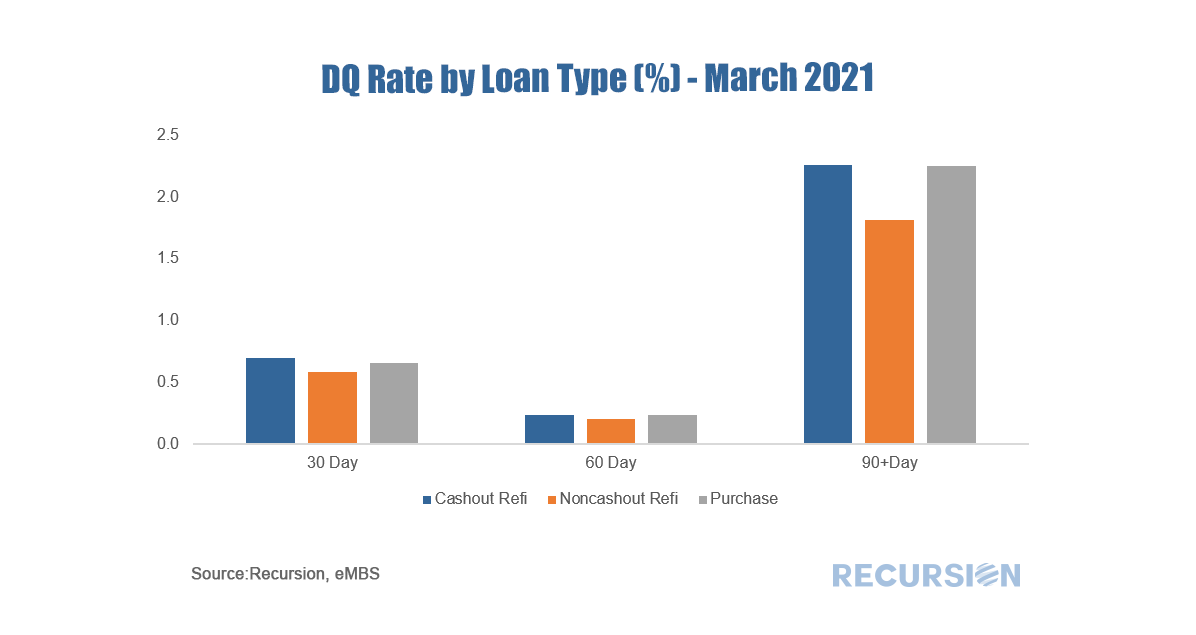 The performance of cashouts is mildly worse than that for noncashouts, but more in line with purchase mortgages. These statistics will bear watching in future months, particularly as forbearance programs begin to expire towards the end of the year. 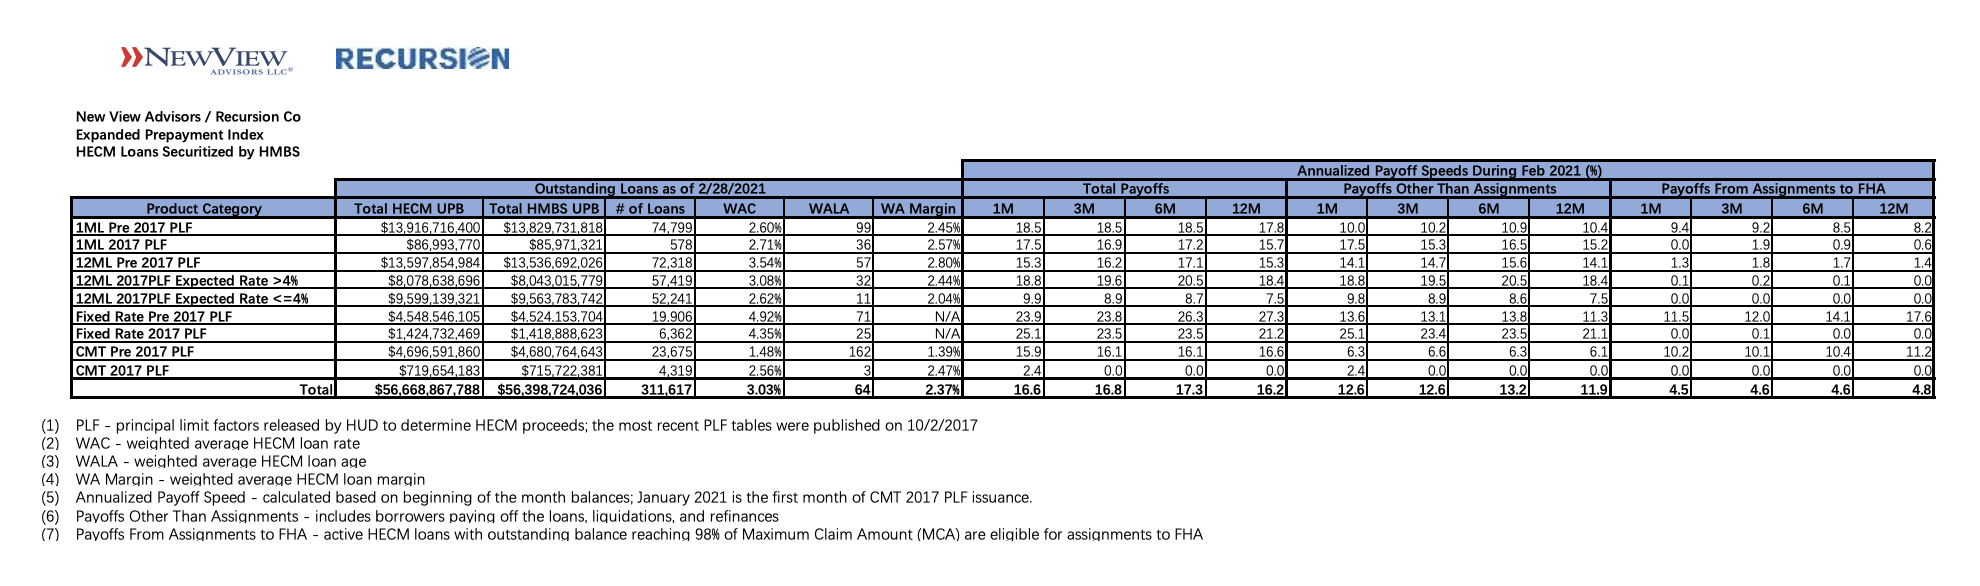 Recursion and New View Advisors February 2021 expanded HECM reverse mortgage prepayment indices can be found here: New View Advisors Recursion Cohort Speeds 02_2021. The indices are derived from underlying HECM data in HMBS made public by Ginnie Mae, as well as private sources. This new expanded set of prepayment data is calculated using dollar principal balance, not unit count.
The enhanced data set shows current trends in prepayment activity by product type and Principal Limit Factors (PLFs), and for current 12-month LIBOR PLFs by Expected Rate. HECM loans with higher Expected Rates originated in the year or so prior to the precipitous fall in interest rates brought on by the pandemic are experiencing higher prepayment rates. Therefore, we segregate indices for recent production 12-month LIBOR PLFs into Expected Rates greater than 4% and Expected Rates less than or equal to 4%. Prepayment speeds are expressed as annualized percentages in three categories: Total Payoffs, Payoffs Other Than Assignments, and Payoffs from Assignment. For each category, we calculate the 1-month, 3-month, 6-month and 12-month CPR, or annual rate of prepayment. For HMBS pools backed by adjustable rate HECMs using the Constant Maturity Treasury (CMT) index, prepayment speeds will begin to populate as more of these HMBS are issued. Just under $300 million of CMT HMBS are currently outstanding: other than some highly seasoned tail pools, none have been outstanding more than one month. Please contact us if you’re interested in customized stratification of HECM prepayment speeds by vintage, Expected Rate, Weighted Average Loan Age, or other tailored output. |
Archives
July 2024
Tags
All
|
 RSS Feed
RECURSION |
|

Copyright © 2022 Recursion, Co. All rights reserved.