|
In Mortgage Winter, affordability is job one for housing policy. In our most recent quarterly macro report, we noted that the share of loans with buydowns posted significant increases across all three agencies in the second half of 2023[1]. To see how widespread these sorts of supportive actions are, we look at down payment assistance (DPA) programs. To start, the GSEs only allow downpayment assistance through specified second lien programs: “Community Seconds” for Fannie Mae[2] and “Affordable Seconds” for Freddie Mac[3]. While there are technical differences between programs, they are second liens funded by an approved list of government agencies, nonprofits, and private sector lenders. The liens are subordinate to the first mortgage and face various limits on combined LTV (CLTV) and note rates. These liens are neither securitized by the Enterprises nor directly reported in the data disclosures. However, we could identify those (we call it “piggyback”) by looking for loans with the original combined LTV higher than its original LTV. Below find the number of owner-occupied loans containing “piggyback” liens for the HFA programs, the low-income programs (FNM “Home Ready” and FHL “Home Possible”), and other[4]: 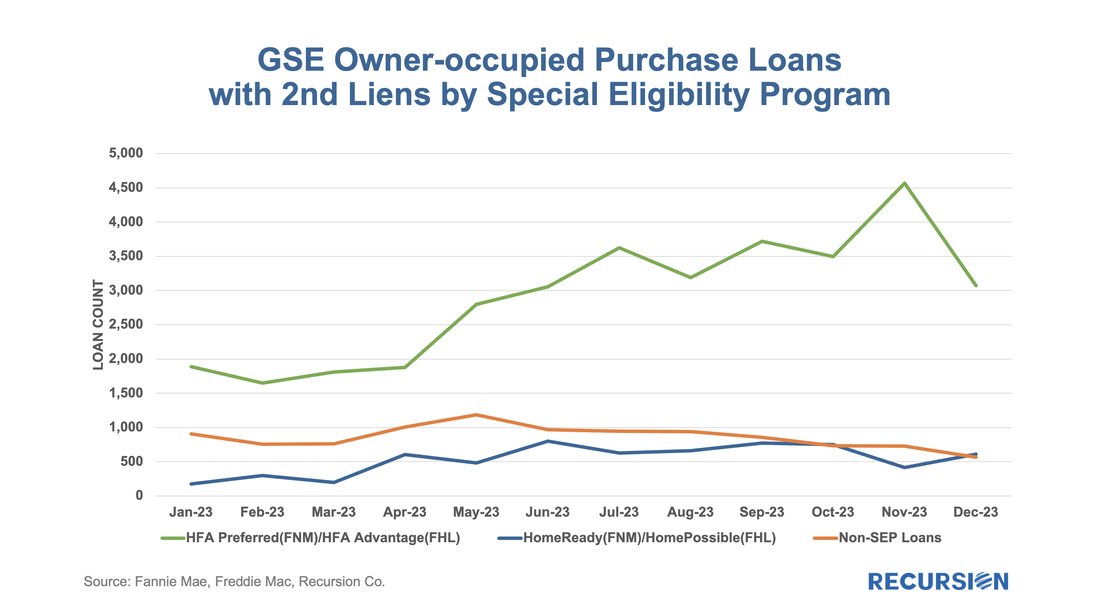 On February 9, Ginnie Mae announced a new Low-Moderate Income Borrower (LMBI) disclosure[1] “in response to investor interest in having greater transparency into Ginnie Mae mortgages in pools, in particular as part of meeting Environmental, Social, and Governance (ESG) investment mandates”.
“The new disclosures capture the number of underlying loans made to LMI borrowers, the percentage of LMI loan count of total loan count, the unpaid principal balance (UPB) of LMI loans in the mortgage-backed security (MBS), and the percentage of LMI UPB of total MBS UPB.” “LMI households are classified according to the Federal Financial Institutions Examination Council (FFIEC) Median Family Income Report Tables[2] corresponding with the time of loan origination. These disclosures are being provided at the aggregate pool level for Federal Housing Administration (FHA) and U.S. Department of Veterans Affairs (VA) loans originated beginning in 2012.” In other words, grist for the Recursion mill. First, we look at the share of Ginnie vintage 2012 and later pools that consist of loans for which more than 50% are LMBI borrowers: In early May, Fannie Mae announced that its disclosures for its multifamily DUS program to include expanded social information, notably Area Median Income (AMI), went live[1]. With the June release, we now have data for two months, a summary of which is found below: To begin, we look at the big picture of new loans issued within the DUS program for May and June combined. (All data will be presented this way unless otherwise specified.) 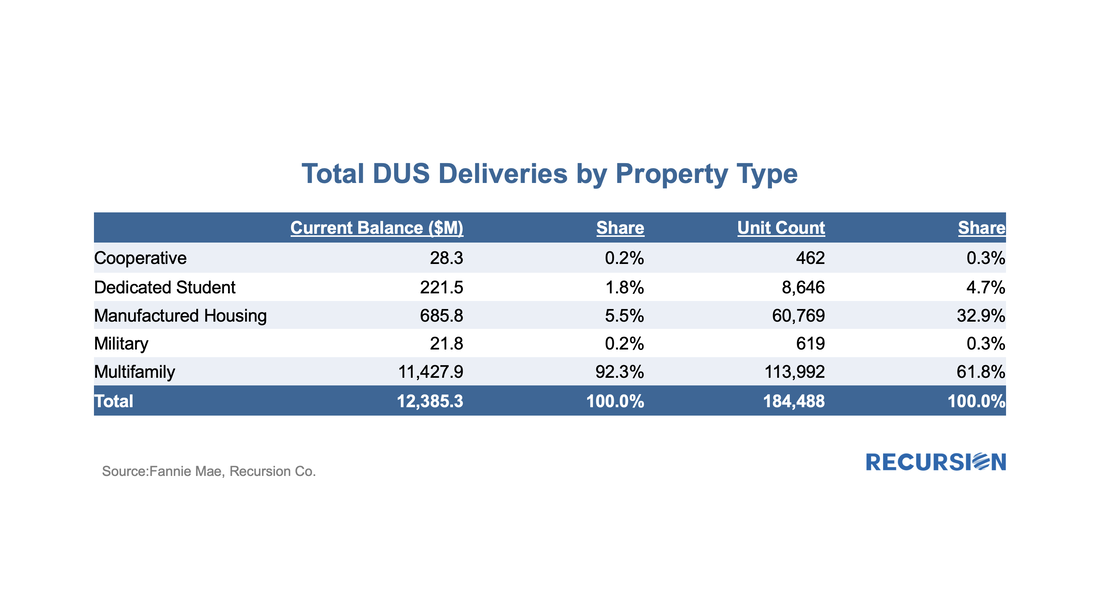 On May 25, 2022, Ginnie Mae announced that starting on June 8 it would enhance its pool and loan-level multifamily disclosures through the addition of an Affordable Status Field[1]. This field marks every FHA loan in pools with a Ginnie Mae guarantee as:
We received this data on the 6th business evening, and below find some summary descriptions: 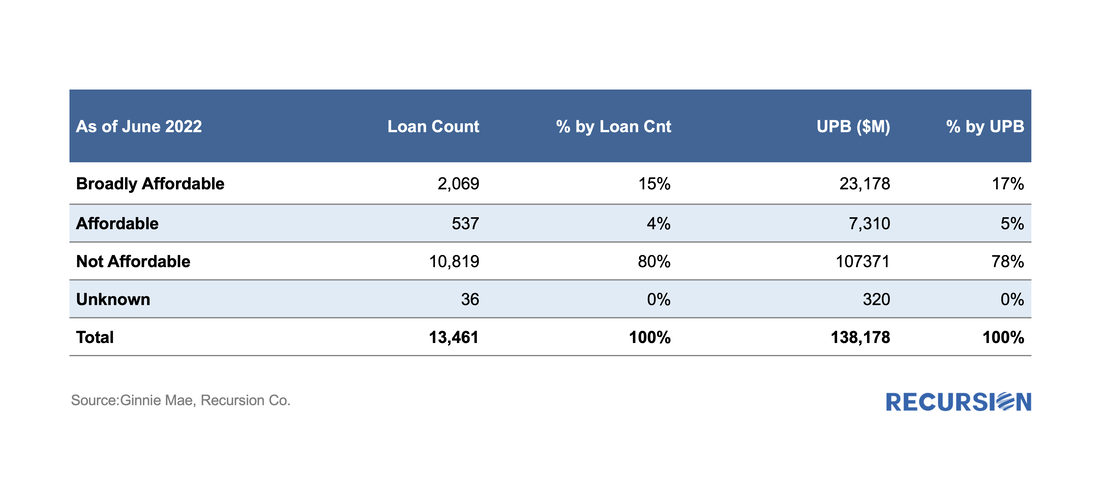 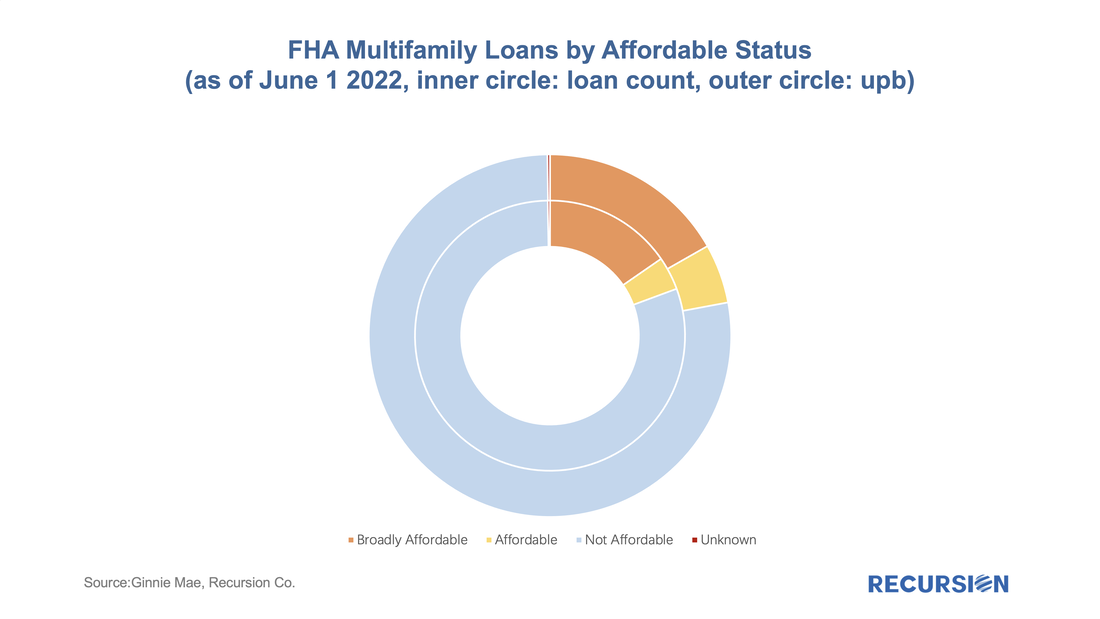 Back in 2021, we wrote a comment on the properties of the GSE Special Eligibility Programs designed to provide lower income households with access to mortgages (HomeReady for Fannie Mae and Home Possible for Freddie Mac)[1]. Given the increasing policy focus on the provision of credit to these households[2], it is appropriate for investors to look at the investment opportunities in this area. In this note, we look at the performance of HomeReady/Home Possible Program loans (referred as Low-Income Program in the following) vs. non-special-eligibility program loans, as measured by one month CPR, controlling coupon and vintage. We focus on just two such cohorts, 1.5% and 2.0% coupon pools of 2021 vintage. By loan count, the share of Low-Income Program loans in these pools by agency for May 2022 is: 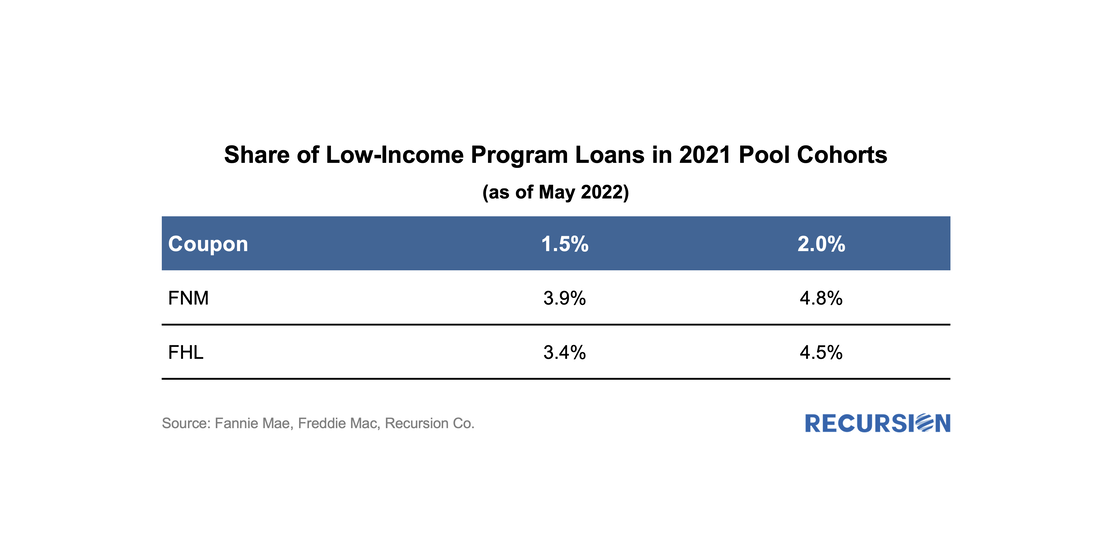 As we have noted many times, one of the best features of loan-level analysis is the ability to segment the mortgage market into components that allow for a deepening of understanding of the behavior of the various market players. In this note we look at two groups: borrowers who get an appraisal and those who are eligible to get one but do not. In previous posts we pointed out that analysis of the performance characteristics of mortgages with and without appraisal waivers cannot be accomplished by looking at loans with waives vs those without as many loans without waives are ineligible to obtain them. A robust analysis can only be conducted by looking at loans with waivers against loans that are qualified to get one. The qualification characteristics can be complex, but the main factor is LTV, which differs by loan purpose.[1] The question that naturally arises is why do some eligible borrowers not obtain a waiver when doing so would save money on the transaction? To address this issue, we look at the distribution of loan sizes for purchase loans with waivers vs those without them that are eligible. Here is the pattern of loans delivered to the GSEs YTD October 2021 by Agency: 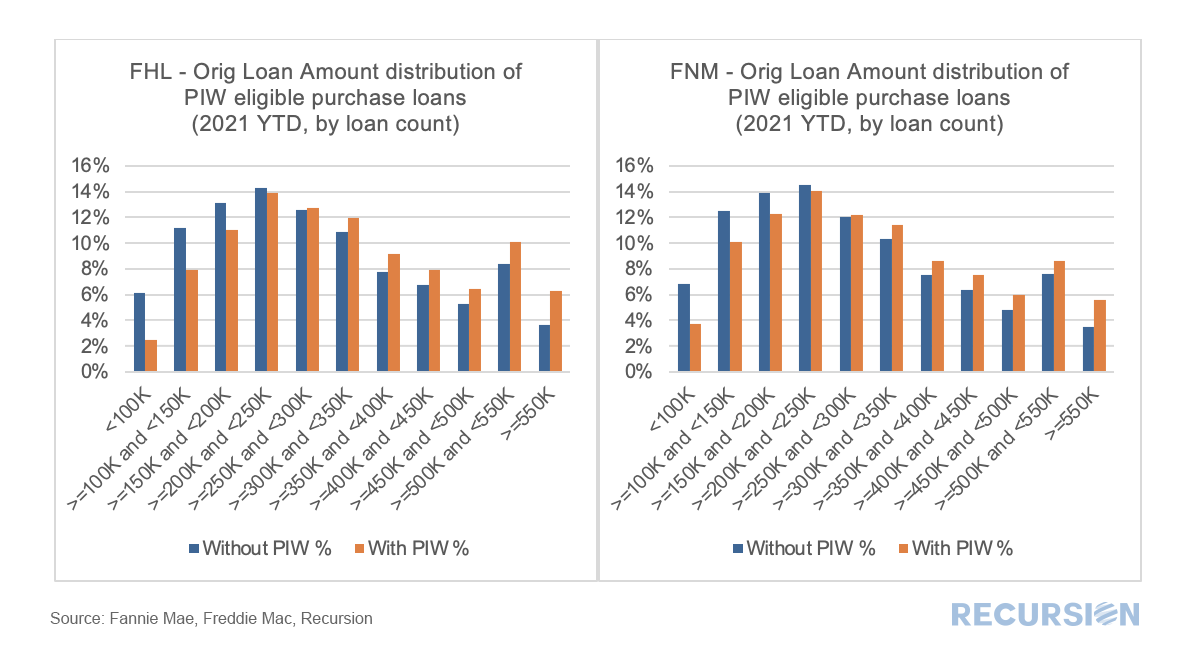 Recently, the GSE’s Fannie Mae and Freddie Mac released loan-level data associated with their “Special Eligibility Programs” that look to extend credit to low-income borrowers. As housing policy is increasingly focused on providing this market segment access to this market segment, this data will prove useful to housing analysts looking to assess the effectiveness of these programs as well as to traders looking to understand the impact on the performance of MBS containing these loans. Briefly, each agency has three programs. There are many differences in details between the programs.
As the refi programs are relatively new and volumes are small, in this post we focus on the first two. For convenience, we refer to the first as the “Low-Income Programs” and the second the “HFA Programs”. Below find the market share of Home Ready and Home Possible out of total volumes for their respective Agencies by loan count: 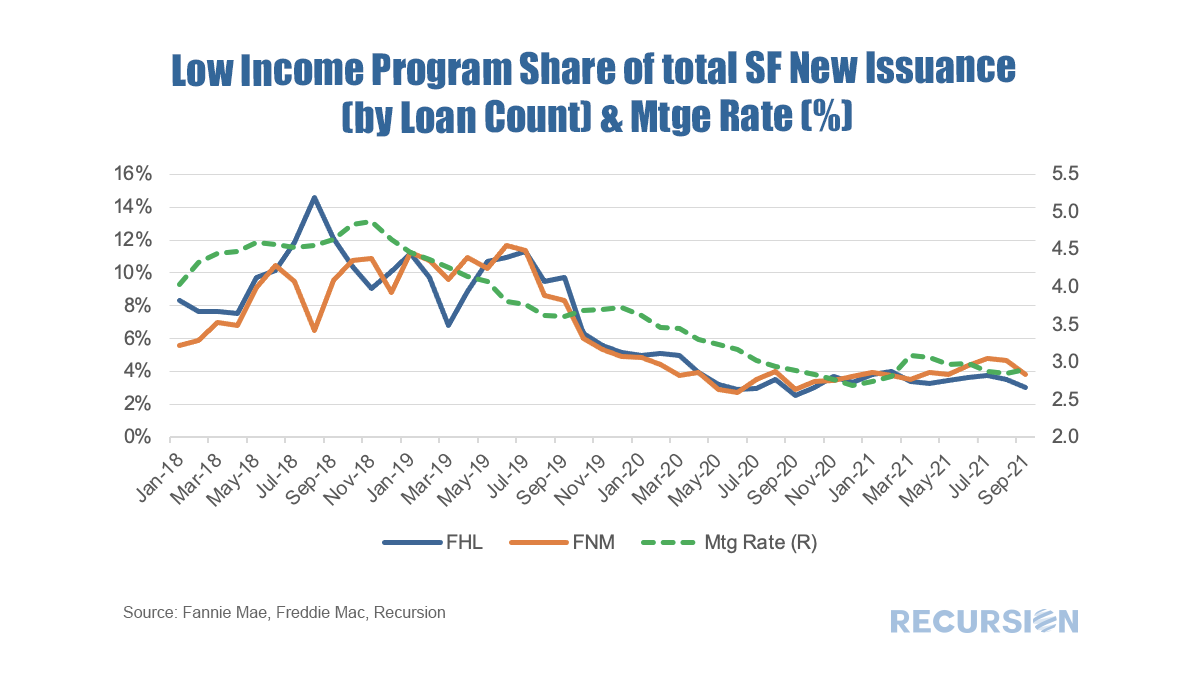 The recent unprecedented surge in home prices to a record 18% jump on a year-year basis as measured by the FHFA purchase-only index brings affordability front and center to the current housing policy debates. In May 2021, indexed home prices stood 15.5% above indexed aggregate earned income, a bit less than half of the peak house price overvaluation of 29.0% reached in December 2005, just before the onset of the Global Financial Crisis. 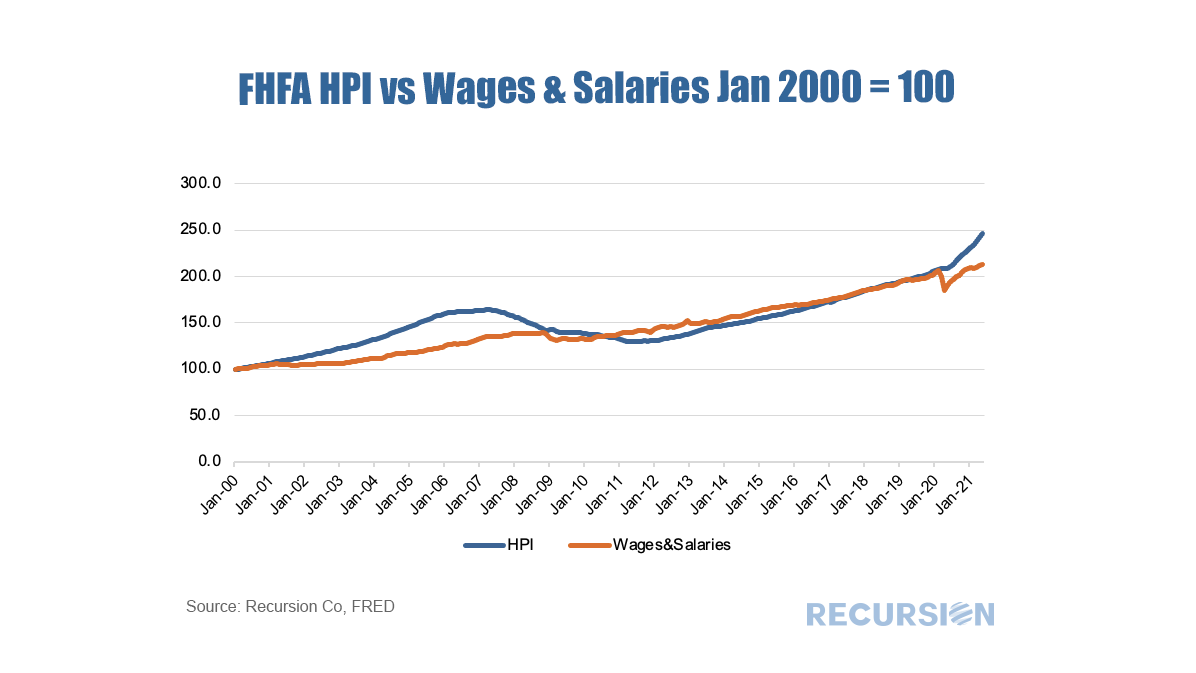 The topic of affordability is very broad, and will be the subject of much further commentary, but in this post we look briefly at this topic through the distribution of the purchase mortgage market across securitization agencies, notably FHA and the GSE’s. Looking at the distribution between the GSEs and FHA is informative in this issue because the FHA program is aimed at low-income borrowers. According to 2020 HMDA data, the weighted average household income for FHA borrowers of purchase mortgages was $85K while for those in conforming mortgages the figure was $228K. Since the onset of the Covid-19 pandemic in early 2020, the share of FHA purchase mortgages of the total[1] delivered to agency pools as been in general decline, on both a loan count and outstanding balance basis: 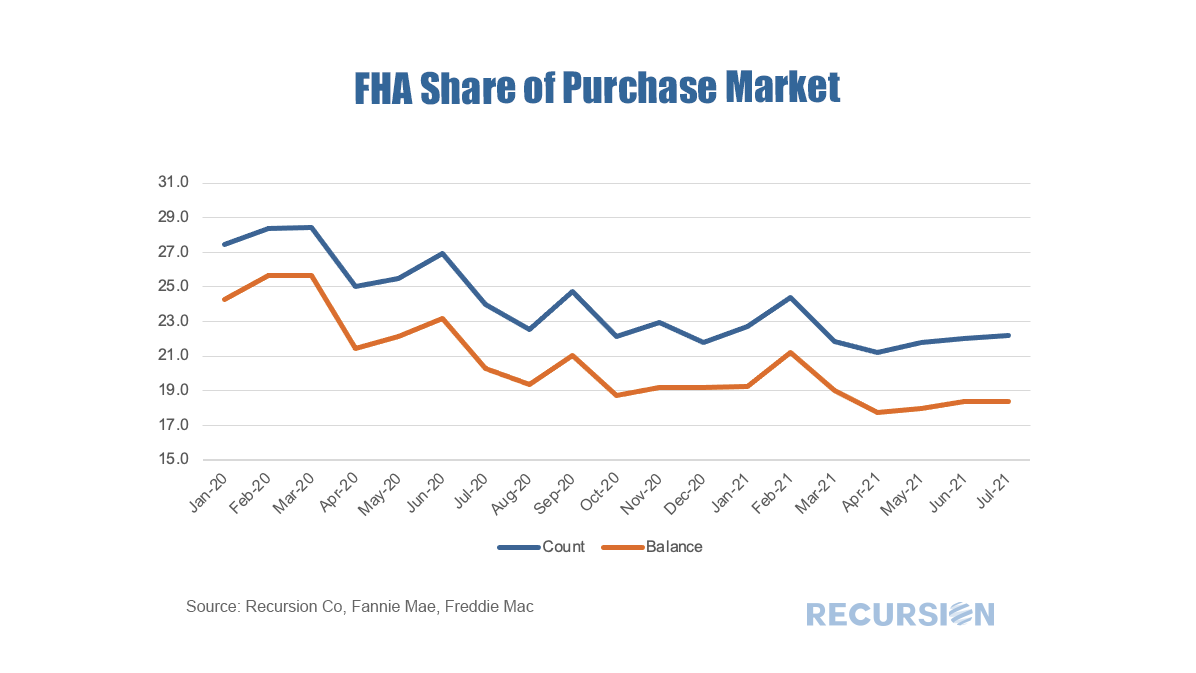 With a base consisting of relatively lower-income borrowers, it makes sense that the borrowers in this program are struggling to qualify for loans in a skyrocketing market. To check this out, we calculate the change in the distribution of loans between FHA and the GSE programs by original loan sizes: 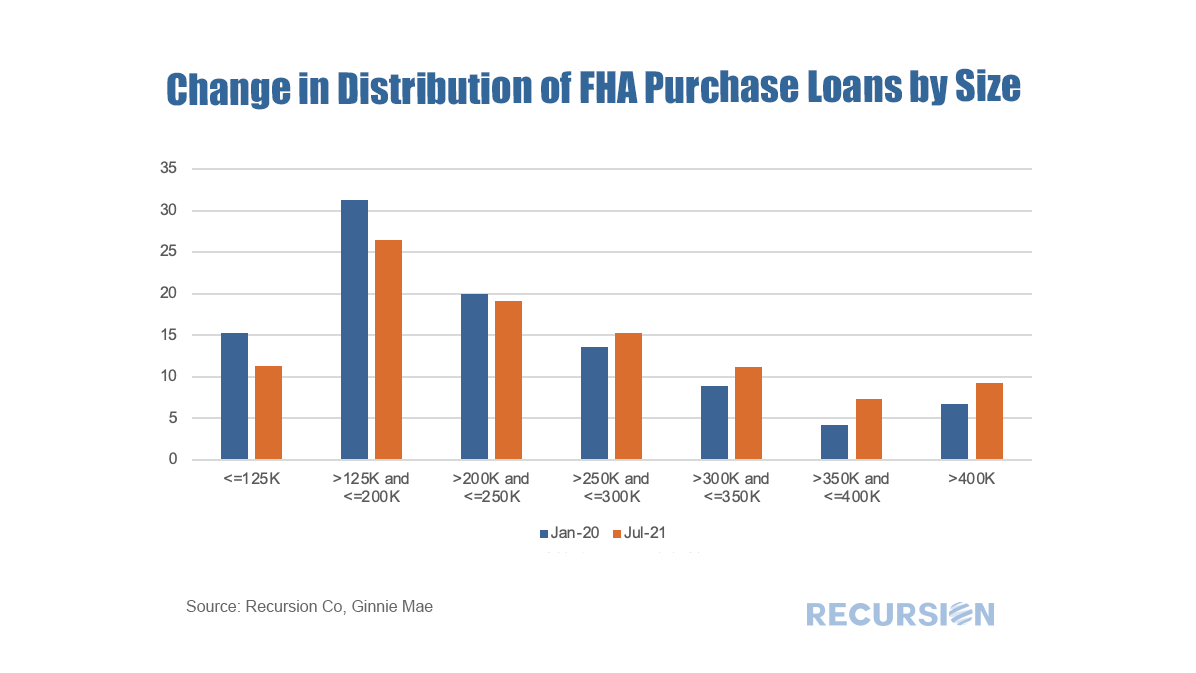 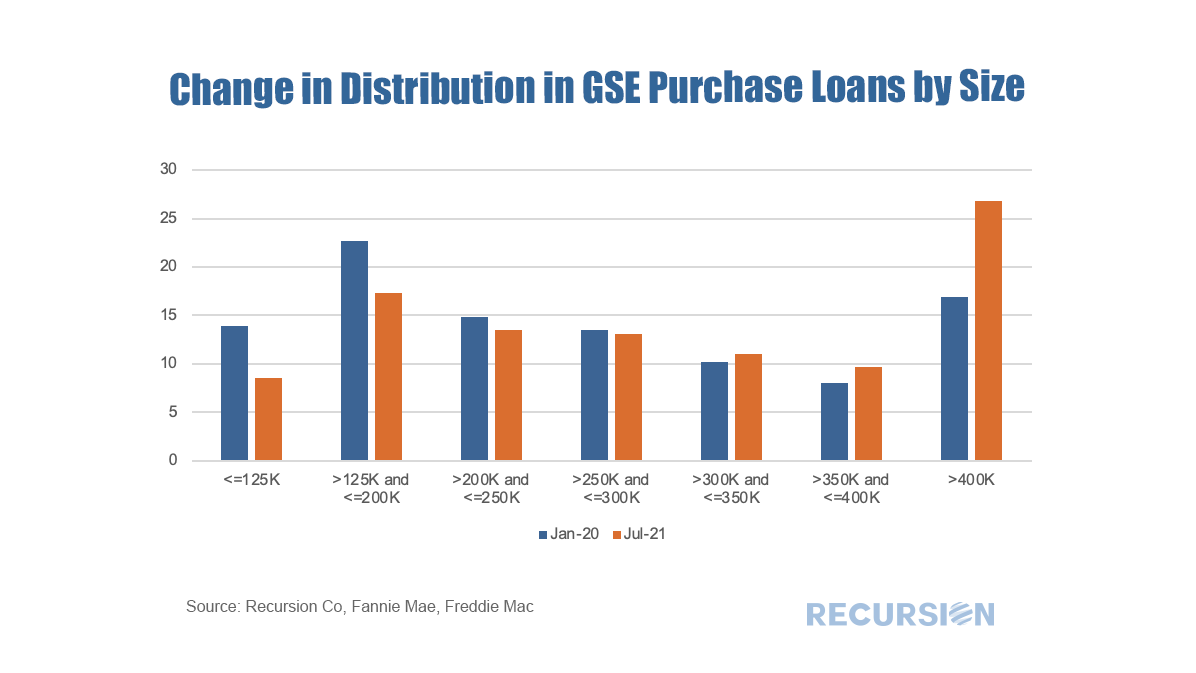 Intuitively, larger loans comprise a greater share of the distribution of purchase loans in both programs between January 2020 and July 2021. Over this period, FHA lost a bit over 5% in market share to the GSE’s in this category. The change in share by loan size bucket and the contribution of each of these to the total loss in share is given below:  In fact, it turns out that about three quarters of the loss in FHA’s purchase market share comes from losses in loan sizes less than $250,000. Further analysis is needed to look at the fundamental and structural factors that are behind this result. [1] In this case we view the total as FHA + GSE
|
Archives
July 2024
Tags
All
|
 RSS Feed
RECURSION |
|

Copyright © 2022 Recursion, Co. All rights reserved.