• HOME
  • solutions
    • RECURSION ANALYZERS
    • Mortgage Company Data
    • Recursion DataCloud
    • Customized Solutions
  • BLOG
  • CLIENT LOGIN
    • Recursion Analyzers
  • ABOUT US
    • OVERVIEW
    • OUR TEAM
    • News & Events >
      • Recursion In News
      • Recursion Data Citations
  • CONTACT
RECURSION CO
  • HOME
  • solutions
    • RECURSION ANALYZERS
    • Mortgage Company Data
    • Recursion DataCloud
    • Customized Solutions
  • BLOG
  • CLIENT LOGIN
    • Recursion Analyzers
  • ABOUT US
    • OVERVIEW
    • OUR TEAM
    • News & Events >
      • Recursion In News
      • Recursion Data Citations
  • CONTACT
BLOG

Affordability and the Agency Distribution of Purchase Mortgages

8/11/2021

 
​The recent unprecedented surge in home prices to a record 18% jump on a year-year basis as measured by the FHFA purchase-only index brings affordability front and center to the current housing policy debates. In May 2021, indexed home prices stood 15.5% above indexed aggregate earned income, a bit less than half of the peak house price overvaluation of 29.0% reached in December 2005, just before the onset of the Global Financial Crisis.
Picture
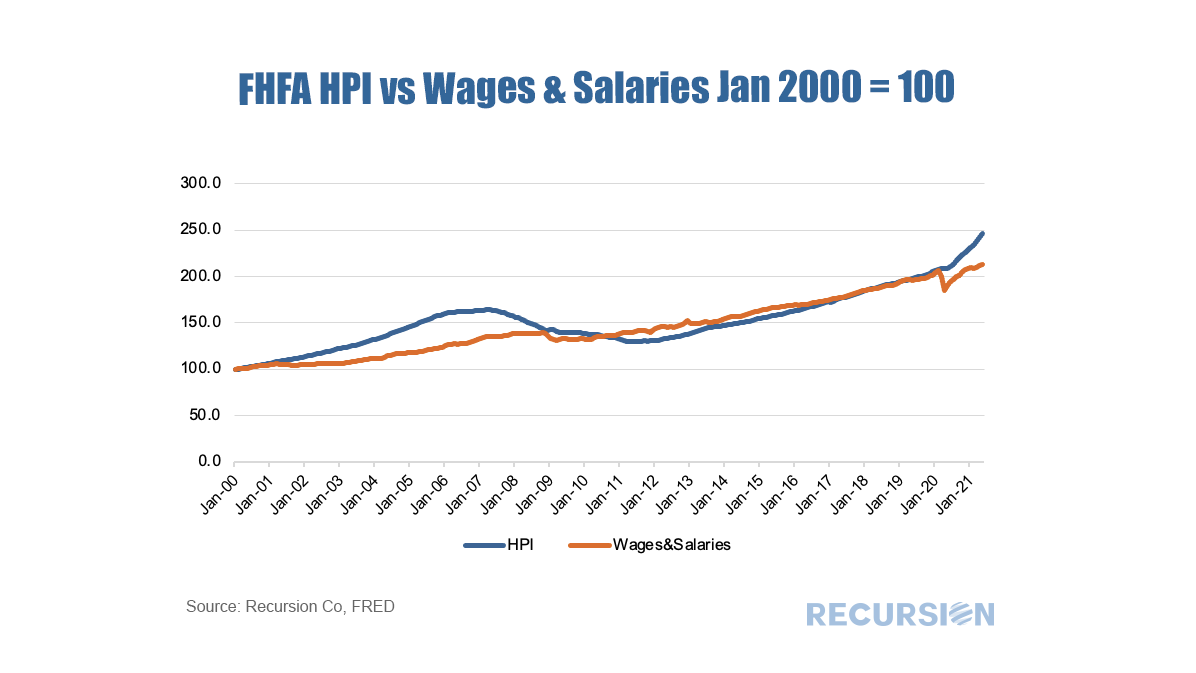
The topic of affordability is very broad, and will be the subject of much further commentary, but in this post we look briefly at this topic through the distribution of the purchase mortgage market across securitization agencies, notably FHA and the GSE’s.

Looking at the distribution between the GSEs and FHA is informative in this issue because the FHA program is aimed at low-income borrowers. According to 2020 HMDA data, the weighted average household income for FHA borrowers of purchase mortgages was $85K while for those in conforming mortgages the figure was $228K.
​
Since the onset of the Covid-19 pandemic in early 2020, the share of FHA purchase mortgages of the total[1] delivered to agency pools as been in general decline, on both a loan count and outstanding balance basis:
Picture
Run Underlying Query
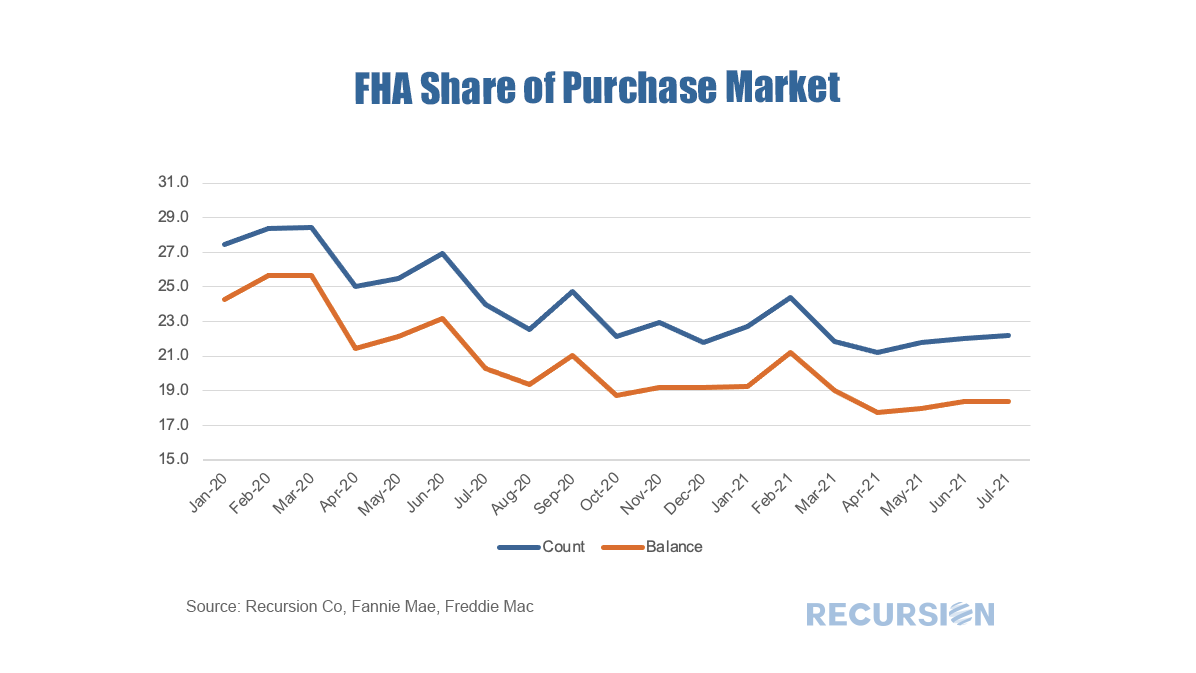
​With a base consisting of relatively lower-income borrowers, it makes sense that the borrowers in this program are struggling to qualify for loans in a skyrocketing market. To check this out, we calculate the change in the distribution of loans between FHA and the GSE programs by original loan sizes:
Picture
Run Underlying Query
Picture
Run Underlying Query
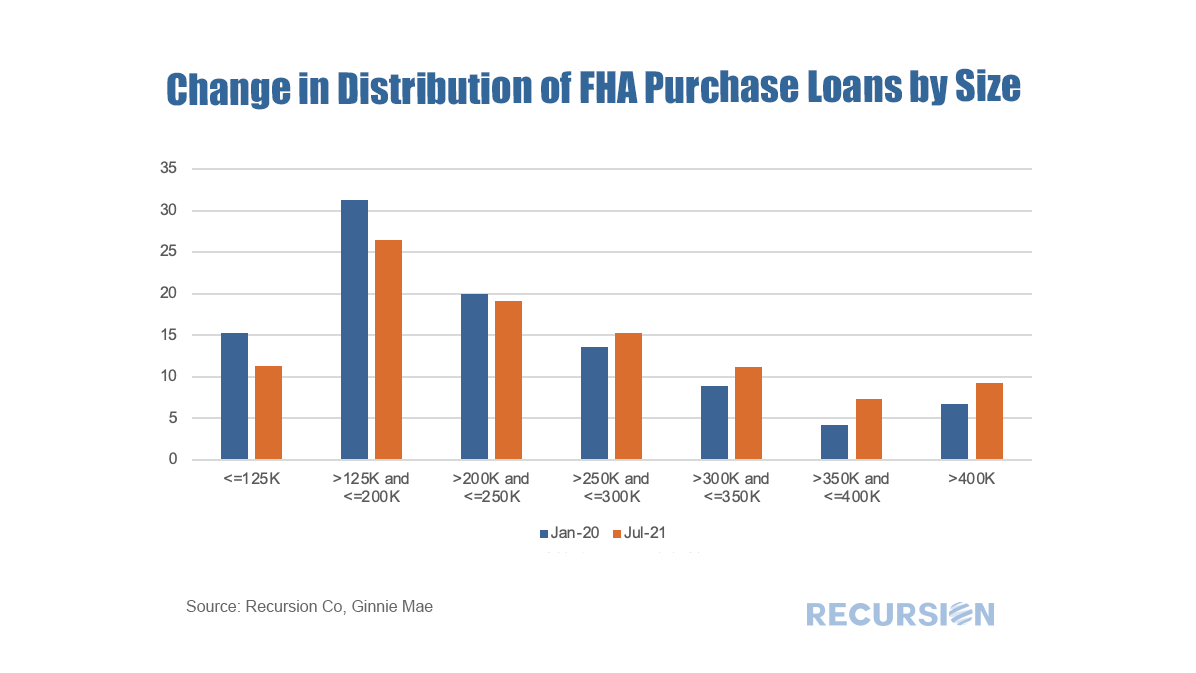
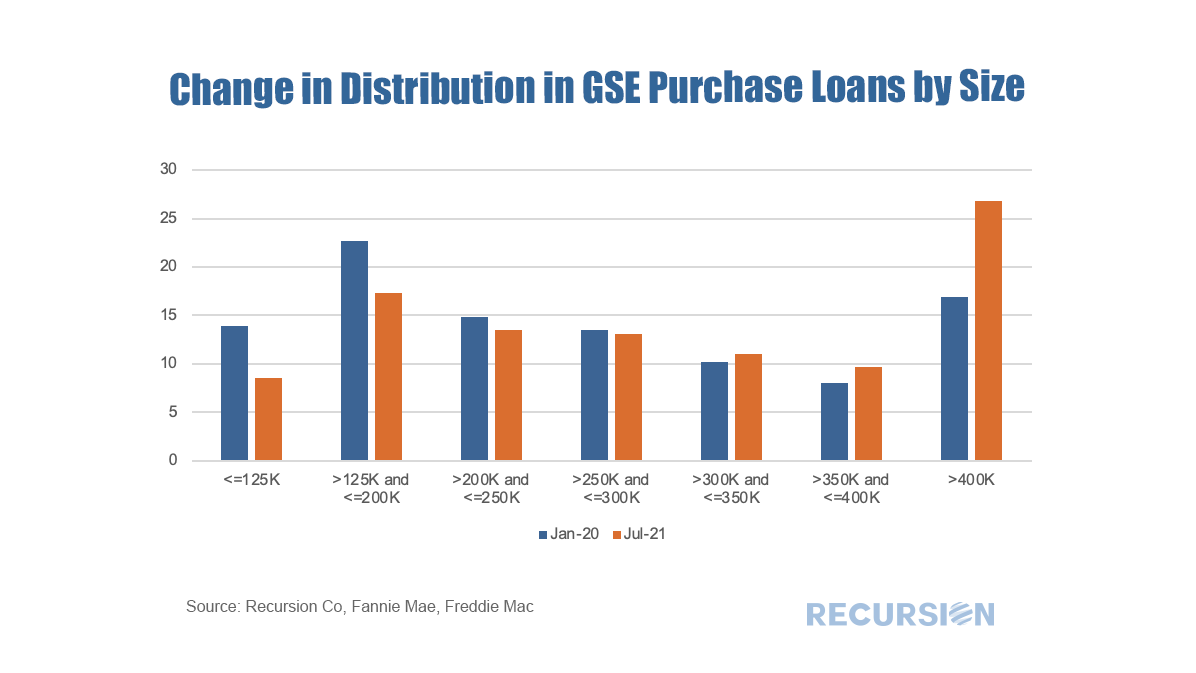
Intuitively, larger loans comprise a greater share of the distribution of purchase loans in both programs between January 2020 and July 2021.
​
Over this period, FHA lost a bit over 5% in market share to the GSE’s in this category. The change in share by loan size bucket and the contribution of each of these to the total loss in share is given below:
Picture
Run Underlying Query
​In fact, it turns out that about three quarters of the loss in FHA’s purchase market share comes from losses in loan sizes less than $250,000. Further analysis is needed to look at the fundamental and structural factors that are behind this result.

[1] In this case we view the total as FHA + GSE

    Archives

    March 2023
    February 2023
    January 2023
    December 2022
    November 2022
    October 2022
    September 2022
    August 2022
    July 2022
    June 2022
    May 2022
    April 2022
    March 2022
    February 2022
    January 2022
    December 2021
    November 2021
    October 2021
    September 2021
    August 2021
    July 2021
    June 2021
    May 2021
    April 2021
    March 2021
    February 2021
    January 2021
    December 2020
    November 2020
    October 2020
    September 2020
    August 2020
    July 2020
    June 2020
    May 2020
    April 2020
    March 2020
    February 2020
    May 2019
    March 2019
    February 2019

    Tags

    All
    Affordability
    ARM
    Bank\Nonbank
    Borrower Assistant Plan
    Cash Window
    Climate Change
    CMBS
    CMO
    Conforming Loan
    Conventional Loan
    COVID 19
    CPR\CDR\CRR\CCR
    Credit Score\DTI\LTV
    CRT\CAS\STACR
    Delinquency
    Early Buyout
    Early Payment Default
    ESG
    ET Pools
    Fannie Mae
    Fed
    FHA
    FHFA
    Forbearance
    Foreclosure
    Foreign Investor
    Freddie Mac
    Ginnie Mae
    Green Loans
    HECM
    HELOC
    HMDA
    HUD
    LMI
    Manufactured Housing
    Modified Loans
    MSR
    Multifamily
    Occupancy Type\NOO
    Partial Claim
    Payoff
    PIW
    Prepayment
    Purchase Loans
    Recursion In News
    Refi Loans
    Reperforming
    RG Pools
    Rural Housing
    Single Family
    Special Eligibility Program
    TBA Market
    TIC
    TPO
    UMBS
    US Treasury
    VA

RECURSION

SOLUTIONS ​
Recursion Analyzers
​
Mortgage Company Data
Recursion DataCloud
Customized Solutions


ABOUT US  ​
Overview
​Our team
CLIENT LOGIN   ​
Recursion Analyzers

CONTACT

224 West 30th St., Suite 303, New York, NY 10001
Contact Us

Picture
Copyright © 2022 Recursion, Co. All rights reserved.​
  • HOME
  • solutions
    • RECURSION ANALYZERS
    • Mortgage Company Data
    • Recursion DataCloud
    • Customized Solutions
  • BLOG
  • CLIENT LOGIN
    • Recursion Analyzers
  • ABOUT US
    • OVERVIEW
    • OUR TEAM
    • News & Events >
      • Recursion In News
      • Recursion Data Citations
  • CONTACT