|
In a recent post, we discussed the attributes of manufactured housing data that came with the final 2021 HMDA release in July[1], which were not available in the preliminary release. Another important data point from this final release is the conforming flag, identifying which loans satisfy the requirements for delivery to Fannie Mae and Freddie Mac. Obviously, any loan sold to a GSE is conforming, so its main use is to enable analysts to examine these loans which are held on bank balance sheets. The lag between the preliminary and final releases of HMDA data can be four months or longer, so it would be useful to be able to identify these loans right after the preliminary release. One way to approach this is to flag non-government loans with balances above the conforming limits as “jumbo”. How does Recursion’s “Jumbo” flag compared with HMDA’s Conforming flag? If the information is perfect, “Jumbo” loans should be all the loans that are not “Conforming”. However, the exact original balance of a mortgage is not provided by HMDA to protect privacy. For those loans close to the conforming boundary, our program can misjudge which category to assign. Given all that, going back to 2018, there is still a very strong negative connection between the two measures: 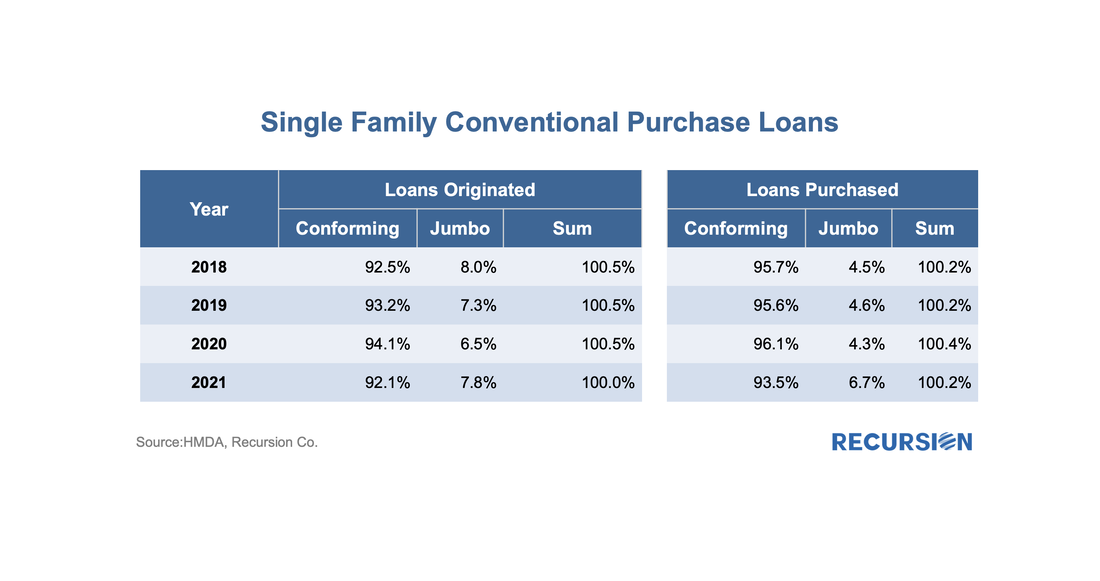 In a recent post, we discussed the utility of secondary market indicators to track the progression of loans that are coming out of forbearance in Government programs[1]. This short note looks at this progression in the conforming loan market. For the Ginnie Mae programs, issuers may buy loans out of pools after they are delinquent more than 90 days and begin a workout process that culminates in one of the options, including loan modification. The situation is quite a bit different for Fannie Mae and Freddie Mac. The main distinction is that on January 1, 2021, the GSEs extended their timeline for buying loans out of pools to 24 consecutive months of missed payments[2]. As the Covid-19 pandemic began in March 2020, we expect to see buyouts being extended as much as to April and May this year. However, we can obtain a view on future loan modifications through the trial mod flag in the borrower assistance plan field in the monthly disclosures the GSEs started to release in March, 2021. In order to obtain a permanent modification, borrowers must first successfully complete a three-month trial modification plan[3]. Below find the progression in the number of loans in such plans since March 2021: 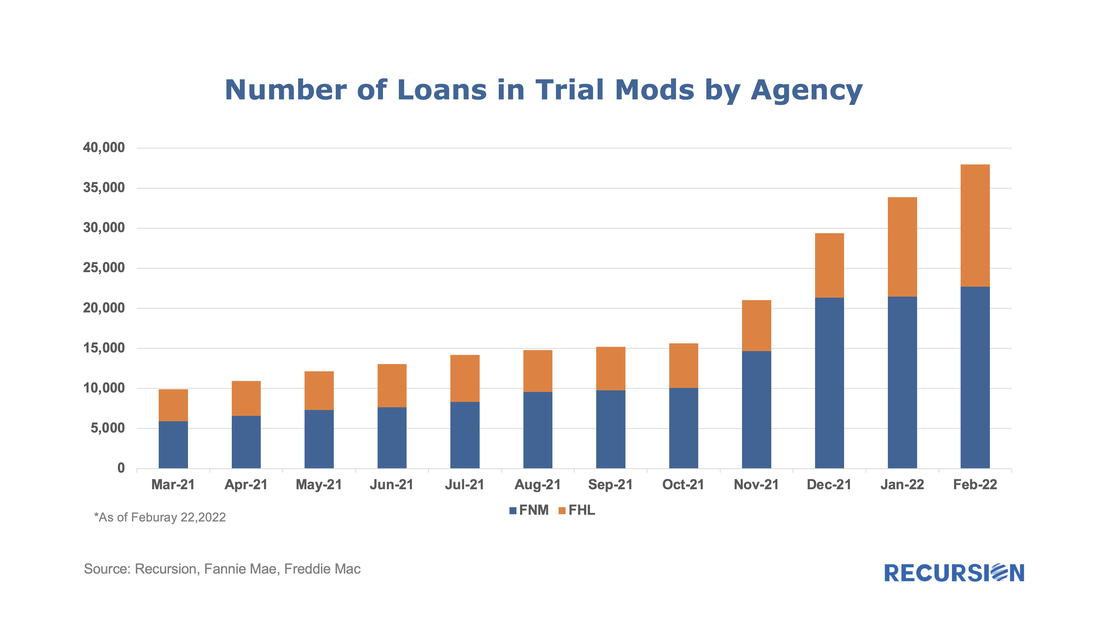 On December 30, 2021, FHFA announced that the baseline conventional loan limit for 2022 would rise by $98, 950 to $647,200.[1] The new ceiling for high-cost areas is set at 150% of the baseline limit or $970,800. Since loan limits apply when they are delivered to the agencies, not when they are originated[2], it would be of interest to look at the pace at which loans reaching to the new limit are delivered at the start of the year. The chart below shows the distribution of mortgages delivered to the GSE’s in Q1 2021 by loan size($K). 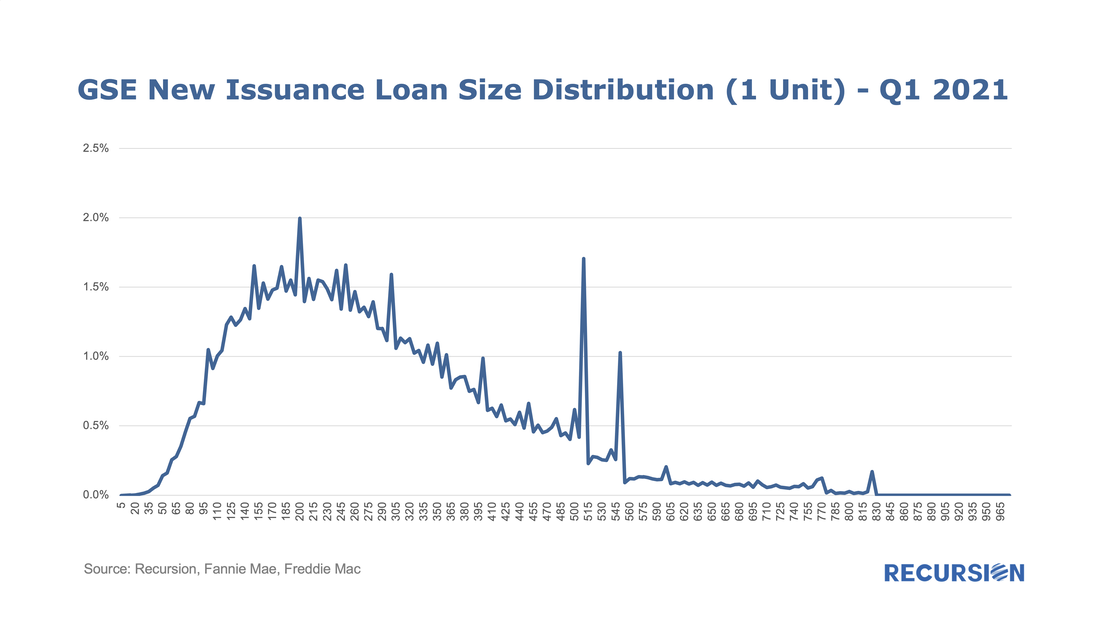 The recent unprecedented surge in home prices to a record 18% jump on a year-year basis as measured by the FHFA purchase-only index brings affordability front and center to the current housing policy debates. In May 2021, indexed home prices stood 15.5% above indexed aggregate earned income, a bit less than half of the peak house price overvaluation of 29.0% reached in December 2005, just before the onset of the Global Financial Crisis. 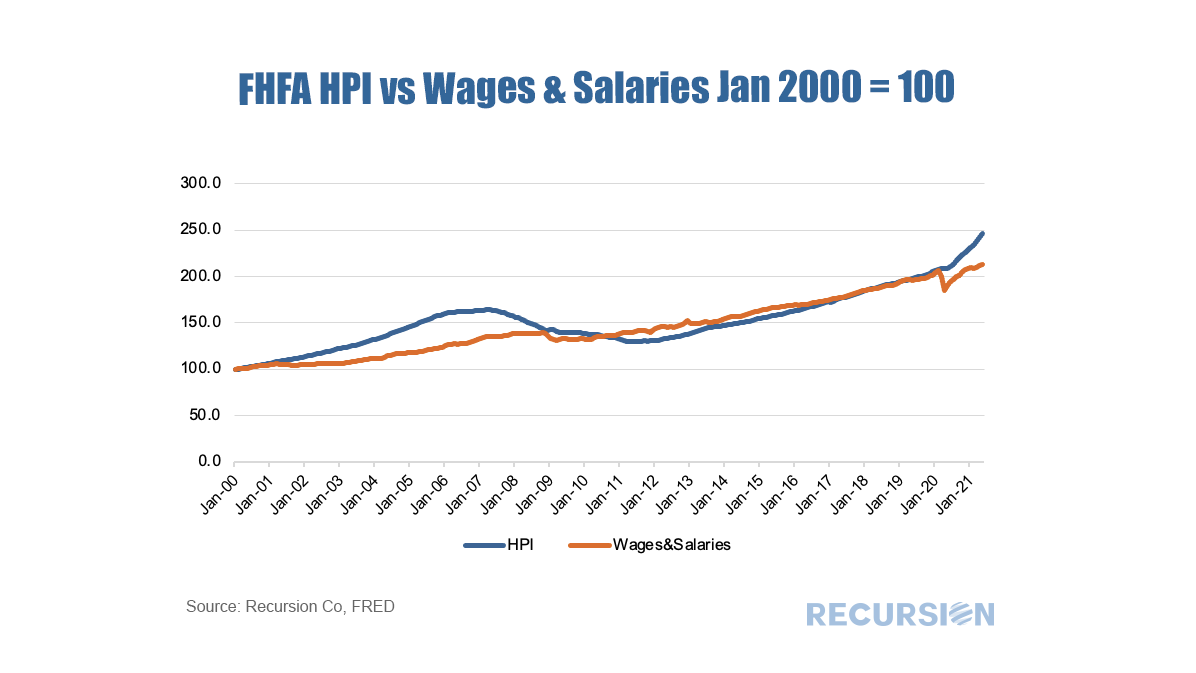 The topic of affordability is very broad, and will be the subject of much further commentary, but in this post we look briefly at this topic through the distribution of the purchase mortgage market across securitization agencies, notably FHA and the GSE’s. Looking at the distribution between the GSEs and FHA is informative in this issue because the FHA program is aimed at low-income borrowers. According to 2020 HMDA data, the weighted average household income for FHA borrowers of purchase mortgages was $85K while for those in conforming mortgages the figure was $228K. Since the onset of the Covid-19 pandemic in early 2020, the share of FHA purchase mortgages of the total[1] delivered to agency pools as been in general decline, on both a loan count and outstanding balance basis: 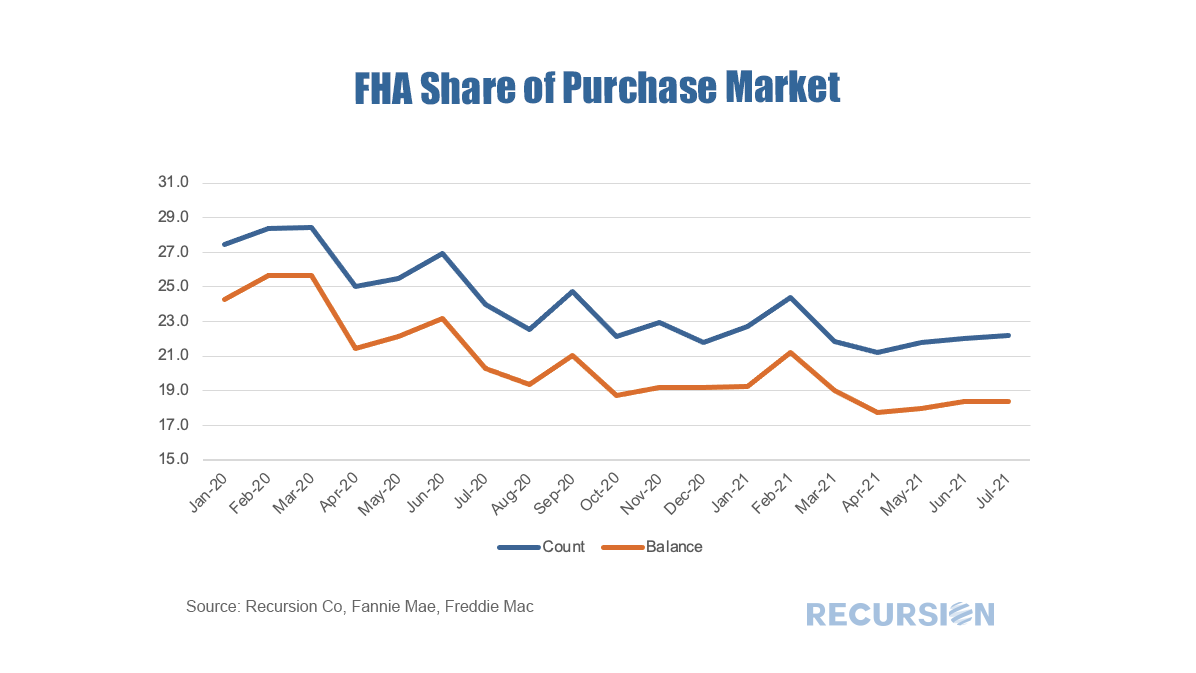 With a base consisting of relatively lower-income borrowers, it makes sense that the borrowers in this program are struggling to qualify for loans in a skyrocketing market. To check this out, we calculate the change in the distribution of loans between FHA and the GSE programs by original loan sizes: 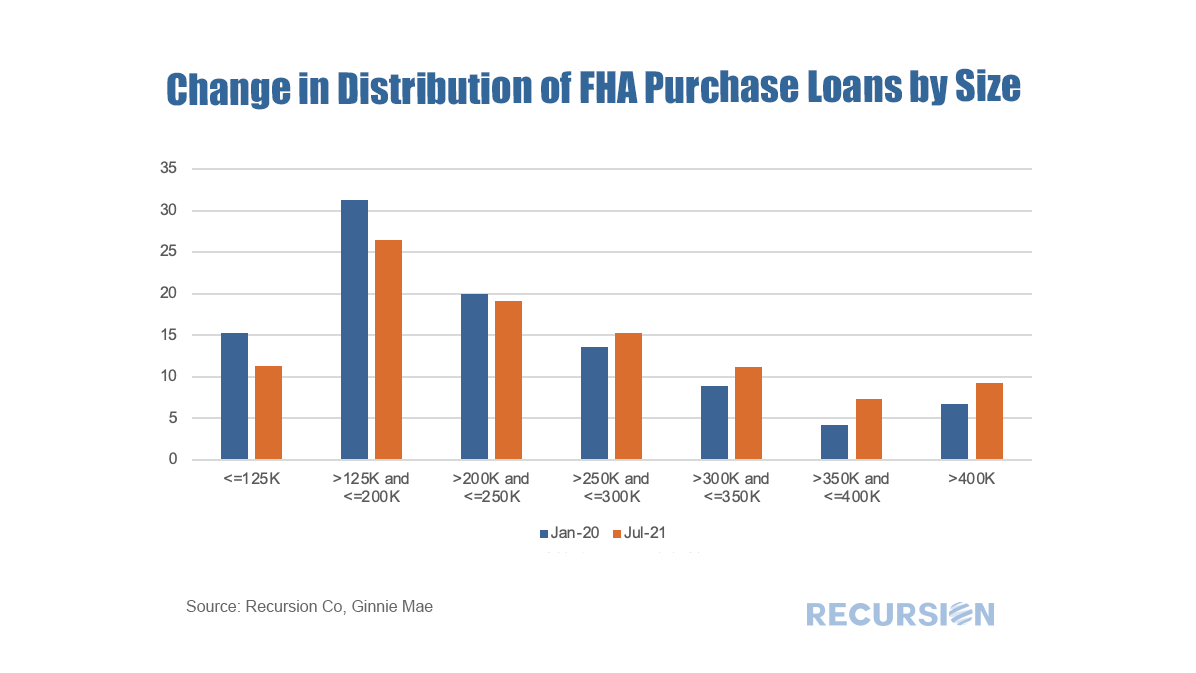 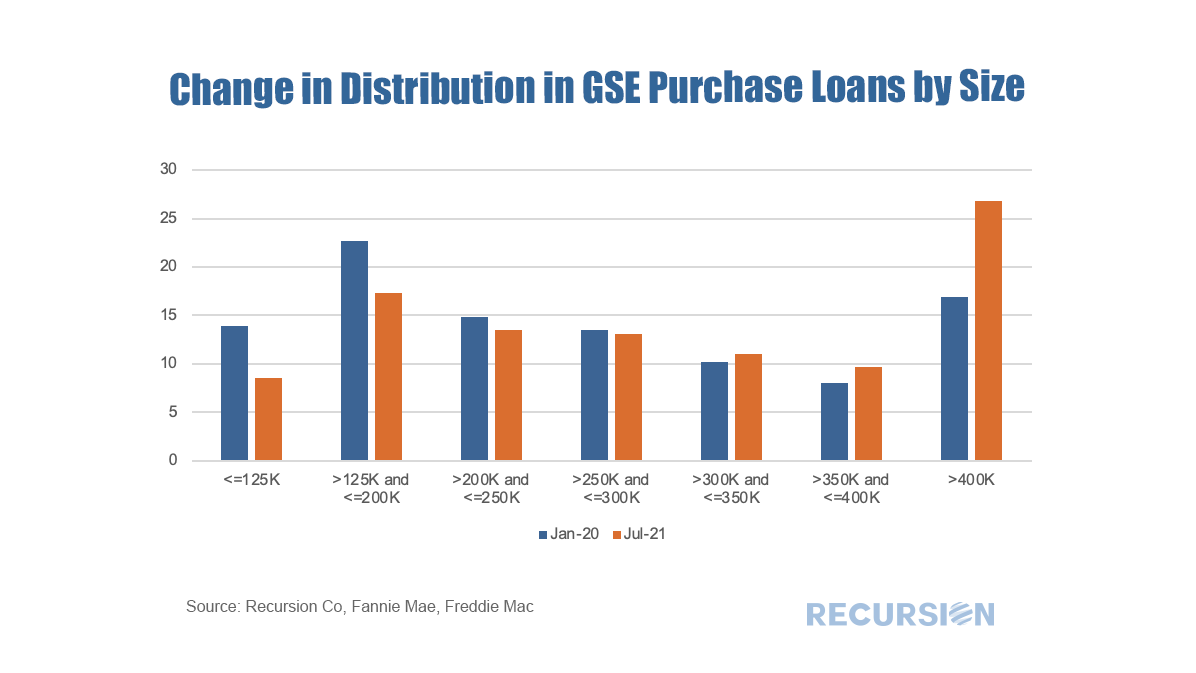 Intuitively, larger loans comprise a greater share of the distribution of purchase loans in both programs between January 2020 and July 2021. Over this period, FHA lost a bit over 5% in market share to the GSE’s in this category. The change in share by loan size bucket and the contribution of each of these to the total loss in share is given below:  In fact, it turns out that about three quarters of the loss in FHA’s purchase market share comes from losses in loan sizes less than $250,000. Further analysis is needed to look at the fundamental and structural factors that are behind this result. [1] In this case we view the total as FHA + GSE
In a recent post we discussed trends in the conforming purchase market by occupancy type[1]. In this note we look at performance metrics. To begin, we look at prepayment speeds. It’s important to note that certain fees (which Fannie Mae calls LLPA’s[2] and Freddie Mac calls Credit Fees[3]) vary by occupancy type, particularly for those with high LTV’s. 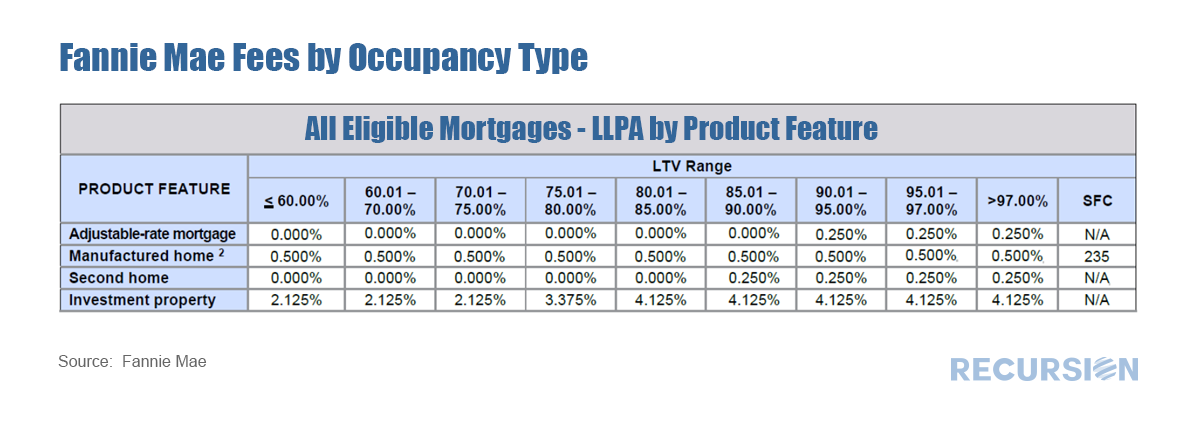 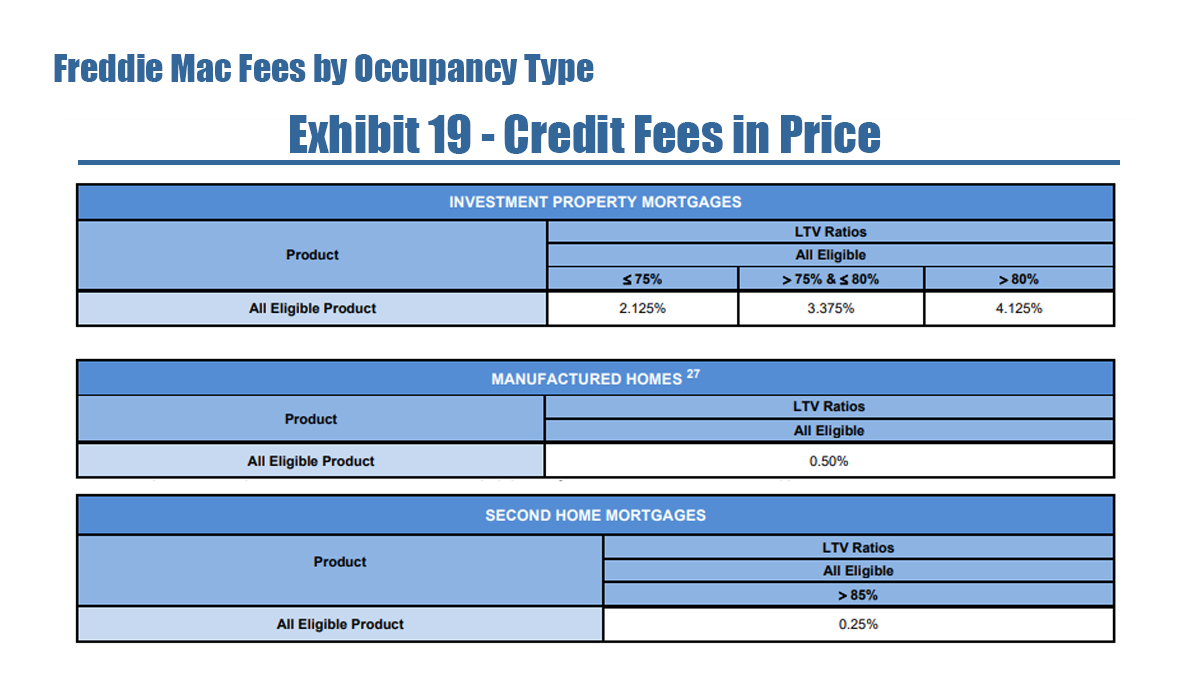 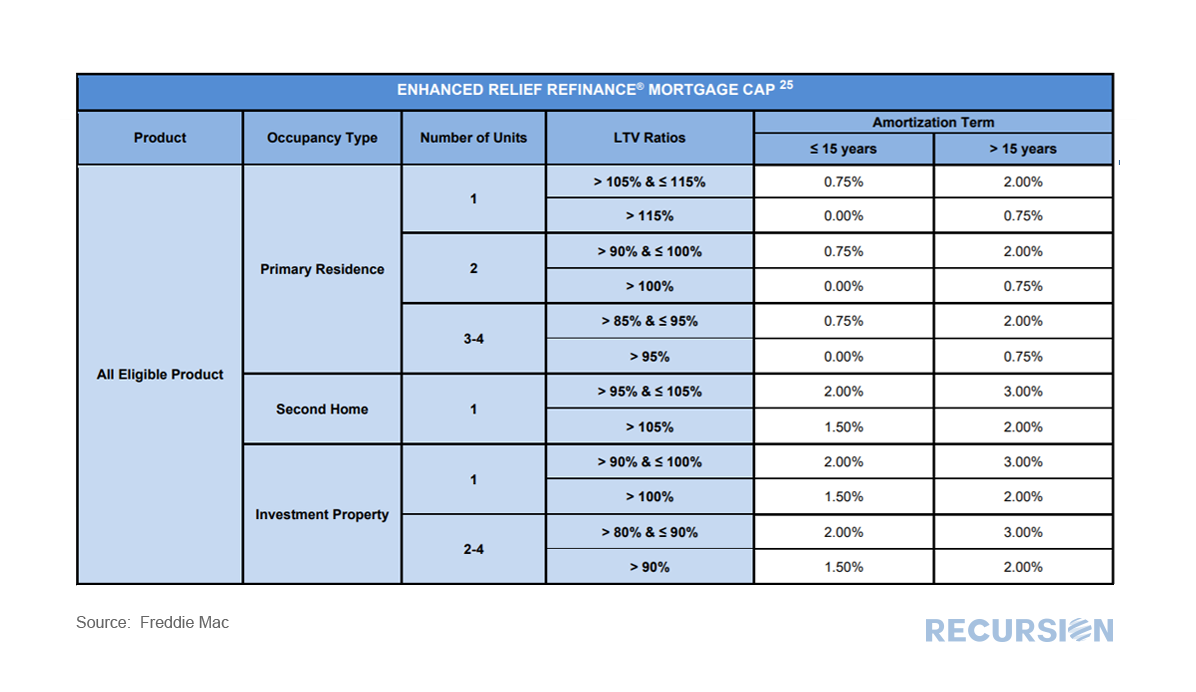 In a recent post we noted the recent striking rise in the GSE refinance share and commented that the rate of this activity in GNM programs, while still rising, has lagged[1]. This seems to be related to the tendency of capacity constrained lenders to provide credit to the highest quality borrowers, and to a looming 0.5% fee hike on GSE refinance deliveries scheduled for December 1. Focusing on FHA alone, the share of refinance loans compared to those delivered to the GSE’s has plummeted in recent months: 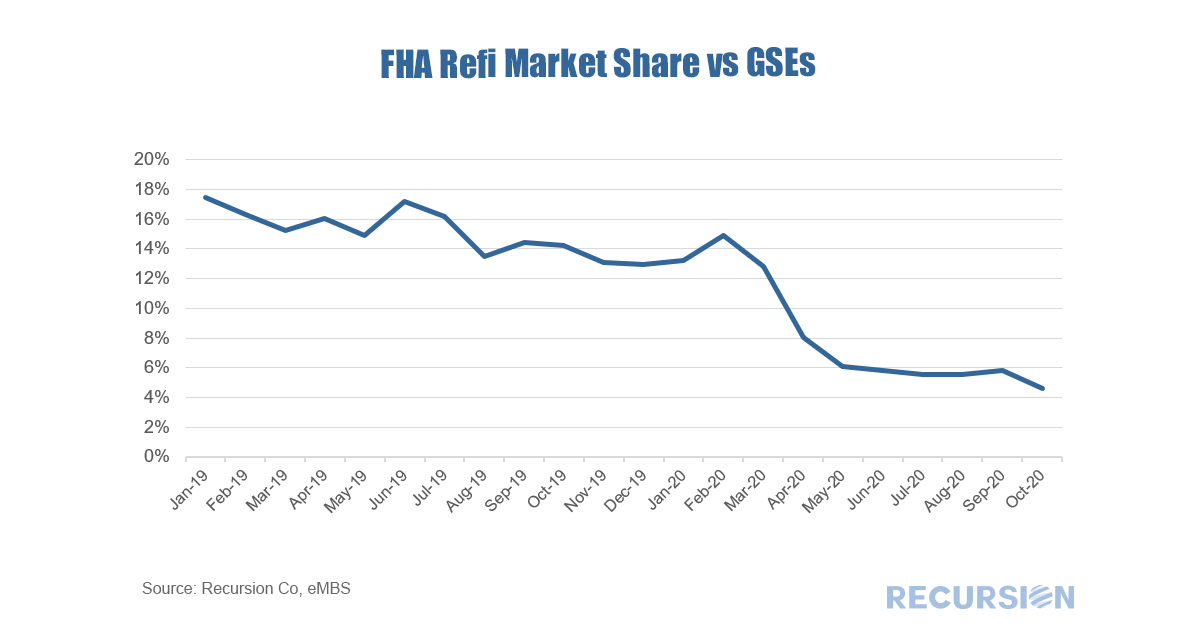 In our third look at 2019 HMDA[1] characteristics we look at mortgage originations by income bracket. Lending to low- and moderate-income households is an important regulatory requirement of banks[2]. The definition of “low” and “moderate” depends on the local area in which the bank operates. HMDA data is well-suited to regulators looking to track the performance of the institutions they oversee and allows banks to benchmark their performance against their competition. If banks need to add low- to moderate-income loans to their portfolio to meet requirements, HMDA can provide direction regarding which institutions might be a source of product that meets needed characteristics. Below we present a quick high-level example. HMDA data operates down to the census tract level, but for our purposes here let’s look at two distinct states: California and Oklahoma. In 2018, median income in the two states was $70,500 and $54,400, respectively[3]. According to Zillow data[4], the median house prices in California and Oklahoma that year were $550,000 and $122,000 respectively. Clearly housing is relatively unaffordable for households at or below median income in California compared to Oklahoma. So it is not surprising that the homeownership rate in Q2 2018 for California, at 54.3%, is substantially below that of Oklahoma, at 69.1%[5]. Confirming this, the following table from 2018 and 2019 HMDA show that there is a substantially greater share of lower- and moderate- income loans available in Oklahoma than in California. Interestingly this share declined in 2019 relative to 2018, particularly for Oklahoma. It is not clear whether this is due to fundamental factors or technical issues related to an increase in the share of “N/A” responses between the two years. 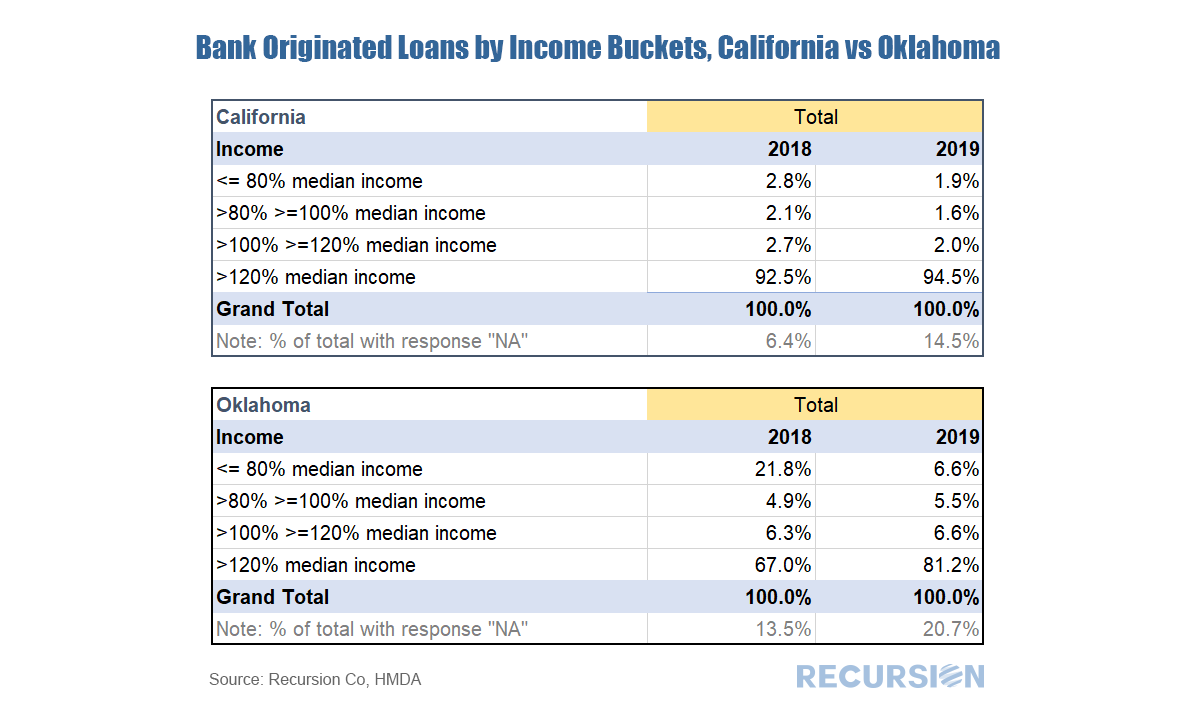 Finally, to be consistent with prior posts we look at the share of conforming loans originated by banks that are sold to the GSEs, broken down by income brackets: 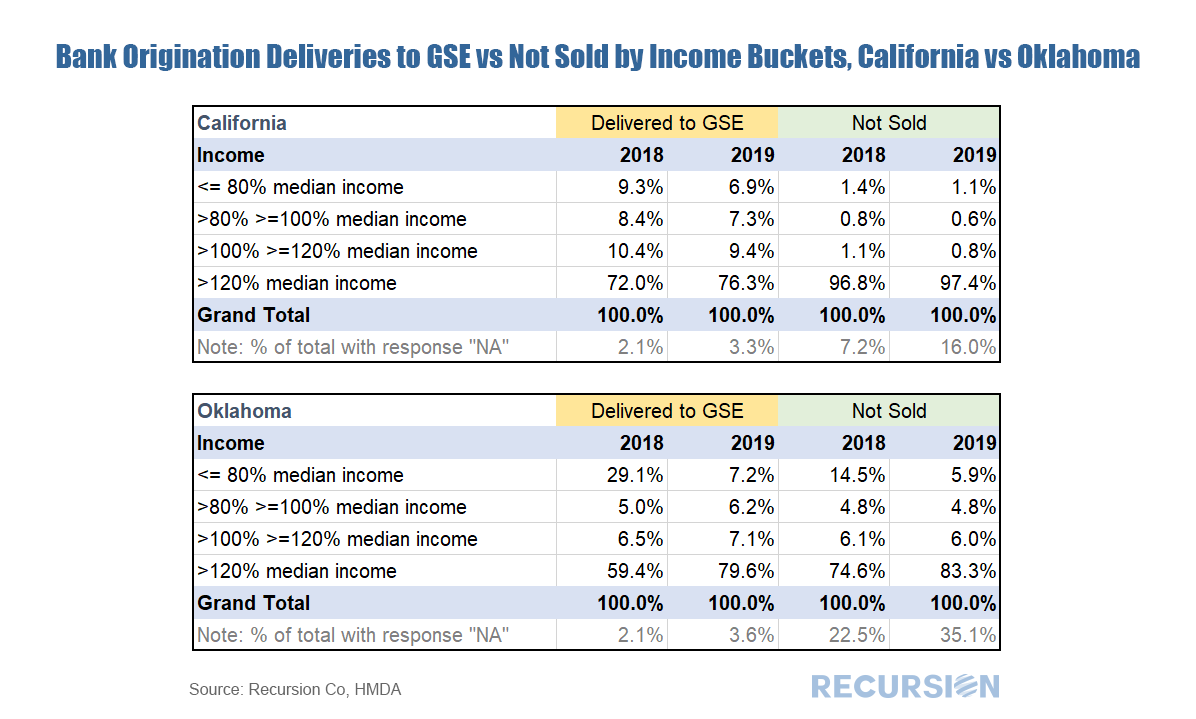 A few interesting observations pop up. First, in California the loans that banks keep on their book are almost entirely made to the highest-income households. For Oklahoma, it’s a mixture of highest income and lowest income. This suggests that policy requirements regarding serving poorer communities plays a relatively greater role in Oklahoma than California. [1] The first two 2019 HMDA blogs are available at
https://www.recursionco.com/blog/what-is-the-credit-quality-of-loans-held-on-book https://www.recursionco.com/blog/credit-quality-held-on-book-2-looking-at-ltv [2] See for example, https://www.fdic.gov/regulations/resources/director/virtual/cra.pdf [3] Data from 1984 – 2018 can be found https://www2.census.gov/programs-surveys/cps/tables/time-series/historical-income-households/h08.xls [4] Taken from June 2018 data at https://www.zillow.com/ok/home-values/ and https://www.zillow.com/ca/home-values/ [5] https://www.census.gov/housing/hvs/data/rates/tab3_state05_2020_hmr.xlsx In a recent post we looked at the differences in bank underwriting characteristics between those conforming loans held on book compared to those delivered to the GSEs using data pulled from Recursion HMDA Analyzer[1]. We now extend this into another dimension via the addition of LTV. Below find the difference in share of such deliveries between sold loans and those held on book: 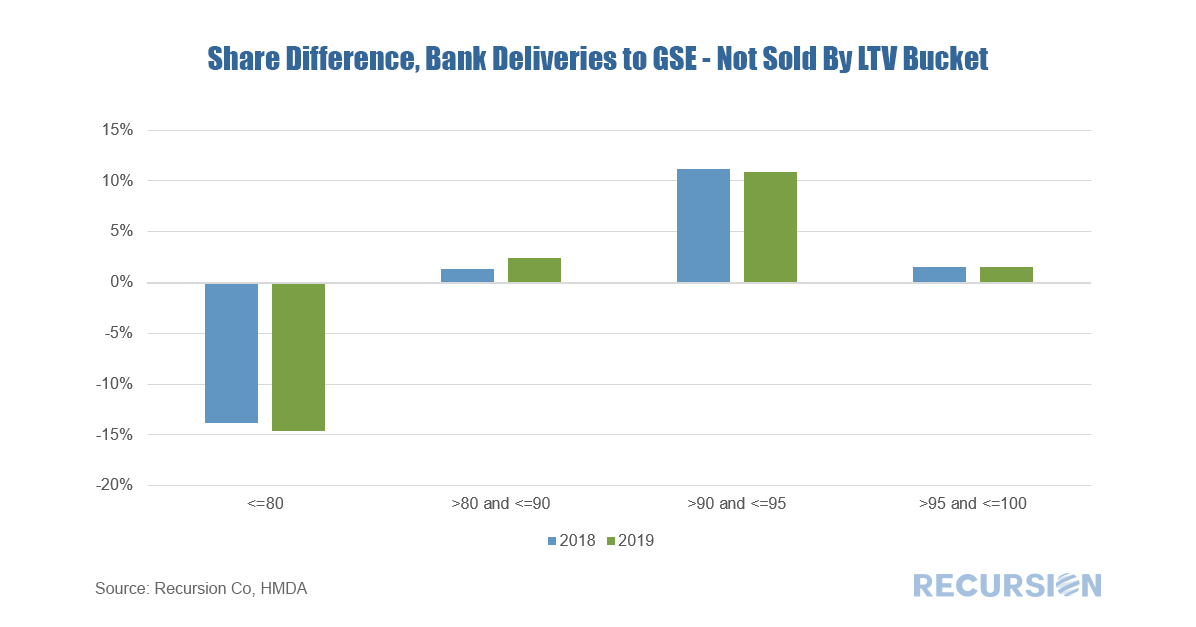 |
Archives
July 2024
Tags
All
|
 RSS Feed
RECURSION |
|

Copyright © 2022 Recursion, Co. All rights reserved.