|
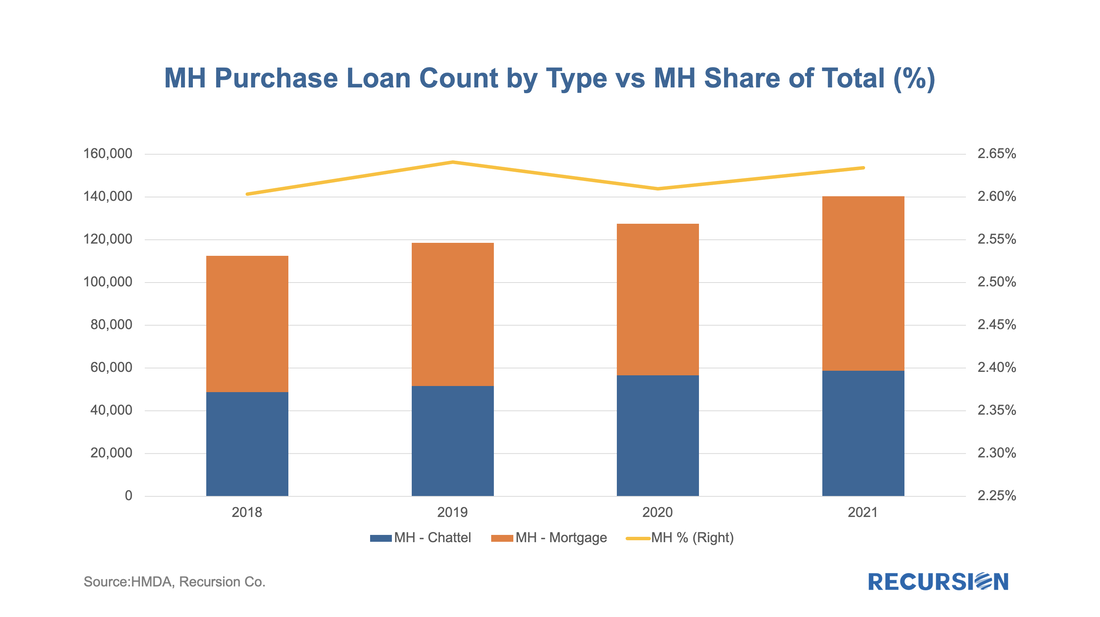
The release of 2021 HMDA data in March set off a familiar round of impactful analysis[1]. However, there are components that cannot be obtained unit the final release in July, including the important category of manufactured housing, a key piece of the policy discussion around affordable housing. Last year we dug into this topic[2] and it would be a good time to update this analysis with new information from the final 2021 release.
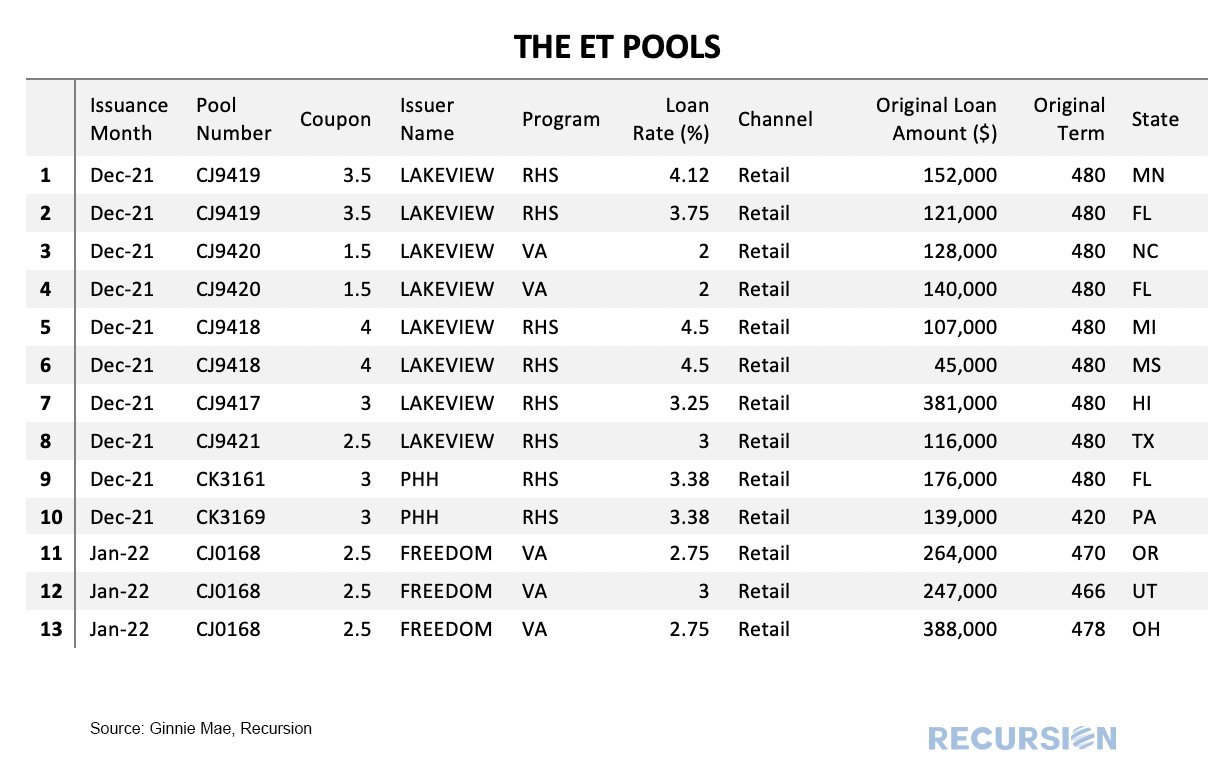
First of all, manufactured housing experienced a resurgence in 2021: On June 25, 2021, Ginnie Mae announced the creation of a new pool type C-ET that consists of modified loans with original terms greater than 361 months and less than or equal to 480 months[1]. The Custom pool design implies that each pool is created by a single issuer. Other custom pools are limited to 360-month maturities, so this structure is designed to enhance liquidity for these borrowers. 7 such pools were issued in December 2021, and 1 in January 2022 so far. The 8 pools have only 13 loans, from 3 issuers. 8 out the 13 loans are Rural loans, 5 are VA. Once again, Ginnie Mae has provided the market with new investment opportunities, and analysts with the opportunity to learn about how markets behave under long-term timeframes. With affordable housing for Low-Moderate Income (LMI) households at the top of the policy agenda, we take a look at loan data for manufactured housing (MH). In a recent report, the CFPB provided a comprehensive survey of this market based on enhancements to the HMDA data first made available in 2018[1]. These include data on
Secured property type:
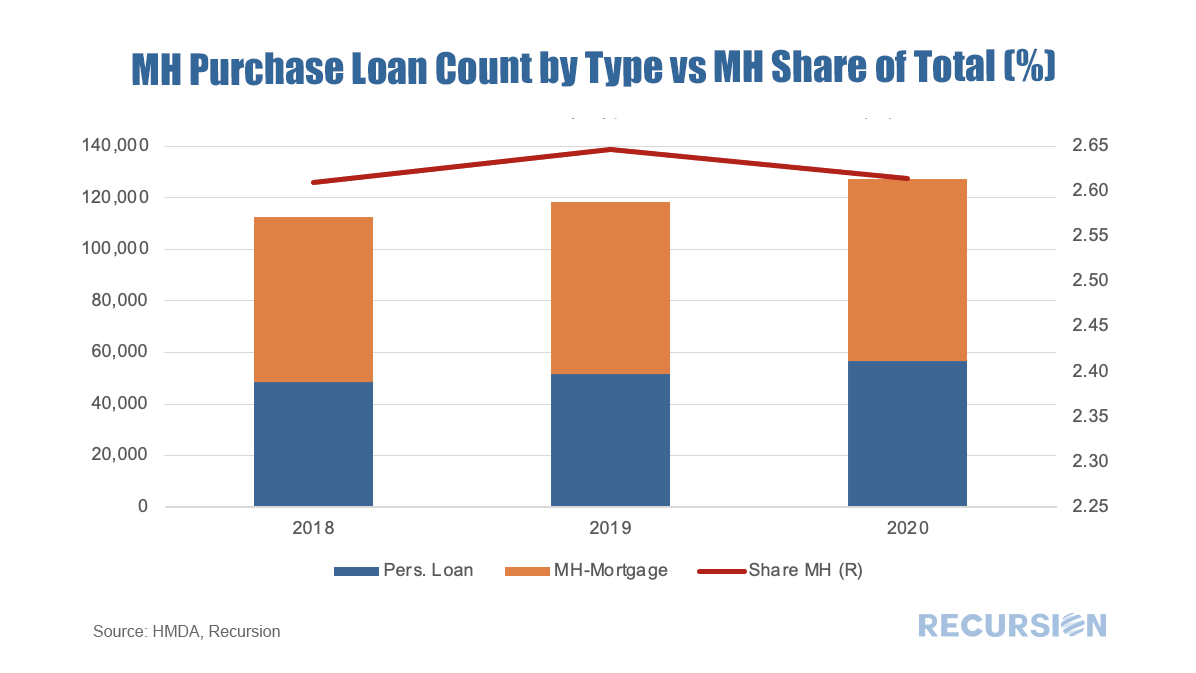
In their survey, the CFPB looked deeply into the data for 2019. In this note, we update some of their work with 2020 HMDA data. This is important because of the onset of Covid-19 that year. The site-built market performed strongly, but this cannot necessarily be presumed to carry over to MH as Covid is a supply shock, impacting labor markets and supply chains. Another innovation in this note is that rather than looking at this market by state the way the CFPB does, as a policy guide we look at it bifurcated between rural and nonrural MSAs. Below finds a chart of the progression of single-family manufactured housing origination volumes for personal loans (securitized by chattel) and mortgages (securitized by real property) from 2018-2020, along with the share of all single-family manufactured housing loans (personal loans plus mortgages) of the total single-family mortgages including those for site-built homes. Financial support for rural communities has been a feature of US economic policy since the Farm Credit System was established as the first GSE in 1916[1], sixteen years before the Federal Home Loan Banks were established in 1932[2]. This support continues to this day and has expanded to encompass additional programs.
Ginnie Mae Program While the best-known collateral for Ginnie Mae securities is loans underwritten through the FHA and VA programs, another form is loans underwritten by the US Department of Agriculture Rural Development (RD) Program, launched in 1990 as part of the Farm Bill passed that year[3]. The Single-Family Direct Home Loan Program[4] in particular is designed to provide payment assistance to low- and very-low-income households in rural communities. Of course, FHA and VA provide loans in rural areas under the terms of their programs as well. GSE Rural Lending Single-family lending at Fannie Mae and Freddie Mac was handed a mandate to provide liquidity to rural communities through the adoption of the Duty-to-Serve provision of the HERA Act enacted in 2008[5]. This program requires the GSE’s to engage in activities to facilitate liquidity in three underserved markets:
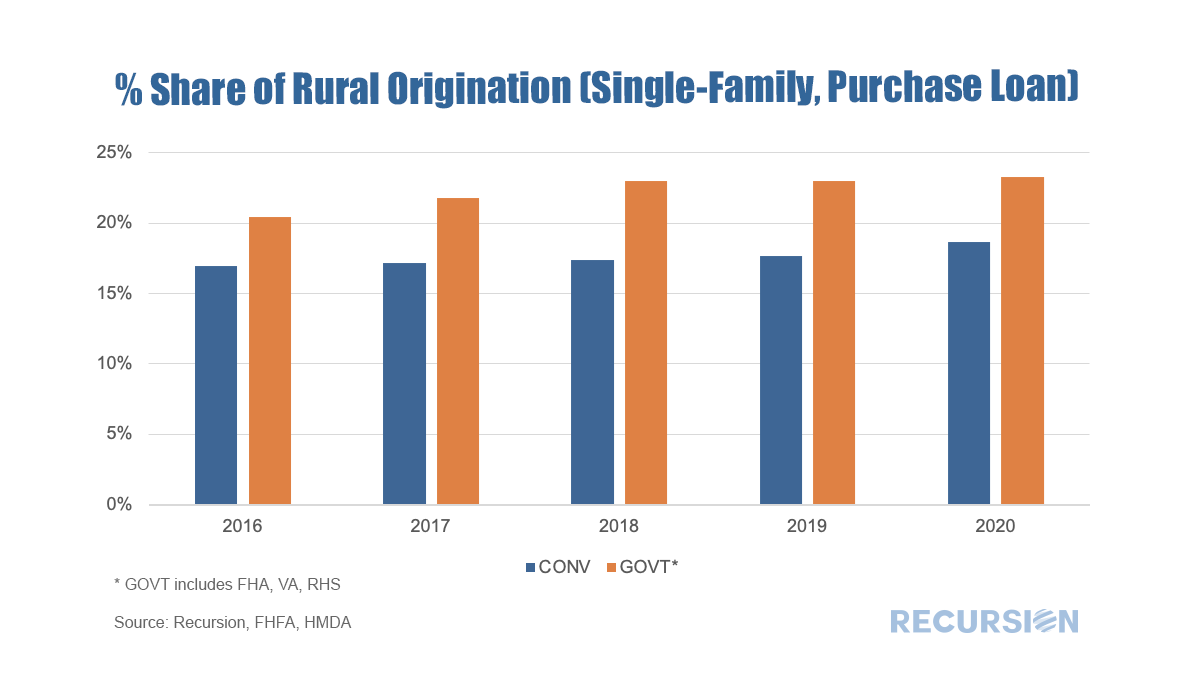
A key feature of this regulation is that FHFA has provided new datasets and tools to enhance the analysis of these markets[6]. In particular, Rural Areas FHFA's Duty to Serve regulation defines "rural area" as: (1) a census tract outside of a metropolitan statistical area, as designated by the Office of Management and Budget; or (2) a census tract in a metropolitan statistical area, as designated by the Office of Management and Budget, that is outside of the metropolitan statistical area's Urbanized Areas as designated by the U.S. Department of Agriculture's Rural-Urban Commuting Area Code #1, and outside of tracts with a housing density of over 64 housing units per square mile for USDA's RUCA Code #2. Below is a link to the specific geographies which meet the Rural Areas definition. Using this segmentation, we are now in a position to load their definition into our databases and look at trends in this market segment. Using HMDA data as a base, we produce the following chart[7]: |
Archives
July 2024
Tags
All
|
RECURSION |
|
Copyright © 2022 Recursion, Co. All rights reserved.


 RSS Feed
