|
In recent months, we have witnessed increasing attention being focused on the Government mortgage programs, particularly VA. Two issues in particular have generated considerable discussion. First, last year VA allowed its forbearance programs to expire without a backstop for distressed borrowers wishing to avoid foreclosure. Instead, VA implemented a voluntary foreclosure moratorium for their servicers, which has been extended to the end of 2024. And very recently, VA implemented a new program, the Veterans Administration Servicing Purchase Program (VASP), to help households in need, with full availability required by December 31, 2024[1]. Second, there has been a noticeable pickup in VA prepayment speeds compared to other major programs, including FHA[2]. This is particularly evident in higher coupon securities:  There is a natural tendency to think about housing finance in a bifurcated manner: single- and multifamily. But this distinction is hardly clear. For a long time, we’ve had condos and coops, and more recently new esoteric property types like buy-to-rent. The mechanics are quite distinct but, in each case, we are talking about debt and equity, borrowers and lenders and servicers. But mostly we are talking about places to live. In scaling the two types of residences, we normally look at dollar amounts. From the Federal Reserve Z1 data[1], we can see that Agency single-family debt outstanding stood at $9.038 trillion in Q4 2023 while multifamily just crossed the trillion-dollar threshold at $1.002 trillion, giving a ratio of 9.02. Single-family dominates. In terms of the agency share of these markets, we have:  A little while ago, we wrote about DPAs and noted that there are distinct differences in how these are reported between the GSEs and FHA[1]. Subsequently, we looked into the issuers of these FHA DPA loans and noted that DPA usage has been broadening to include a growing set of lenders in recent years[2]. We now turn to the GSEs. We noted in our earlier reports that while there is no DPA flag for the Enterprises, we can derive some information about their use from the fact that DPAs are only allowed through their specified second lien programs. This leads us naturally to broaden our investigation to consider those cases where new loans are delivered in tandem: a first or primary mortgage along with a second lien or “piggyback” mortgage. The Enterprises refer to these as “secondary” mortgages. The question of course is do we have the information necessary to assess the scope and performance of loans with accompanying seconds? Given that the GSEs disclose the CLTV as well as the OLTV of a loan, if the former is higher than the latter, we can consider it as a piggybacked loan. Grist for the Recursion mill. To start, we limit ourselves to purchase loans, and we look at the share of deliveries with accompanying second liens by agency: 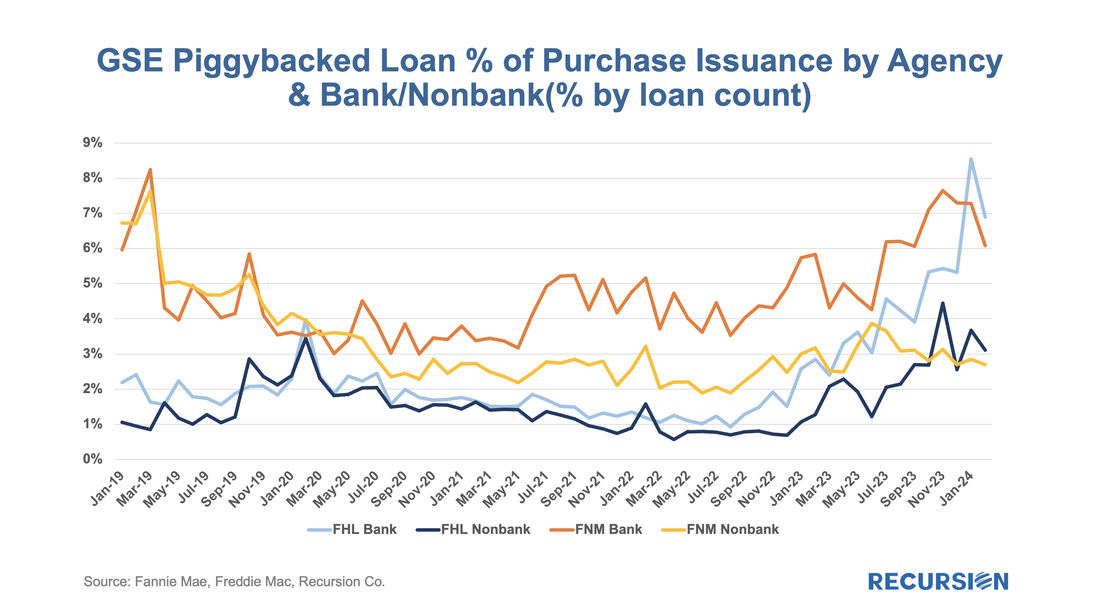 The recent release of pool-level buydown data led us to write a note contrasting the use of this product across Agencies, including Ginnie Mae[1]. In the process of writing this, we discovered that FHA, unlike the GSEs, also provides loan-level data for buydowns. This allowed us to run an analysis showing loan performance as measured by EPDs was better for FHA loans with buydowns than without, reflecting increased lender caution in using buydowns, which, on average, had higher credit scores than those without. The availability of loan-level data for FHA on this topic provides us with an opportunity to conduct an additional informative analysis specific to this program, which we document here. To start, let’s look at the share of the market with buydowns: 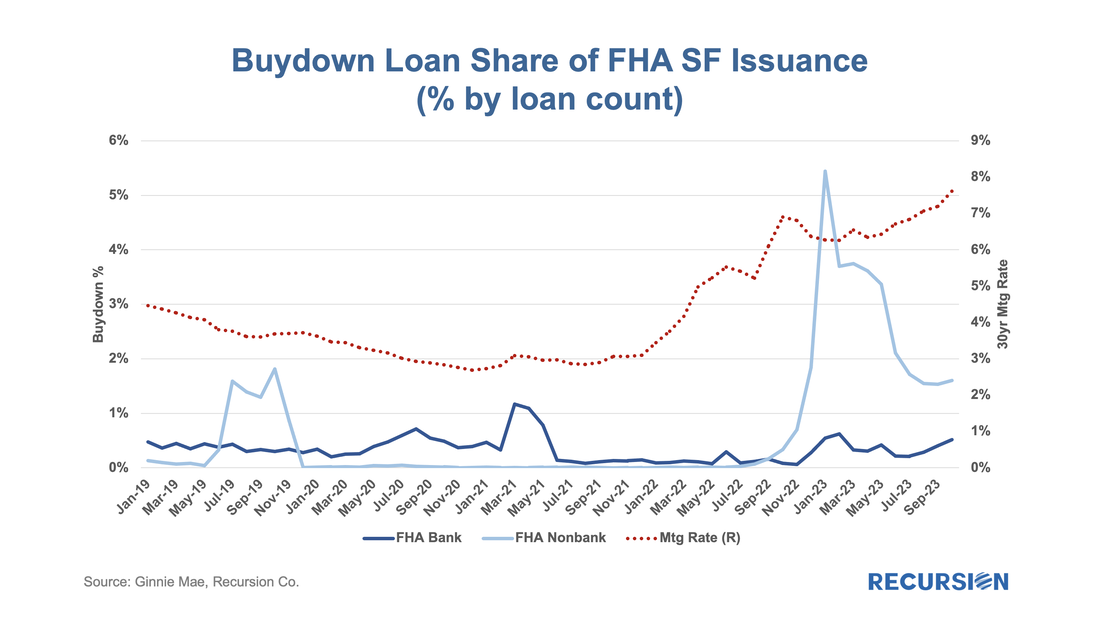 ...... 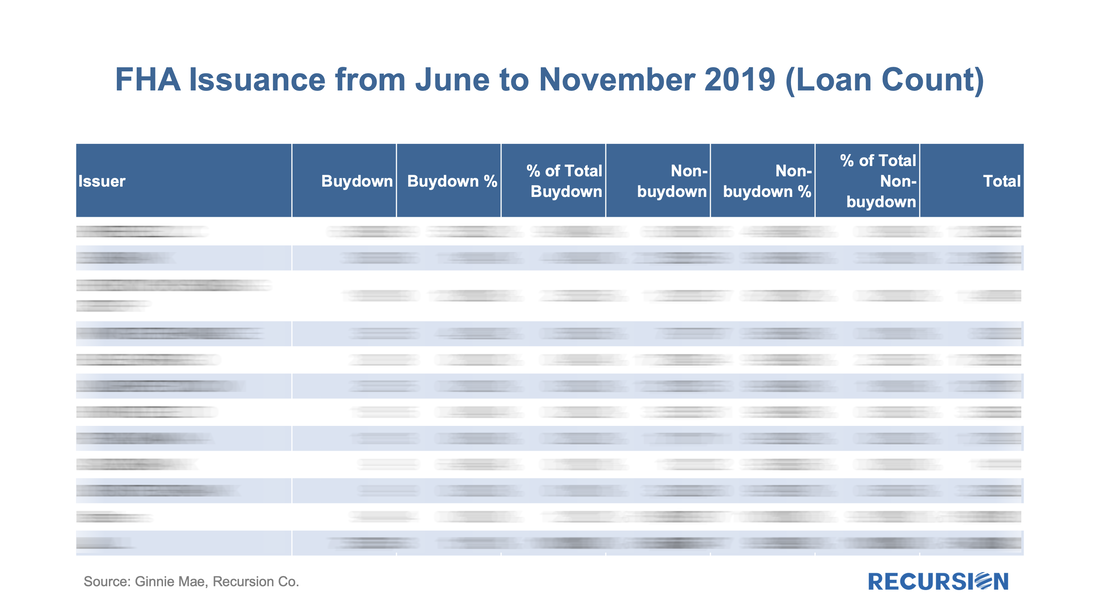 ...... 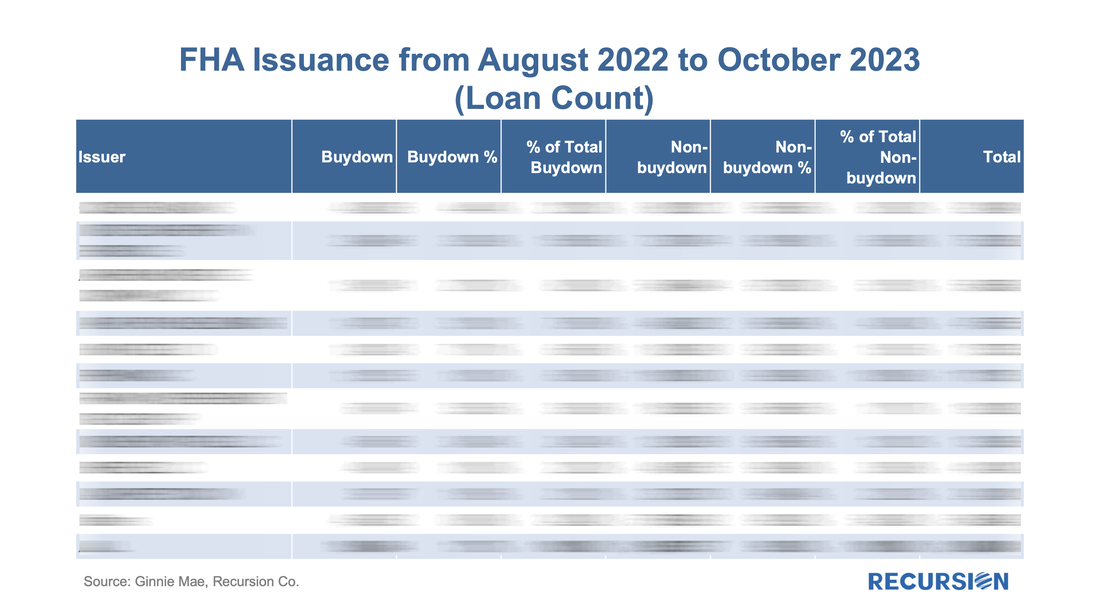 ...... 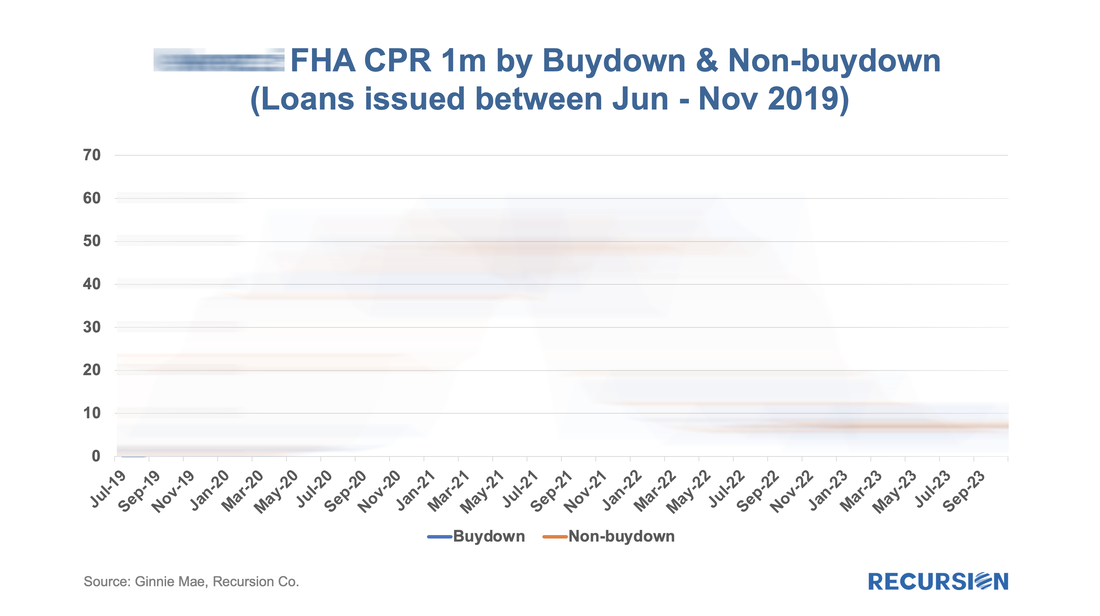 To read the full article, please send an email to [email protected] With home prices at record high levels and mortgage rates at their record highs since the turn of this century, it’s natural to ask if the housing market will be the source of new systemic risk. Over the past year, we have written extensively about “mortgage winter”, a condition where housing demand is held back because of affordability, while at the same time, supply is constrained by current homeowners who are locked into properties by mortgages with rates far below those available in the prevailing market. This is what economists would call a “bad equilibrium”, a state of great strains in the market that tends to persist. While the housing finance industry is under great duress, the spillover to the broader economy remains limited, as for example, the labor market has held up well despite soaring borrowing costs. Within housing, the notable good economic news is that the extraordinary surge in house prices in the wake of the Covid-19 pandemic has resulted in an astounding 50% surge in the value of homeowner’s equity in real estate since Q1 2020 to over $30 trillion. 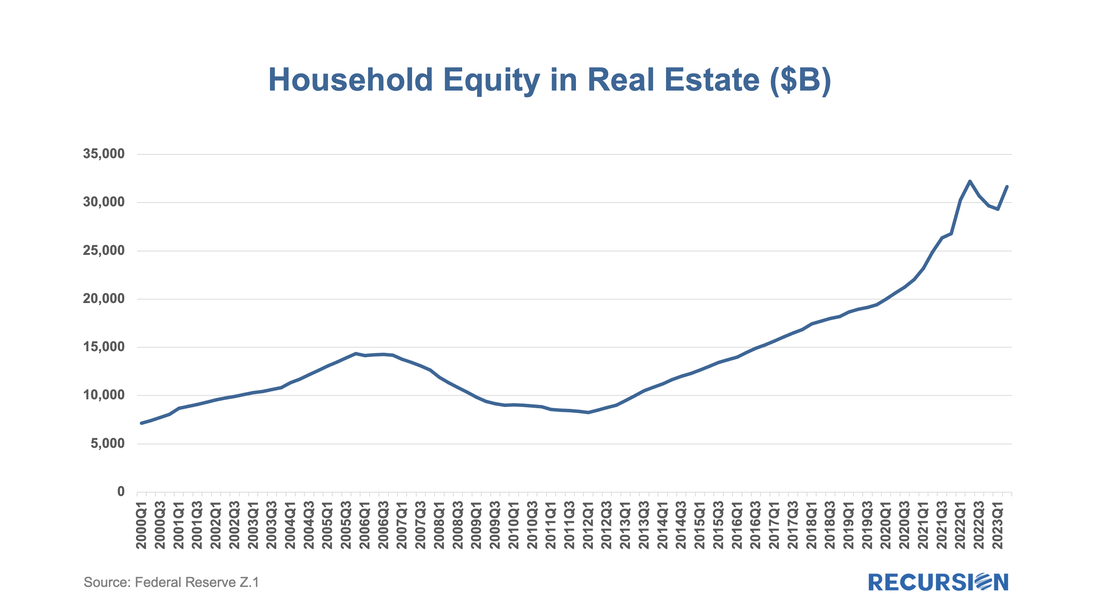 On June 29, 2023, both Fannie Mae and Freddie Mac announced enhancements to their MBS disclosures starting with the September monthly release[1]. The data covers active pools issued back to January 2022. As rates were quite low prior to this time, these disclosures cover the relevant period of high demand for buydowns: 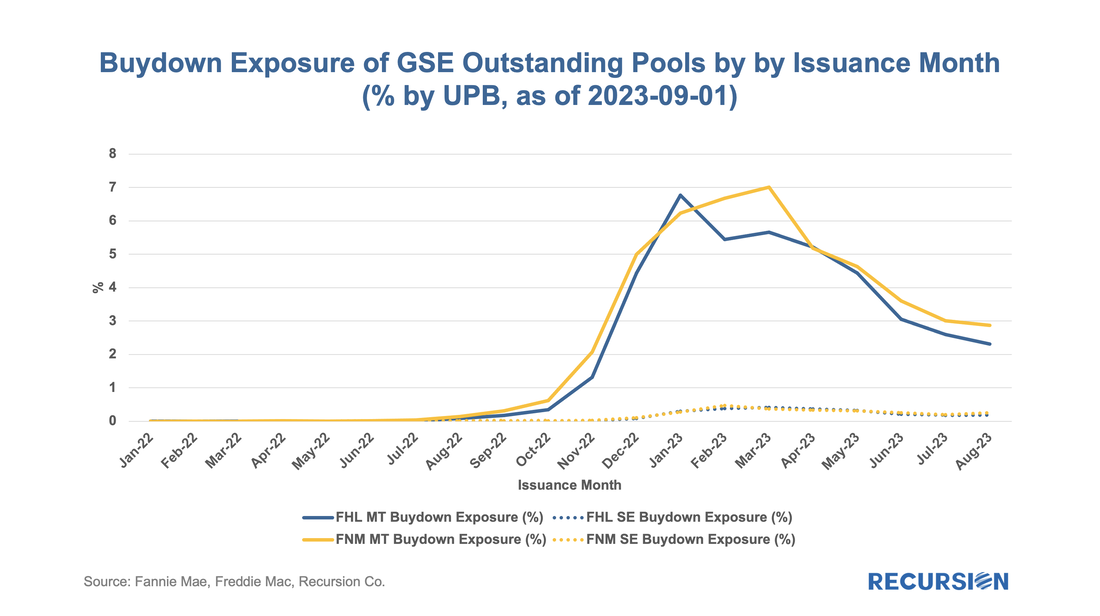 We get a lot of requests at Recursion, the bulk of which never make it to these posts, but one that struck home recently was from a regulator who asked what we know about Lahaina. Given the scope of this tragedy, we thought it worth the effort to talk about what we do and don’t have. Specific to that location, the answer is relatively limited. The Agency disclosure data is provided at the state level. The population of Lahaina was 12,700 as of the 2020 Census, out of a population of the Island (County) of Maui of 164,000 and 1.4 million for the state of Hawaii overall. So, this level of detail seems unlikely to be sufficiently granular to provide a basis for analysis. However, it seems we can take a bottom-up approach that may yield something of value. This would be based on the HMDA data. HMDA data has the advantage of granularity down to the census tract level. Out of over 84,000 Census Tracts, we can identify 6 for Lahaina. We can then pull-down originations from HMDA: 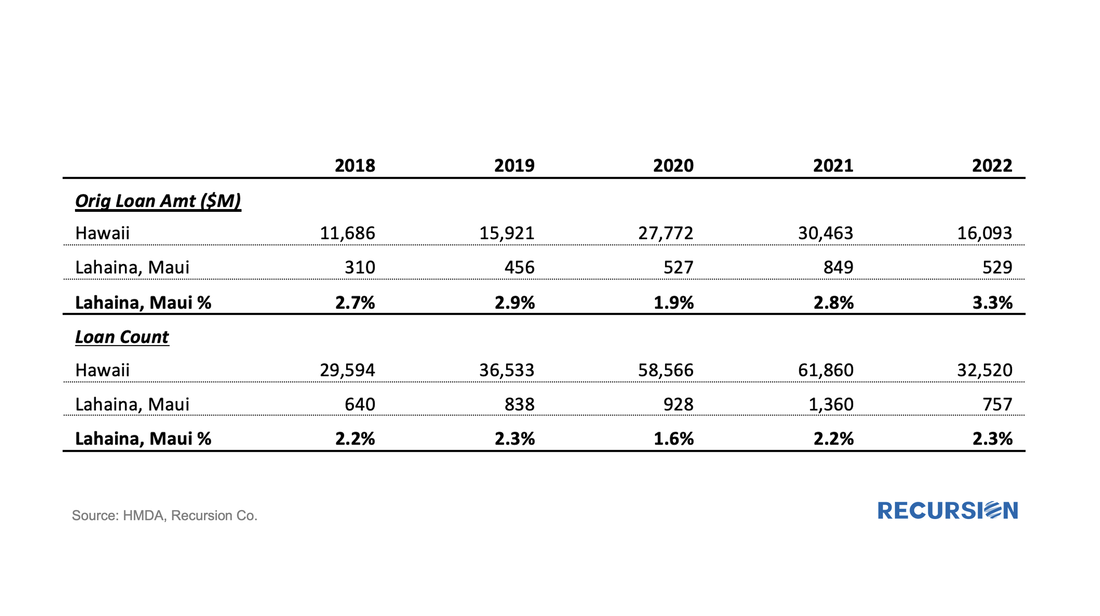 As we head into the end of summer, we note that the housing market remains locked into “Mortgage Winter”. Refinance activities are muted as mortgage rates are at a 22-year high. Even purchase mortgage applications are at the lowest level seen since 1995 as homeowners are not willing to give up their mortgages at historical low rates. It’s not hard to imagine that in such a world we will see new behaviors as mortgage lenders struggle to remain viable. PennyMac stood out as one of the more creative lenders that was able to refinance the mortgages it services, indicated by the following chart: 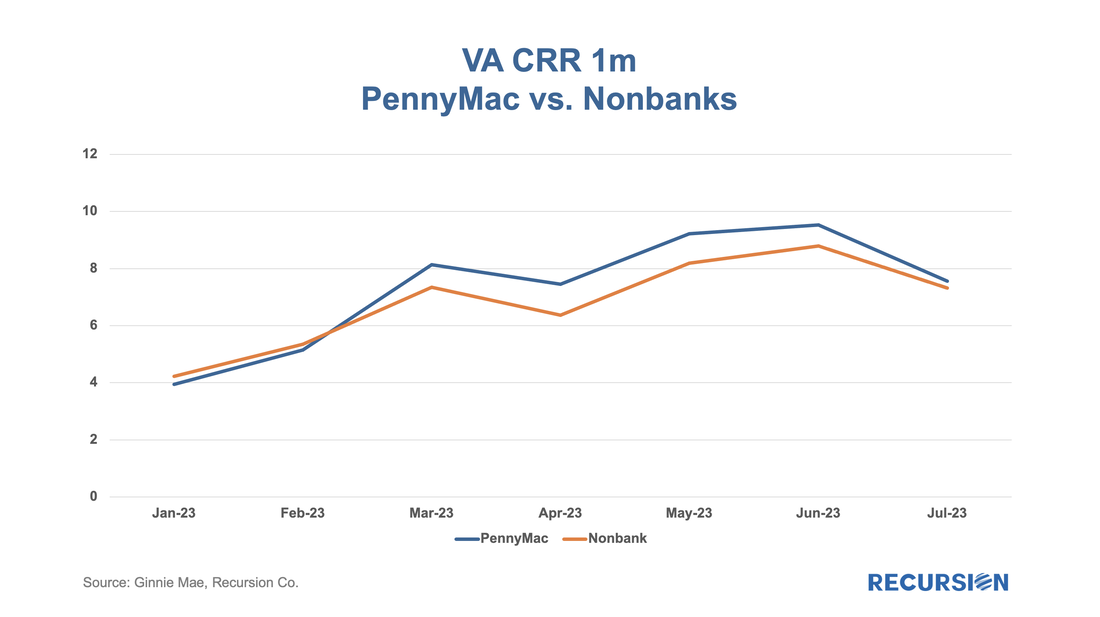 To read the full article, please send an email to [email protected]
|
Archives
July 2024
Tags
All
|
 RSS Feed
RECURSION |
|

Copyright © 2022 Recursion, Co. All rights reserved.