|
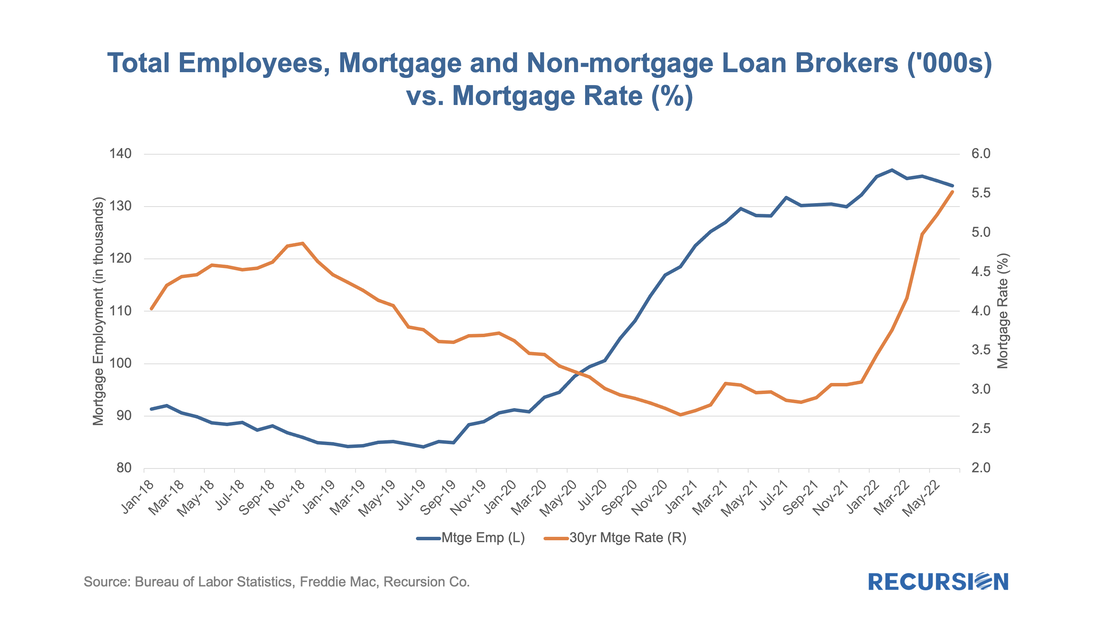
The rise in mortgage rates is having a profound impact on lender strategies in the mortgage market. These can be seen by looking at trends in the use of Third-Party Originators (TPOs). Some lenders, such as Quicken, traditionally work almost exclusively with loans originated in-house, while others, such as PennyMac, primarily accumulate and package loans produced by other lenders. Most larger institutions do some of both. The advantage of acquiring loans from a mortgage broker or correspondent in addition to origination is that the lender has flexibility regarding what method they use to turn volumes up and down to fit its strategy and market views. In both cases, there are costs to increasing and cutting capacity. As the market grows, bringing on new employees carries expenses such as training, while building trusted new external relationships can also be time-consuming. As markets contract, there are direct costs to layoffs, while unwinding networks can impact relationships that can be difficult to rebuild when the cycle turns. Of course, in a sufficiently bad market, the company may have no choice but to cut back.
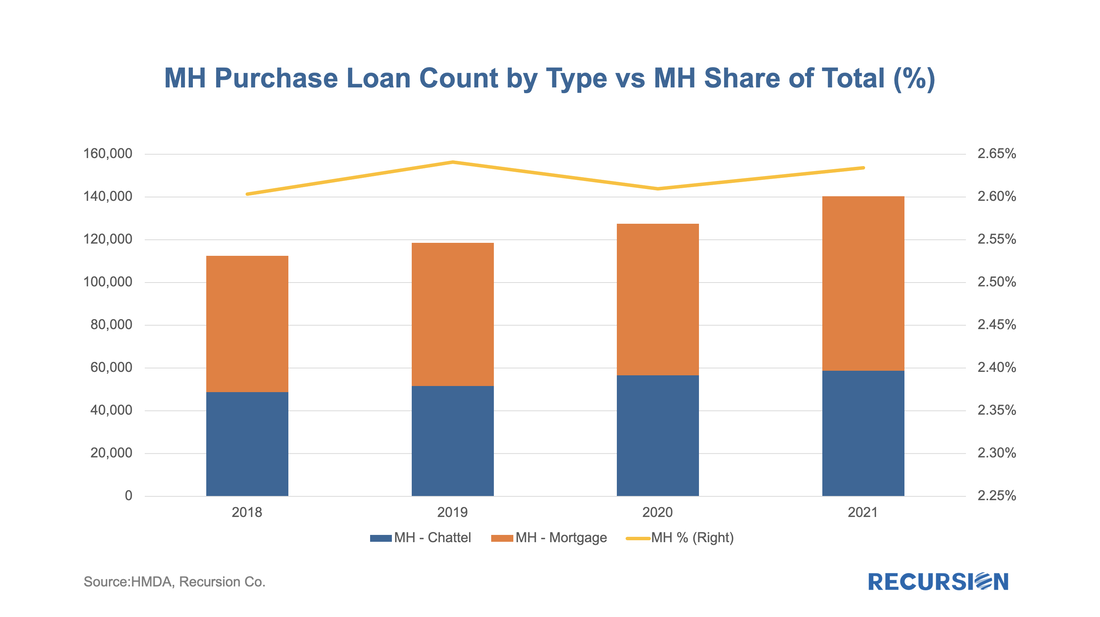
Recently there have been some high-profile announcements of layoffs across the mortgage lending space, but through the first half of 2022, the reported decline in employment has been modest. But employment tends to lag interest rates, so further declines cannot be ruled out. The release of 2021 HMDA data in March set off a familiar round of impactful analysis[1]. However, there are components that cannot be obtained unit the final release in July, including the important category of manufactured housing, a key piece of the policy discussion around affordable housing. Last year we dug into this topic[2] and it would be a good time to update this analysis with new information from the final 2021 release.
First of all, manufactured housing experienced a resurgence in 2021: A recent story regarding rent control published in the Commercial Mortgage Alert “Regulatory Roundup” stated that “Rent Control is back in vogue with many state and city lawmakers, putting lenders and investors on high alert.” Using innovative journalistic techniques, the story went on to look at the impact on lending in the Minneapolis St. Paul MSA following a vote by the citizens of St. Paul in November 2021 that capped rent increases at 3% per year. Citing Recursion data, the story went on to state that lending in the MSA fell by 31% from the end of November 2021 through Q1 2022 from the prior year period in the Fannie Mae DUS program. This compares to a 9% drop in the US total. Recursion is proud to provide high-quality, timely information to both public and private sector decision-makers regarding these important policy issues. The article can be found on the Commercial Mortgage Alert website (paywall).
If you would like a copy of the article, please reach out to [email protected]. Analyzing trends in market performance requires two things, 1) a lot of data, and, 2) a deep understanding of the structure of markets. We recently came across a good example of this with relative delinquency rates between GNM and GSE pools[1]. In this post, we look at the dynamics of the two categories of reperforming mortgage loans.
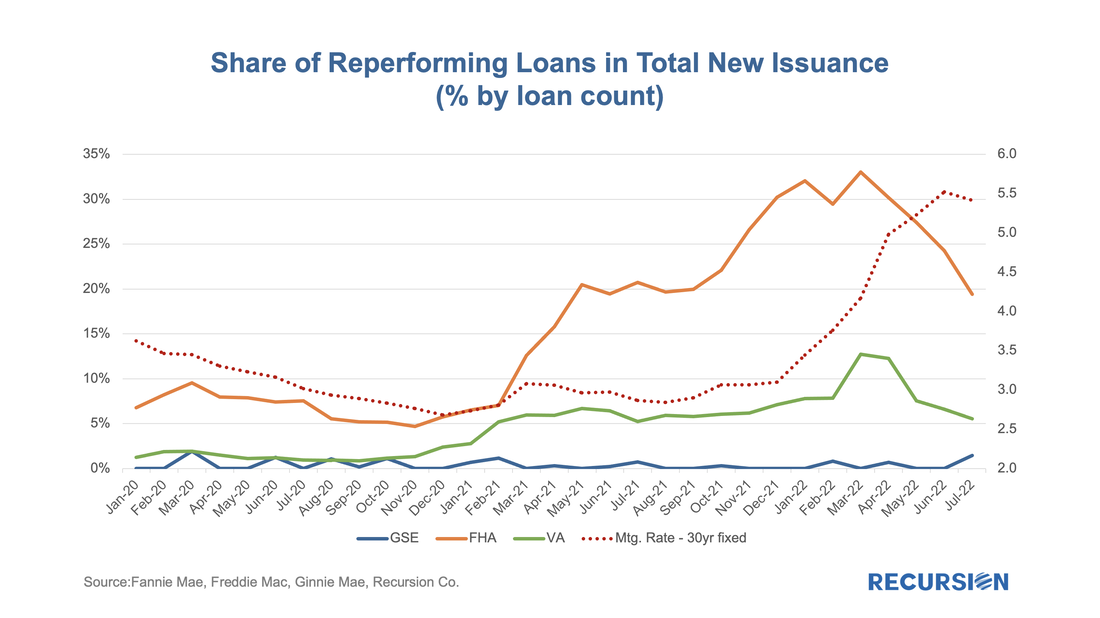
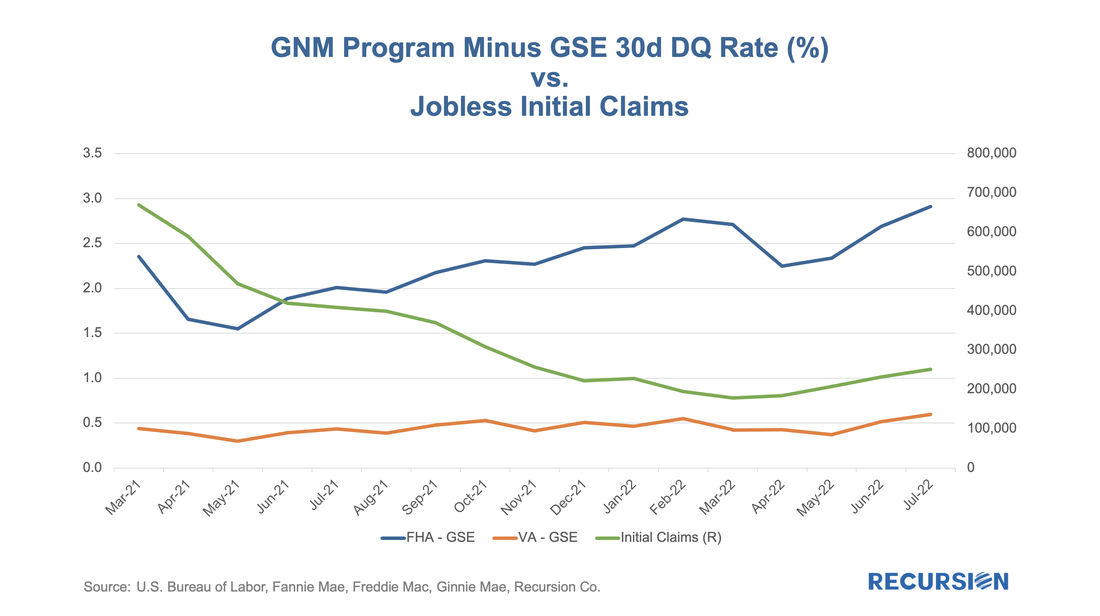
Investors have spent many years building models of prepayment speeds for mortgage pools based on a variety of characteristics such as loan size and underwriting characteristics. However, institutional factors can come into play as well. One that comes to mind is the difference in program structure between conventional and government loans. For the conforming market, the issuer is a GSE, while for government programs, it is the servicer. In both categories, when a loan becomes seriously delinquent, it can be bought out of the pool at par, amounting to a prepayment. The difference is that for the case of conforming loans, it is the quasi-public GSEs that perform this function, while for government programs, the decision is up to private sector entities. In the first case, there are overarching policy goals that weigh on decisions about the disposition of loans in delinquency, while in the second case, these decisions are based on financial considerations. One way to test this is to look at buyouts over the interest rate cycle. Below find a chart containing the shares of reperforming loans in new issuance for FHA, VA and the GSEs. These are loans that have been previously bought out of pools and then reissued into new pools. There can be a substantial lag between the buyout and re-issuance. In a recent HousingWire article[1] regarding an innovative MSR securitization offered by Freedom Mortgage, the author stated “As of the end of June, according to mortgage-analytics firm Recursion, Freedom Mortgage ranked as the sixth largest all-agency mortgage servicer in the country, with a 4.6% market share and some $380.3 billion in agency loans serviced. It ranked as the top servicer of Ginnie Mae loans, however, with a 12.5% market share and some $256.6 billion in loans serviced, according to Recursion’s data.” We are proud to be cited as the leading provider of servicer data to the mortgage market. This data is used by investors, mortgage traders and the servicers themselves to obtain an accurate overview of the servicing landscape. Recursion data and analytics provide essential insights and productivity enhancements essential to thriving in a challenging environment. [1] https://www.housingwire.com/articles/freedom-mortgage-launches-msr-backed-private-label-offering/ Recursion is a preeminent provider of data and analytics in the mortgage industry. Please contact us if you have any questions about the underlying data referenced in this article. There has been a modest but persistent widening of the gap in 1-month DQ rates between the Ginnie Mae programs and the GSEs over the past couple of years. Previously, our experience was that these are mostly driven by developments in the labor market[1]. In fact, there has been a recent small but persistent rise in the number of initial jobless claims that correlates with this widening:
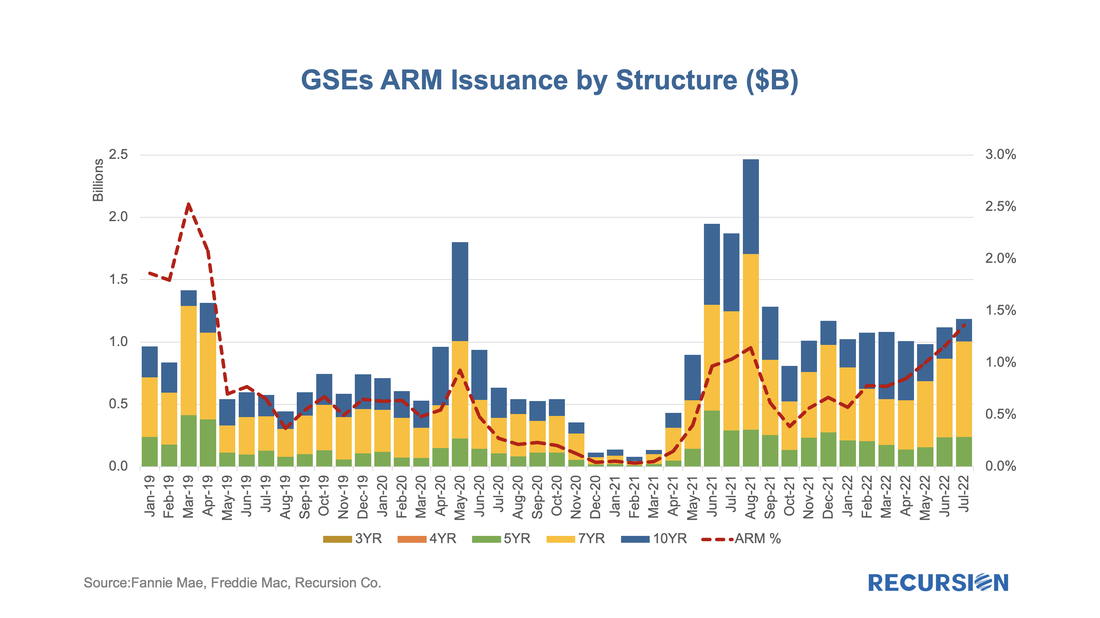
With interest rates significantly higher than those in place at the start of the year, it’s natural that potential homebuyers look for ways to reduce borrowing costs. One of these ways is through an adjustable-rate mortgage (ARM). Now that we have complete data for July, it is a timely moment to look at recent trends in ARM issuance. As we approach the topic, it’s important to note a few institutional points. First, the ARM programs available to conventional and Government borrowers are distinct, so we break the issuance down between GSE and Ginnie pools. Second, the market underwent a significant shift with the elimination of LIBOR as a benchmark[1].
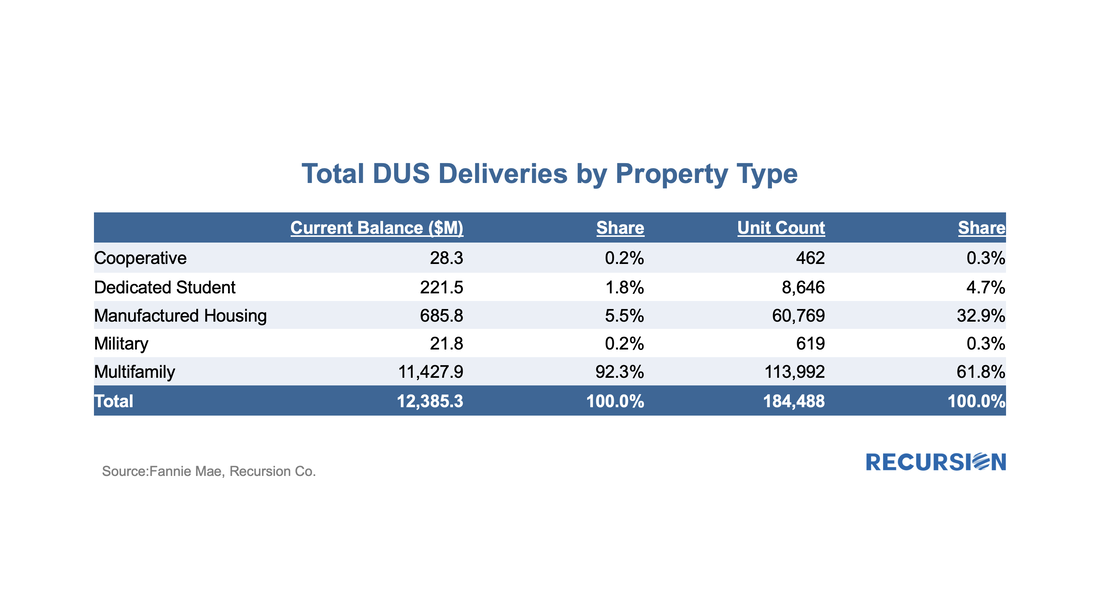
Let’s start with the conforming market. There are several product types, but in July 2022, the largest is 7-year ARMs, followed by 5-year and 10-year ARMs: In early May, Fannie Mae announced that its disclosures for its multifamily DUS program to include expanded social information, notably Area Median Income (AMI), went live[1]. With the June release, we now have data for two months, a summary of which is found below:
To begin, we look at the big picture of new loans issued within the DUS program for May and June combined. (All data will be presented this way unless otherwise specified.) |
Archives
July 2024
Tags
All
|
RECURSION |
|
Copyright © 2022 Recursion, Co. All rights reserved.


 RSS Feed
