|
There is a natural tendency to think about housing finance in a bifurcated manner: single- and multifamily. But this distinction is hardly clear. For a long time, we’ve had condos and coops, and more recently new esoteric property types like buy-to-rent. The mechanics are quite distinct but, in each case, we are talking about debt and equity, borrowers and lenders and servicers. But mostly we are talking about places to live. In scaling the two types of residences, we normally look at dollar amounts. From the Federal Reserve Z1 data[1], we can see that Agency single-family debt outstanding stood at $9.038 trillion in Q4 2023 while multifamily just crossed the trillion-dollar threshold at $1.002 trillion, giving a ratio of 9.02. Single-family dominates. In terms of the agency share of these markets, we have:  The single-family agency MBS market benefits from a set of consistent standards that allows traders and analysts to make straightforward judgments about relative value between securities. This is particularly the case for the conforming mortgage market since the single security UMBS market was launched in June 2019. The result is a market that is very liquid, supporting homeownership and affordability. There is a very different situation in the multifamily space. The programs are very distinct across, and even within Agencies. This is particularly the case for the Ginnie Mae program, which consists of construction loans that are lines of credit that are drawn upon, and then converted to project loans. The two largest programs within the GSE multifamily space are the Fannie Mae DUS program[1], where losses are shared between Fannie Mae and the underwriting banks, and the Freddie K-deals, where losses are shared with investors[2]. Both Agencies have numerous smaller programs as well with their own distinct characteristics. In the single-family space, the unit of analysis is the mortgage. These are pooled, and pools and loans are sometimes, in turn, aggregated into CMOs (We classify highly-structured deals such as Freddie K, Q, ML, SB, etc., as CMOs, too). Investors have a complete picture of activity in this market. In the multifamily space, however, the picture is murkier. There are two reasons for this. First is the multitude of different programs across the Agencies as cited above. The second is that a consistent data set for multifamily loans across the three agencies is not easily produced, as loans are typically securitized into pools, however, Freddie tends to securitize loans directly into structures more like CMOs, such as Freddie K, Q, SBL programs[3]. A year ago, we posted a note that described our bottom-up approach to sizing the multifamily market and validated this by comparing our calculation to similar figures obtained from the Federal Reserve Z.1 report. We are pleased to report that this approach continues to provide an accurate picture of total market size as our figures for the third quarter have consistently aligned within a margin of 0.5% for the past three years. 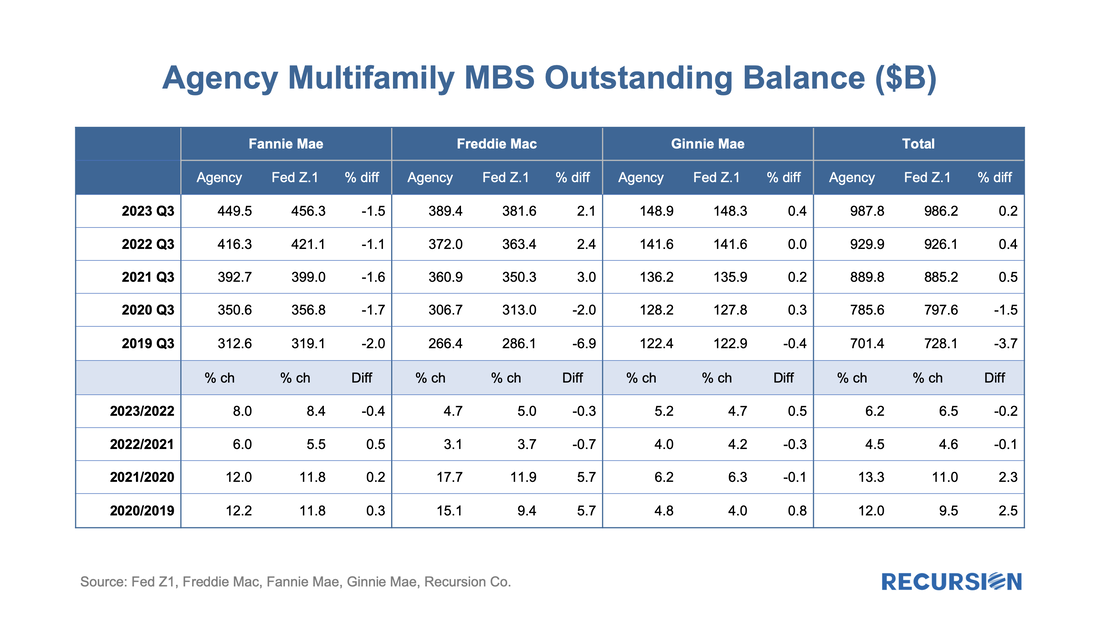 In a recent post, we discussed trends in commercial real estate outstanding debt, with an emphasis on the Agency multifamily market[1]. We mentioned that the key difference between risk sources associated with multi- and single-family debt is that the I/O structure and balloon term that predominates in multifamily loans implies that there is significant refinance risk in this market. We also previously wrote that we have collected all the loans in the major Agency multifamily books and verified that this data was consistent with the Federal Reserve’s Z.1 report[2]. We are now prepared to take some first steps at estimating the extent of this risk. To simplify things, in this note, we look just at the two major GSE multifamily programs, Freddie Mae DUS[3] and Freddie Mac K-deals[4]. To begin, as of August 1, 2023, the Fannie Mae DUS deals account for $384.5 bn or 86% of the total FNM book of $448.1 bn, while Freddie K deals account for $317.9 bn or 83% of $384.9 bn outstanding as of June 1, 2023. Superficially similar. Below find the maturities for the two programs by year starting in June 2023 for Freddie Mac and August 2023 for Fannie Mae[5]: 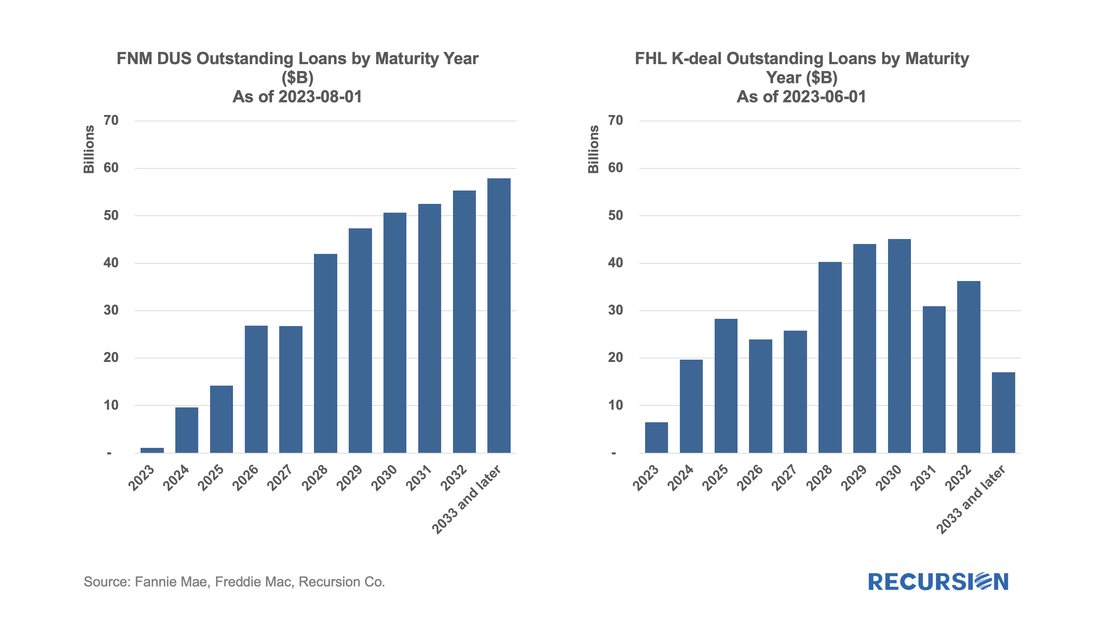 On September 15, Recursion Data was cited in a story in Commercial Mortgage Alert that pointed out that Fannie Mae “has started to restrict the interest-only payment periods on debt backing properties built before 2000.” They cite Recursion data in pointing out that Fannie Mae purchased $4.2 bn in multifamily loans in August, bringing the year-to-date total to 35.3 billion, down 20% from the same period in 2022.
Recursion is pleased to provide excellent support to all participants in this crucial segment of the commercial real estate market. In a recent post, we discussed trends in the ownership of risk in the single family residential real estate market[1]. In this note, we round the picture out with an analysis of the commercial real estate market. 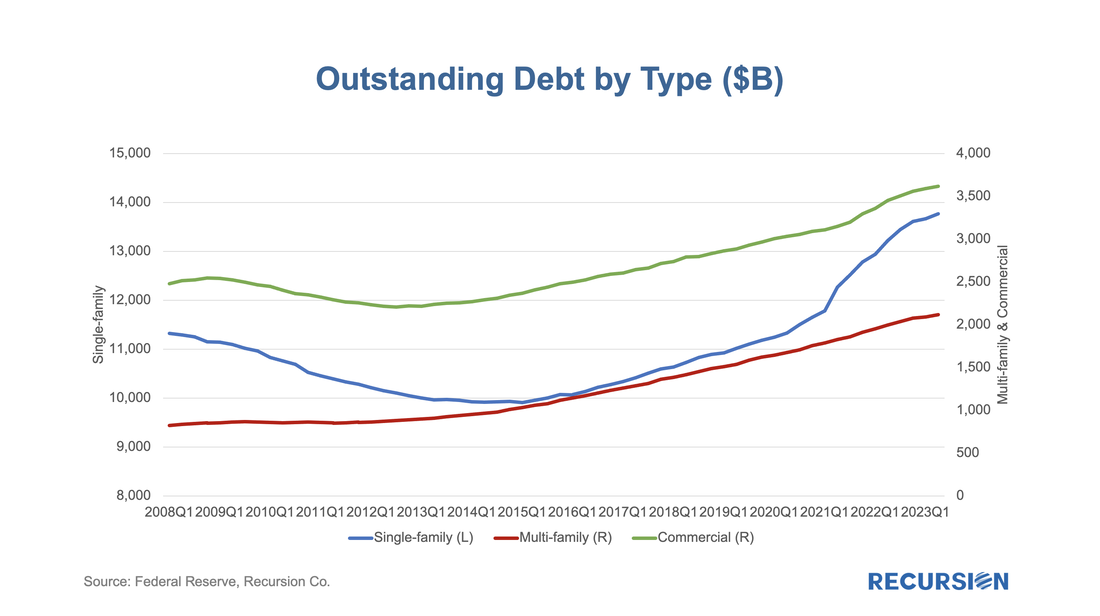 Introducing the Recursion Agency Multifamily Dataset Part 2: Outstanding Balance Benchmarking3/20/2023
In a recent post, we introduced the Recursion Agency Multifamily Dataset, a complete accounting of multifamily loans securitized in Agency pools, going back to 2009. We provided a breakdown of issuance for the total market and by agency in that post. A natural question that arises is how can we benchmark our new dataset? In this case, we look at outstanding balance rather than issuance volume. The Agencies provide quarterly data on total outstanding balances on their web sites. When we compare this to our own data, we get this:  To read the full article, please send an email to [email protected] Over the past 18 months, Recursion has undertaken an extensive effort to aggregate multifamily loans and properties across all three Agencies by Deal Type. The data is complete back to 2009 for all three Agencies and somewhat longer for individual deal types. This allows us to aggregate the loans to the pool and then CMO levels for in-depth analysis. An innovation is that we have tied the loans to the property level, giving us the ability to perform analyses on a wide variety of topics, including ESG considerations and much more[1]. For this note, we will provide a basic overview of the dataset. Here is the topmost view from the Agency level:  To read the full article, please send an email to [email protected] Recursion has undertaken an intensive effort to compute the size of the Agency CMO market back to 2000. The size of the Agency CMO market is calculated by building up from the loan level. This data is provided by agency disclosure of the portfolio of each collateral group and collected from text files, pdfs, and other formats across single-family and multifamily CMOs. The formats of the disclosure files differed across agencies and changed over time, presenting a challenge to unify. 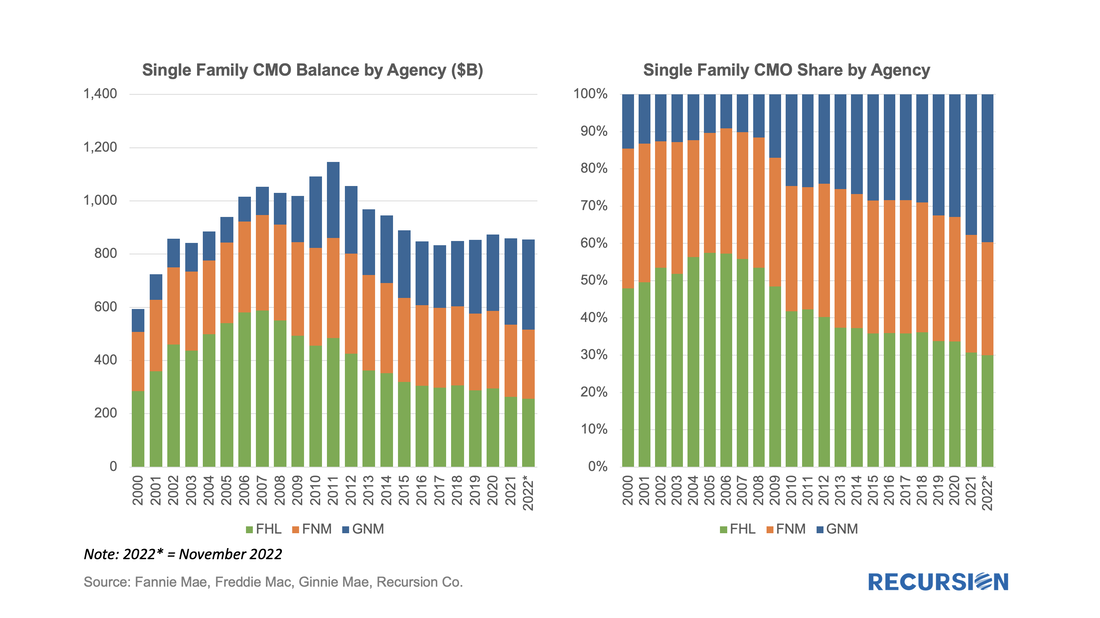 To read the full article, please send an email to [email protected] |
Archives
July 2024
Tags
All
|
 RSS Feed
RECURSION |
|

Copyright © 2022 Recursion, Co. All rights reserved.