|
In early May, Fannie Mae announced that its disclosures for its multifamily DUS program to include expanded social information, notably Area Median Income (AMI), went live[1]. With the June release, we now have data for two months, a summary of which is found below: To begin, we look at the big picture of new loans issued within the DUS program for May and June combined. (All data will be presented this way unless otherwise specified.) 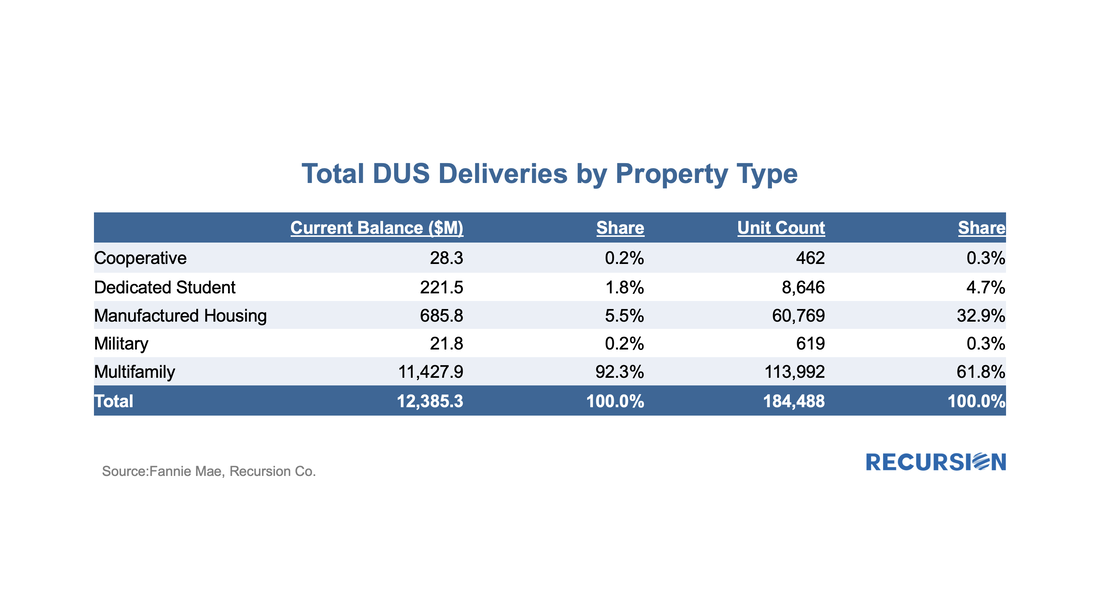 On May 25, 2022, Ginnie Mae announced that starting on June 8 it would enhance its pool and loan-level multifamily disclosures through the addition of an Affordable Status Field[1]. This field marks every FHA loan in pools with a Ginnie Mae guarantee as:
We received this data on the 6th business evening, and below find some summary descriptions: 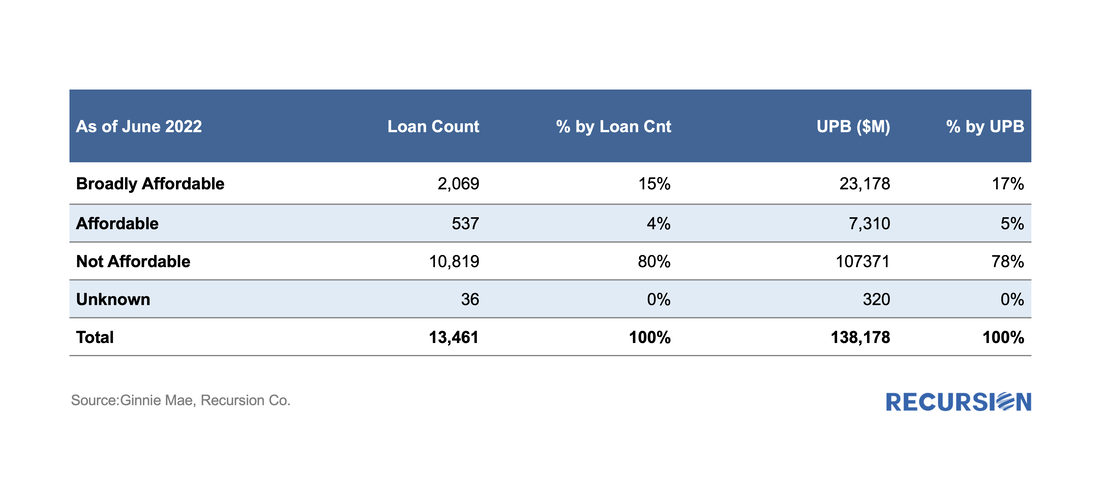 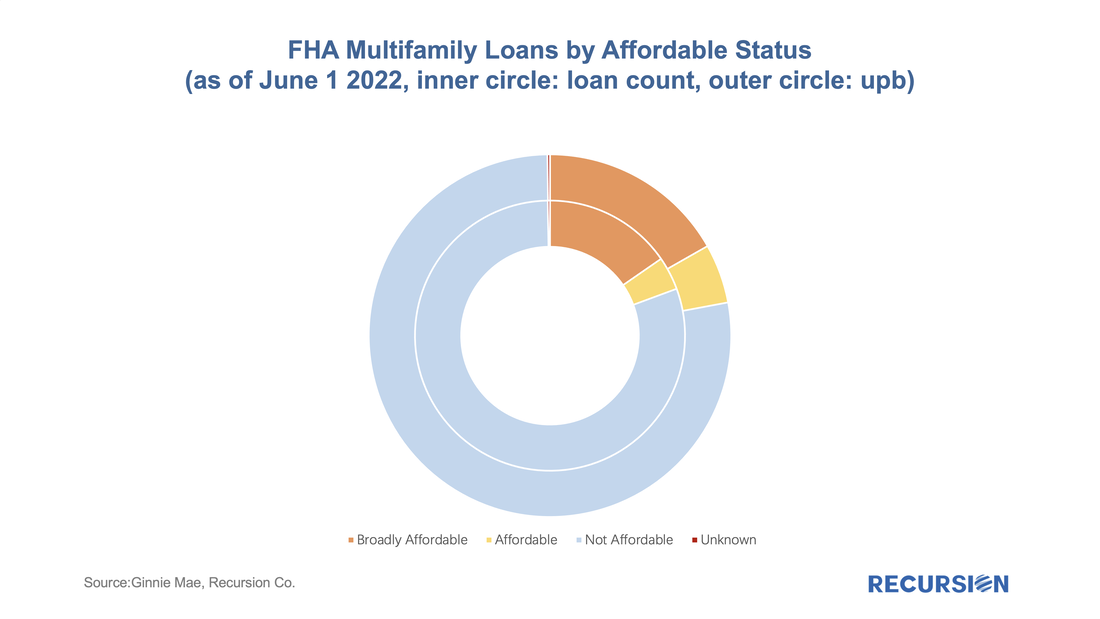 On March 24, the CFPB released HMDA data for 2021[1], with results obtained from 4,316 reporters, little changed from 4,472 reporters in 2020, but well below the 5,505 respondents reached in 2019[2]. There are yet more companies are expected to report to 2021 HMDA. However, our experience from previous year indicates little change in big picture when reporting is finalized. The drop reported in the number of reporters in 2020 vs 2019 is largely due to a reduction in the number of loans that a bank needed to underwrite, requiring a report to be filed starting in 2020. This data is used for market sizing by regulators and market participants, but it also represents a treasure trove of information regarding lender and consumer behavior across a wide variety of economic and market regimes. 2021 was notable for being the second year of the Covid-19 pandemic, which is associated with expansive monetary and fiscal policies and surging house prices. This report will briefly assess trends across a variety of topics. Market Activity After surging by 47% in 2020 to 24.8 million from 2019, the number of loan activities reported in 2021 HMDA ticked up by just 2% to 25.2 million, almost 40% below the record high 41.5 million attained in 2003. Similarly, the number of loans originated reported in 2020 jumped by 57% from the prior year to 14.2 million, while in 2021 the figure rose by only 3% to 14.6 million, down by about one-third from the 2003 peak of 21.4 million. 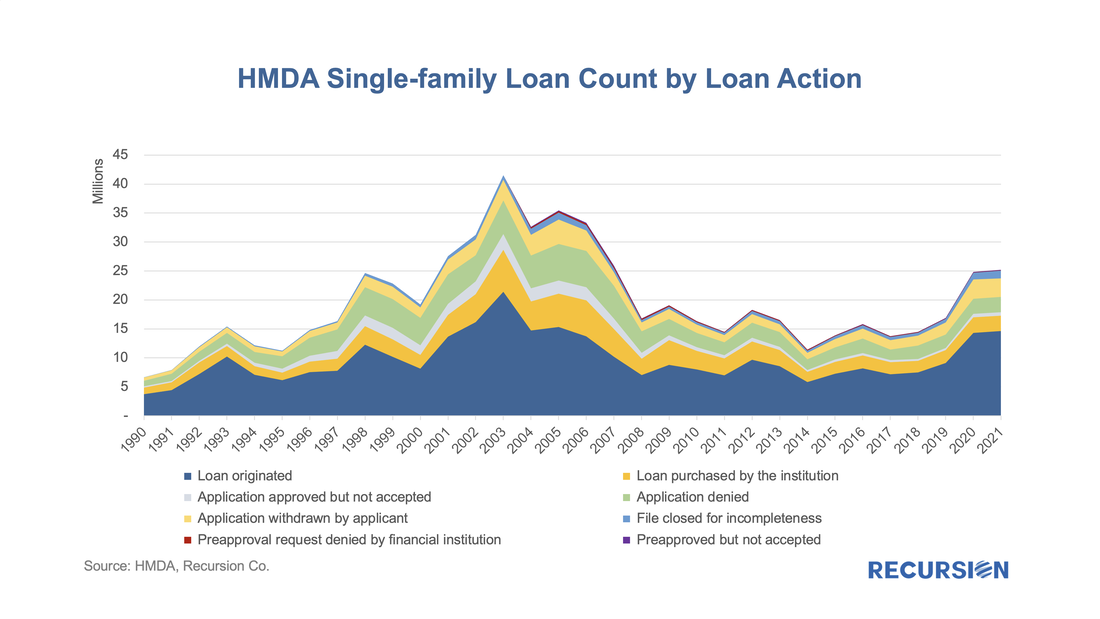 While surging house prices continue to be the focus of market participants, the rental market is increasingly attracting the attention of policymakers, both because of the impact on inflation[1] and the importance of this market for the economic wellbeing of lower-income households[2]. In both cases, there is a widespread consensus regarding the need for new supply to ameliorate these problems. There are many factors that come into play regarding the construction of new rental units, including the availability of private and public sources of credit. As part of its quarterly release of the "Financial Accounts of the United States"[3], the Federal Reserve publishes data that allows us to break down the trend in total multifamily lending into major categories of credit risk holders: 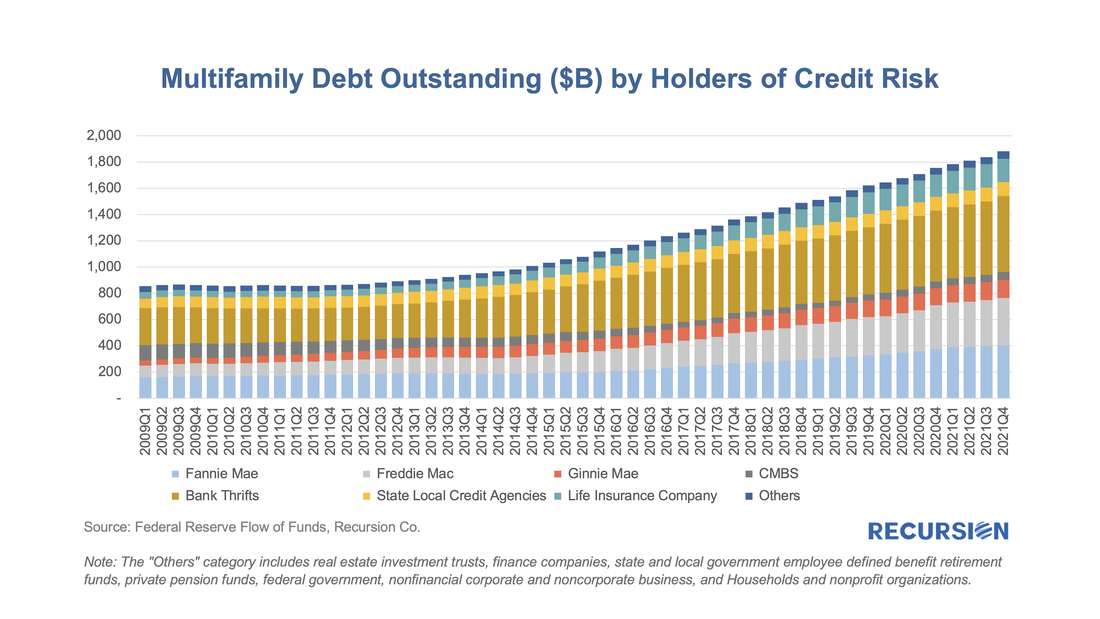 On February 15, 2022, Ginnie Mae announced it was adding a “Green Status” field to its multifamily disclosures, “giving investors information that supports their sustainable investing decisions and solutions.”[1] Specifically, “The new securities disclosure allows investors to easily identify multifamily mortgage-backed securities whose collateral meets the requirements of FHA’s Multifamily “Green” Environmental Product Programs. This will assist investors in acquiring suitable investments to meet their ESG mandates and improve the liquidity of the securities in the secondary trading to other ESG investors.” There are several broad observations that can be immediately taken from the new disclosure. First, Green loans tend to be larger than others. As of February 2022, over 12% of loans in Ginnie Mae multi-family pools by loan count contain the green flag, accounting for almost 28% of UPB. As a result, green loans stand about twice as big as those which do not fall in this category. The bulk of these units are market rate apartments meeting the Green building requirements or loans in the affordability categories accounting for less than 1% of both total outstanding loan count and UPB. 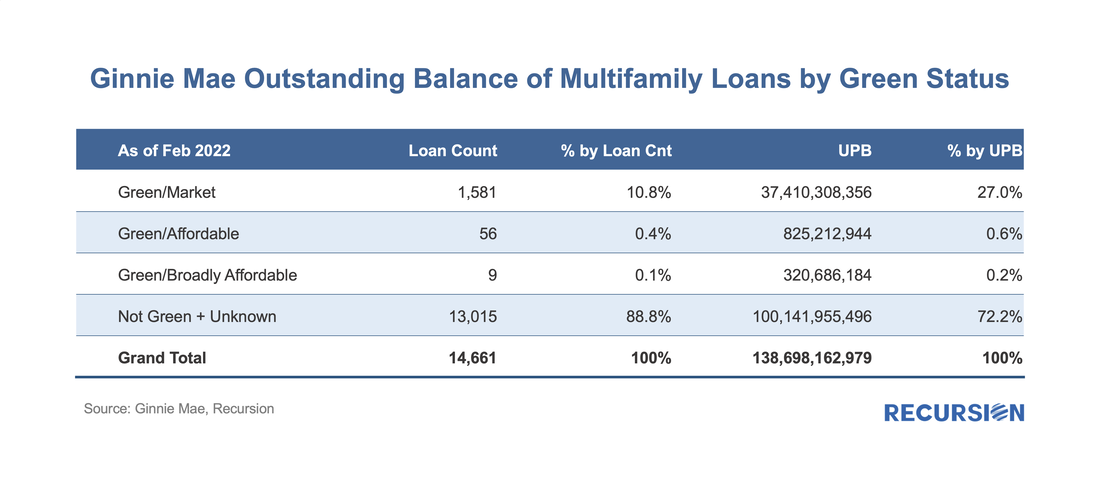 With home prices and interest rates on the rise, policy focus becomes more clearly fixed on the subject of affordability. This is particularly true for renter households, which tend to have lower incomes than is the case for homeowning households. As a result, Recursion is in the process of upgrading its capabilities in this area, through its Multifamily Analyzer. A recent upgrade is the addition of payoff volumes for GNM multifamily programs, in addition to the new issuance volumes already in place. This provides a sense of how much of the total volume is due to expiring loans, and how much to new activity. 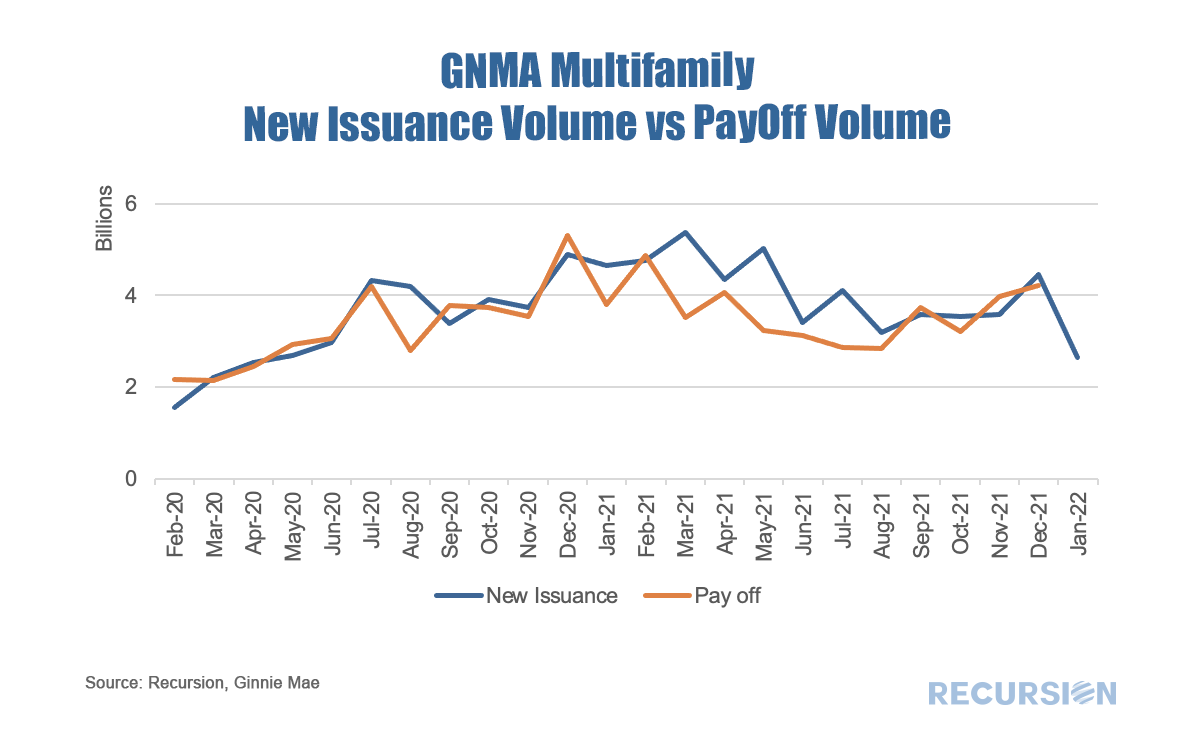 We have commented previously about housing and the “K-shaped Recovery”[1] in which home prices are booming but rent increases are decelerating. This dichotomy is highly unusual but reflects the flight of households out of dense urban environments due to the Covid-19 pandemic. With rents decelerating, it is not surprising that starts of new multifamily units have been in a trend decline over the past year. 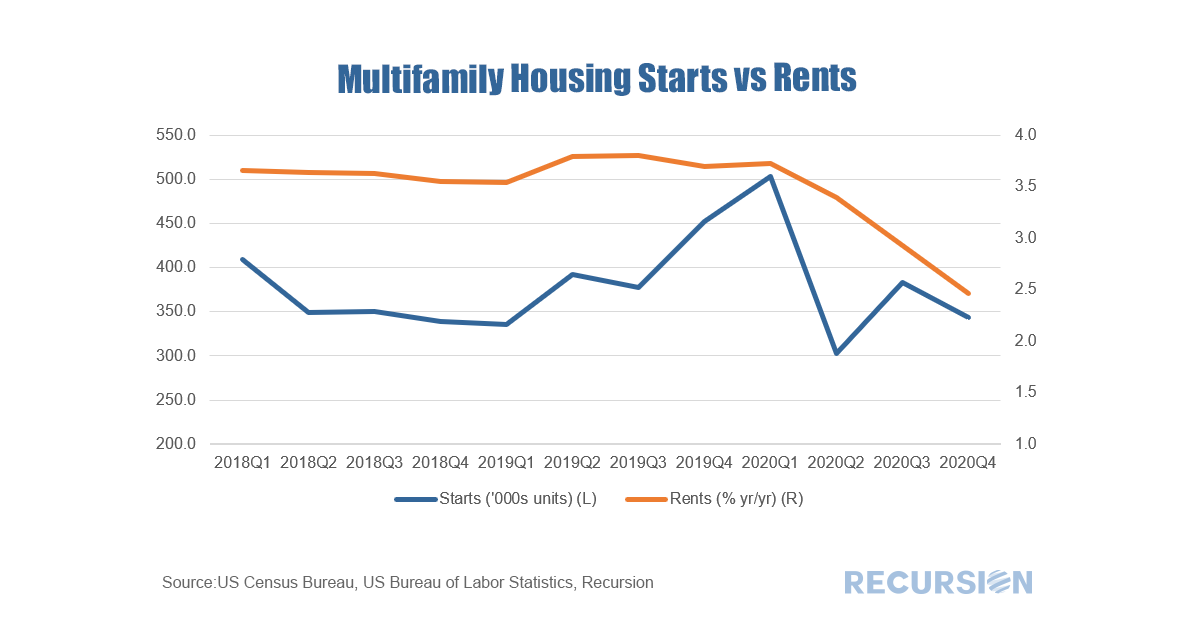 In prior posts, we commented on trends in the distribution of risk in the mortgage markets of single-family residential[1] and multifamily markets[2] from the Federal Reserve Z.1 data. This note takes a look at the commercial mortgage market[3] in a similar fashion. Other than the multi-family category, commercial mortgage for properties such as office, retail, hospitality etc is not normally in our wheelhouse at Recursion, but insofar as it is a substitute as an investment vehicle for the residential markets it is useful to take a look at trends here. Commercial mortgages (excluding multifamily) are exposed to unique risk due to COVID-19, as it is very likely offices, hotels and shopping malls will never to able to achieve the same occupancy rate as before the pandemic. 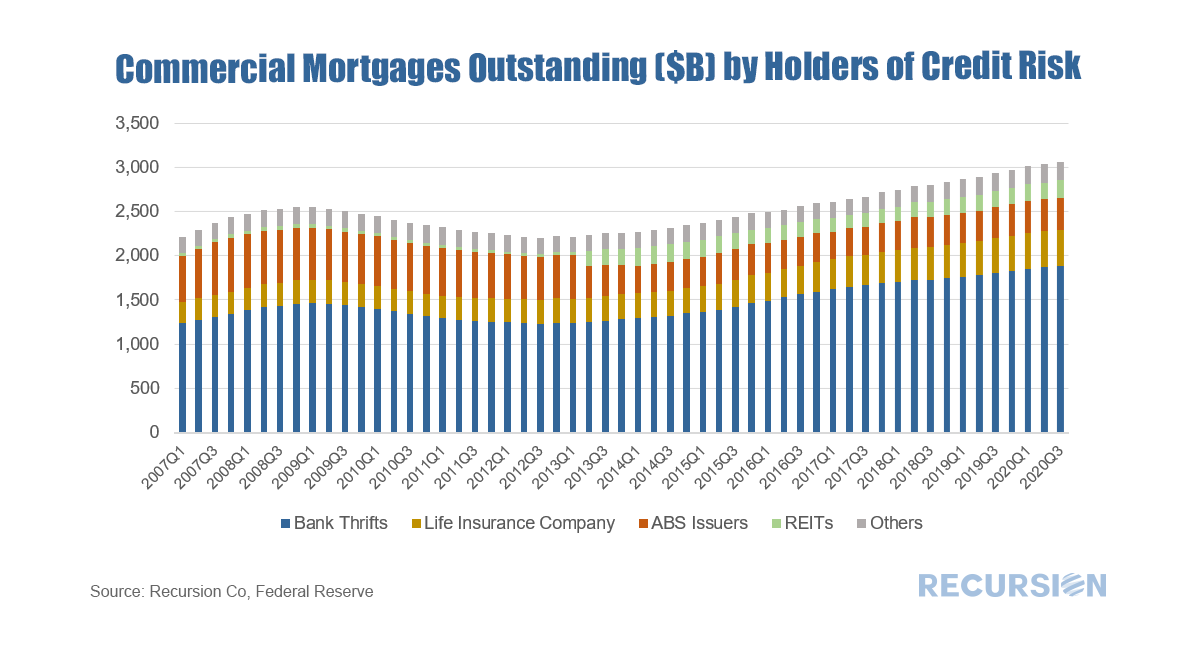 The commercial mortgages(excluding multifamily) outstanding crossed the $3 trillion threshold in Q1 2020. Of interest is that the dominant holder of this risk is banks and thrifts. Their share has been in a narrow 1% range between 61.4% and 62.5% over the past four years[4]. This observation leads naturally to the question of bank holdings across the residential and commercial categories: 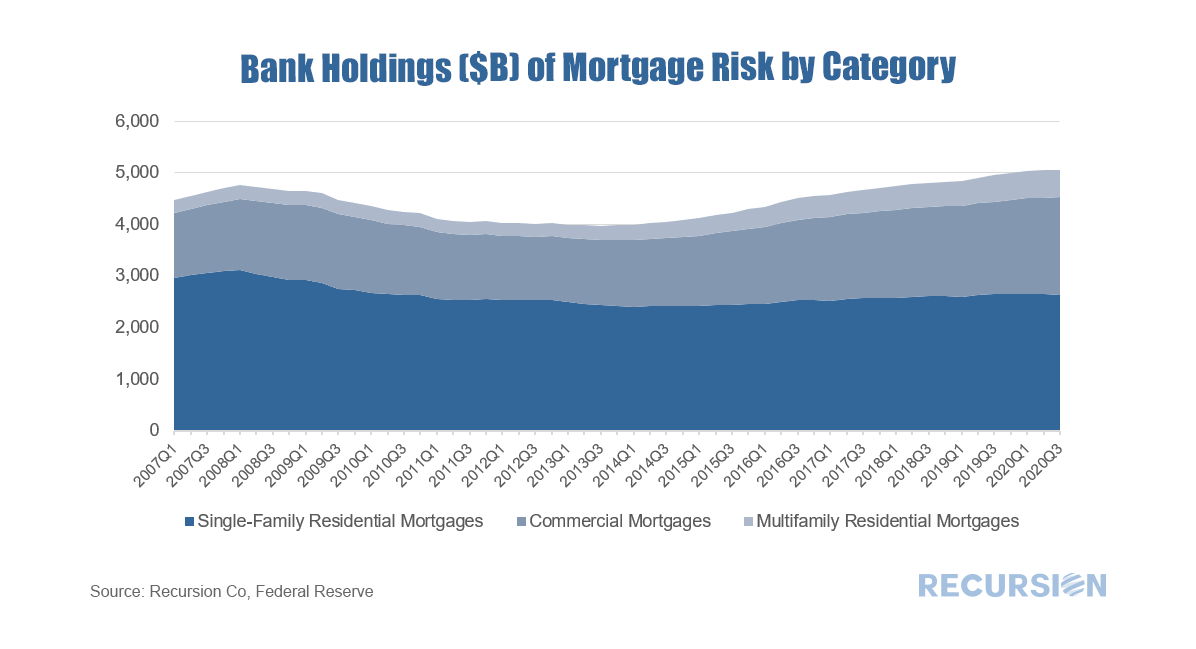 What is interesting is the steady drop in the share of single-family mortgages held on bank balance sheets over the past dozen years by about 1% per year (currently 52.1%). [5]The impact of Covid-19 on this trend appears to be quite small. Both multifamily and commercial mortgages have gained shares. It’s worth noting that banks hold sizable amounts of single-family MBS in addition to loans, on the order of $2.9 trillion [6] in Q3 2020. In this case, the agencies hold the credit risk, not the banks. There is ample room for banks to boost their holdings of residential loans, one more item to watch in the transition year 2021. [1] https://www.recursionco.com/blog/that-was-then
[2] https://www.recursionco.com/blog/big-data-and-the-multifamily-market [3] Also called “nonfarm, nonresidential” in the Federal Reserve Z.1 data [4] From Q4 2016 – Q3 2020 [5] The denominator of calculation only banks’ holdings of single-family mortgages, multifamily mortgages, and commercial (non-farm, non-residential) mortgages; It does not include the “farm” sector on the Federal Reserve Z.1 data [6] According to L.211 Agency-and GSE-Backed securities outstandings from the Federal Reserve Z.1 data |
Archives
February 2024
Tags
All
|
 RSS Feed
RECURSION |
|

Copyright © 2022 Recursion, Co. All rights reserved.