|
In recent months, we have witnessed increasing attention being focused on the Government mortgage programs, particularly VA. Two issues in particular have generated considerable discussion. First, last year VA allowed its forbearance programs to expire without a backstop for distressed borrowers wishing to avoid foreclosure. Instead, VA implemented a voluntary foreclosure moratorium for their servicers, which has been extended to the end of 2024. And very recently, VA implemented a new program, the Veterans Administration Servicing Purchase Program (VASP), to help households in need, with full availability required by December 31, 2024[1]. Second, there has been a noticeable pickup in VA prepayment speeds compared to other major programs, including FHA[2]. This is particularly evident in higher coupon securities:  On April 11, NPR cited Recursion data in a story about VA policies designed to assist distressed borrowers[1]. Last year, VA terminated its forbearance program, leaving borrowers vulnerable to foreclosure. In November, VA initiated a foreclosure moratorium, and on April 10, the Veterans Affairs Servicing Purchase (VASP) program was announced[2]. Recursion data was cited by the reporters to show that interest rates of newly modified VA mortgages are higher than those currently in the forbearance program. 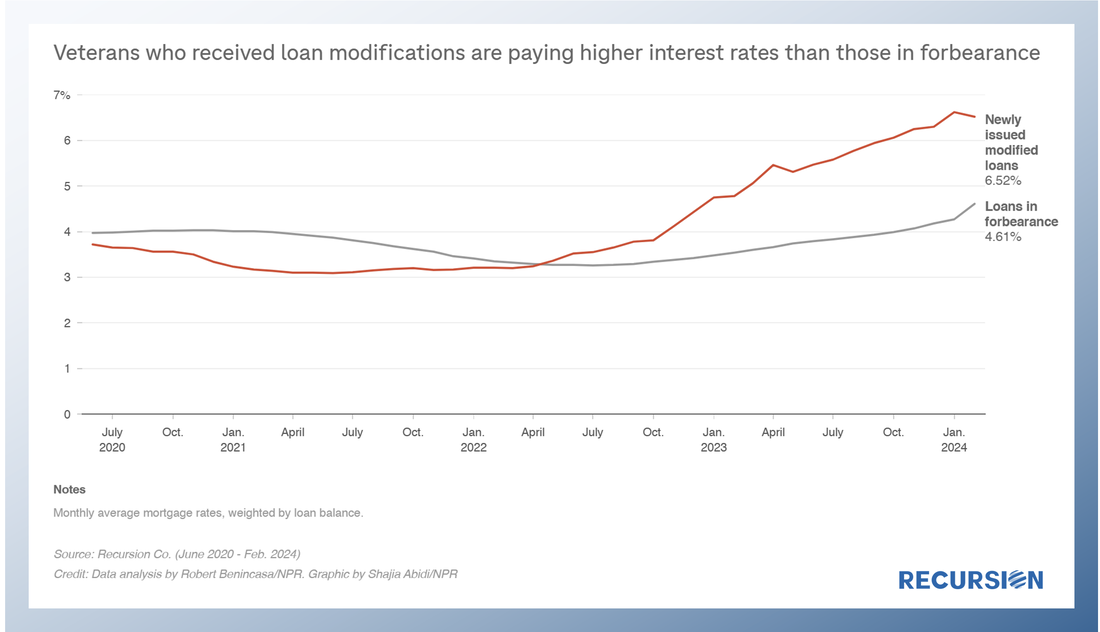 On November 30, 2023, the Veterans Administration (VA) announced a new home retention program called the VA Servicing Purchase (VASP) program as an option for borrowers who cannot be assisted through other home retention options[1]. As the program will not be rolled out until March 2024, VA has strongly encouraged a foreclosure moratorium on all VA-guaranteed loans through May 31, 2024. Under this program, VA will exercise its statutory option to purchase the loan from the servicer and VA will hold the loan in VA's own loan portfolio[2]. The servicer will prepare a modification of the loan to increase affordability for the Veteran. As the vast majority of VA mortgages are securitized in Ginnie Mae pools, let’s first take a look at the outstanding balance and loan count of VA loans using data disclosed by Ginnie Mae: 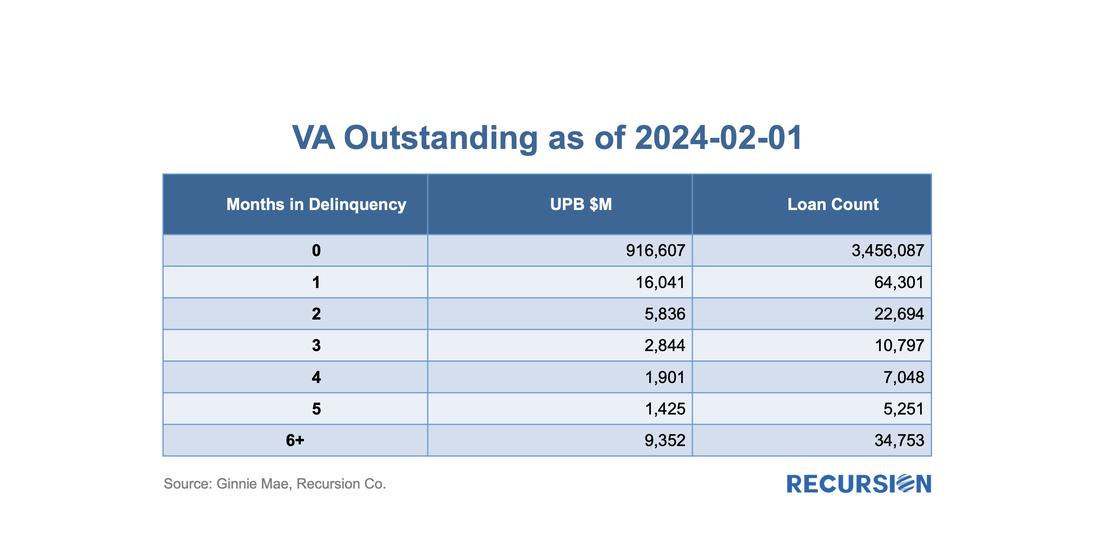 As policy interest rates continue to rise and economic activity begins to slow, attention in the mortgage market shifts towards concerns about the potential for borrower distress. We are early in this process as the labor market continues to add jobs, and there continue to be more job openings than people looking for work. Nonetheless, signs of strain begin to be seen, and it's worthwhile to point out early trends and consider implications. Notably, the impact of Hurricane Ian could be seen in the short-term delinquency data: 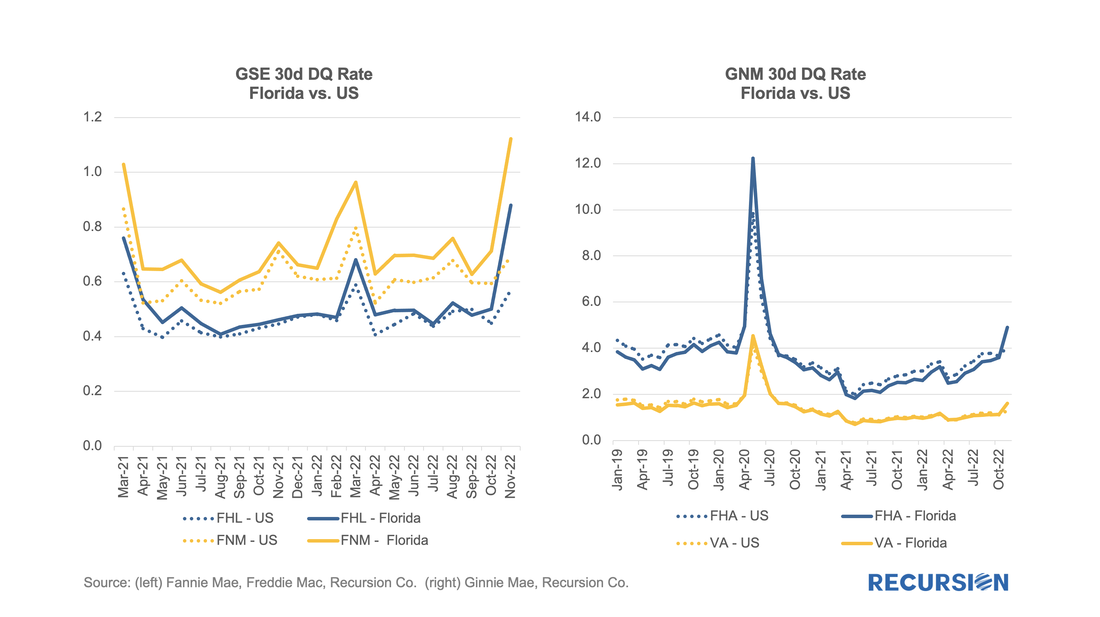 In previous posts, we discussed the trends in Ginnie Mae MBS issuance by loan purpose.[1] Recall that the decision to buy a loan out of a Ginnie pool rests with the servicer. As such, this decision is dependent in part on environmental factors that impact the profitability of this action, notably the interest rate. As loans get bought out at par, there is a greater incentive to purchase loans out of pools and get them into reperforming status when rates are low than when they are high. This relationship can be clearly seen in the following graphs: 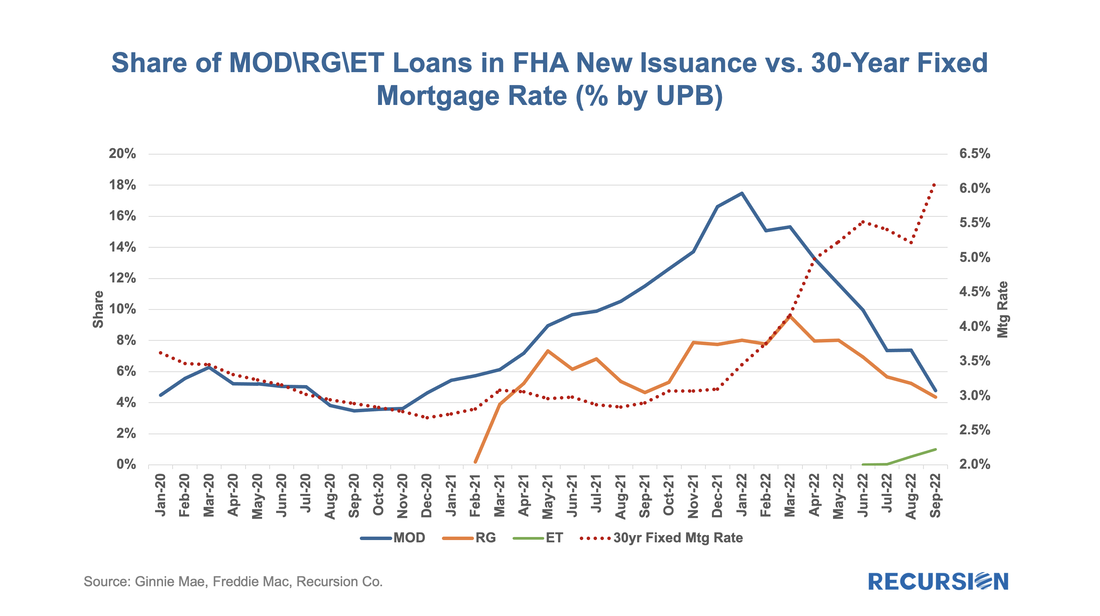 The rise in mortgage rates is having a profound impact on lender strategies in the mortgage market. These can be seen by looking at trends in the use of Third-Party Originators (TPOs). Some lenders, such as Quicken, traditionally work almost exclusively with loans originated in-house, while others, such as PennyMac, primarily accumulate and package loans produced by other lenders. Most larger institutions do some of both. The advantage of acquiring loans from a mortgage broker or correspondent in addition to origination is that the lender has flexibility regarding what method they use to turn volumes up and down to fit its strategy and market views. In both cases, there are costs to increasing and cutting capacity. As the market grows, bringing on new employees carries expenses such as training, while building trusted new external relationships can also be time-consuming. As markets contract, there are direct costs to layoffs, while unwinding networks can impact relationships that can be difficult to rebuild when the cycle turns. Of course, in a sufficiently bad market, the company may have no choice but to cut back. Recently there have been some high-profile announcements of layoffs across the mortgage lending space, but through the first half of 2022, the reported decline in employment has been modest. But employment tends to lag interest rates, so further declines cannot be ruled out. 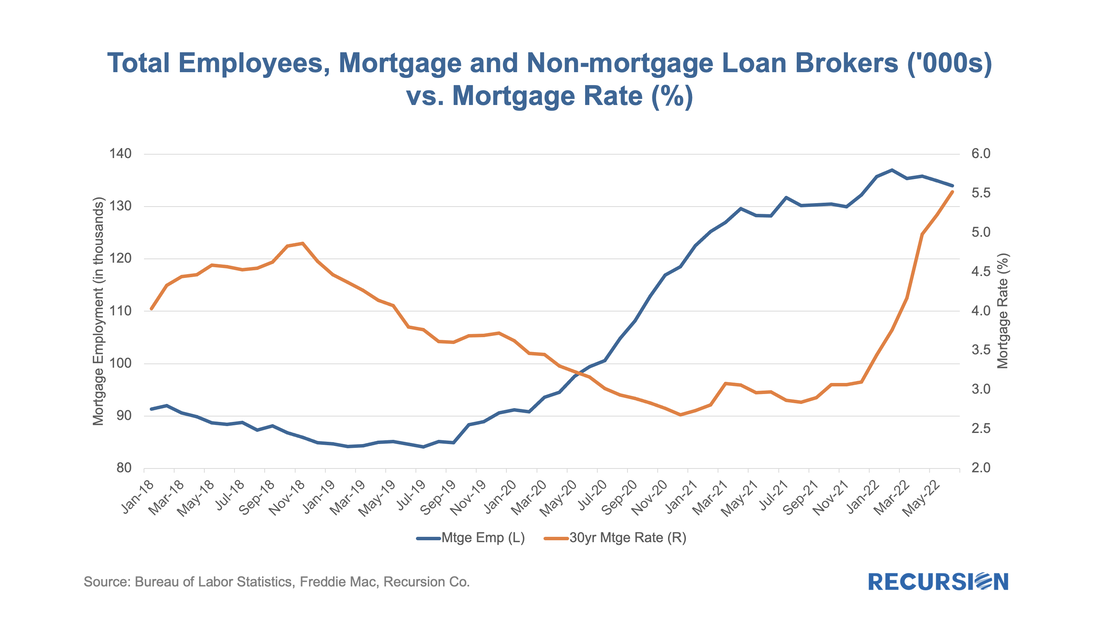 Usually, when we talk about financial institutions in our posts, we focus on sellers and/or servicers as we have a clear view from the Agency disclosures. An interesting distinction in this regard is to break down originations between those sourced through a retail channel within the lending institutions and those purchased from other lenders, known as third-party originations (TPOs). We are often asked the question in the case of TPO lending, where only sponsors of the mortgages are reported, who are the originators? This information is not reported in the agency loan-level disclosure. We can supplement this information by examining originators in the HMDA data by observing the fact a TPO (correspondent or broker) loan is often reported twice, one record reported by the originator and another reported by the sponsor. At Recursion, we conducted an exercise by matching the pairs together, and we were able to identify the counterparty pairs for about 50% of the mortgages marked as “purchased”, and also made this revealing data point to our HMDA Analyzer users. According to the 2021 HMDA preliminary release, about 2.65 million loans were purchased from other lenders that year, about 18% of all originations. Roughly half of these purchases were made by 10 institutions: 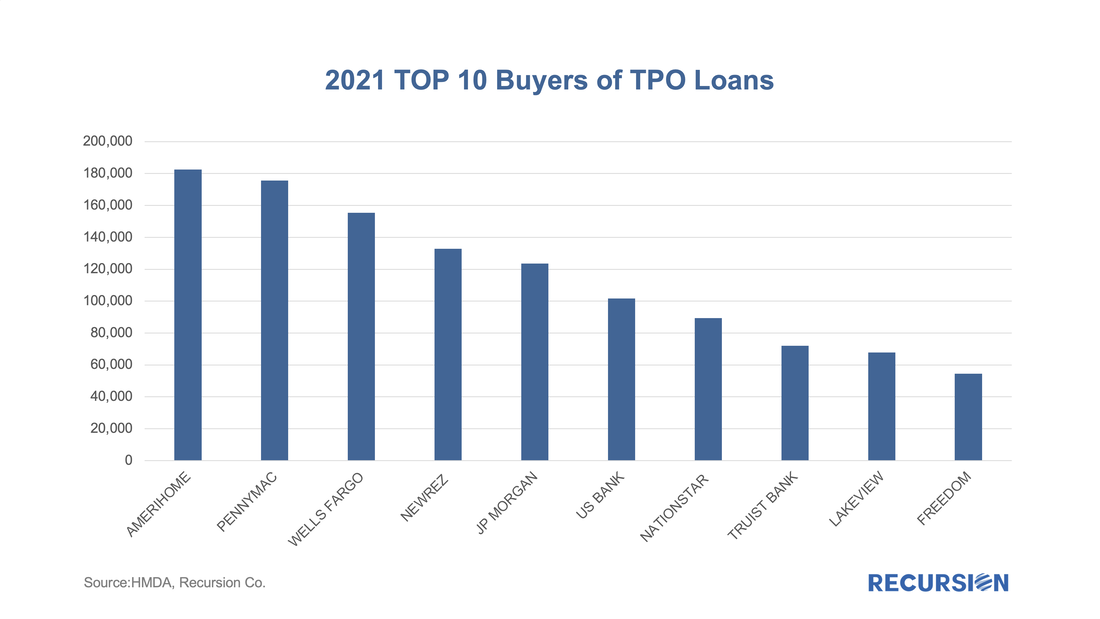 With the 30-year mortgage rate surging to a 13-year high near 5 ¼% and the FHFA purchase-only house price index at a record-high 19.42% in February (edging out the prior record of 19.39% in July 2021), we are in an unprecedented environment in the mortgage market. As such, it makes sense to update our analysis of the trend in issuance updated through April. Of particular interest in this regard are the FHA and VA programs. Let’s start by looking at FHA. By loan count, there were 107,500 FHA loans issued in GNM pools in April, with a decline of over 1/3 from the same month a year earlier. One special interest is the evolution of the share of issuance by loan purpose: 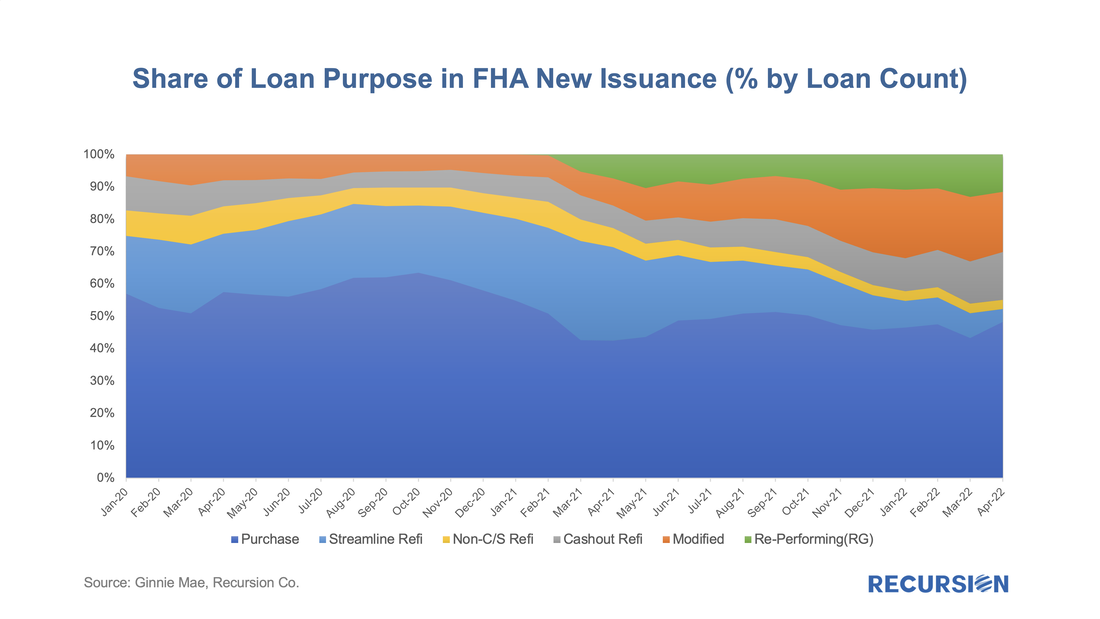 |
Archives
July 2024
Tags
All
|
 RSS Feed
RECURSION |
|

Copyright © 2022 Recursion, Co. All rights reserved.