|
In a recent post, we discussed our comment letter to FHFA regarding policies and procedures related to property inspection wavers (PIWs)[1]. In that note we commented that one of the best ways to assess the impact of the program is to look at the performance of loans with appraisal waivers vs those eligible to obtain waivers but did not. At the time the note was posted (late February 2021) the loan-level data needed to perform such a calculation was not available, so we used a sample obtained from the reference loans in the pools used by the Fannie Mae Connecticut Avenue Security (CAS) Credit Risk Transfer (CRT) program.
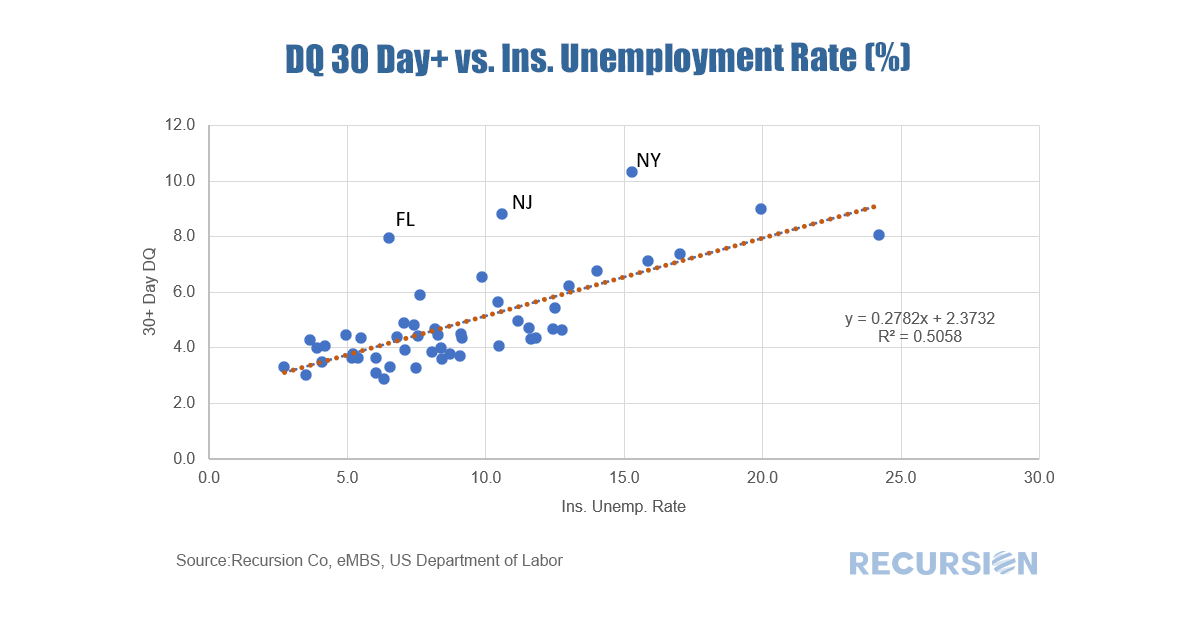
Earlier this month we obtained the loan level DQ data for the books of the GSEs as of the end of February 2021 so a more comprehensive analysis is now possible. As stated in the comment letter, the eligibility rules to obtain a PIW vary by product type and agency, so to obtain an apples-to-apples comparison we need to look at the performance of loans with waivers against those that are eligible to use them but did not, as opposed to all loans. Since waivers are generally a recent development, we look at performance for loans originated in 2019 and 2020. In a prior post, we demonstrated how the loan-level data for the CRT reference pools could produce a good estimate for delinquency rates by state in the conforming mortgage market[1]. One way to confirm this would be to compare these to the unemployment rates by state. In fact, a scatter plot of 30+ day dq’s from the Freddie Mac STACR program vs unemployment rates reveal a striking correlation:
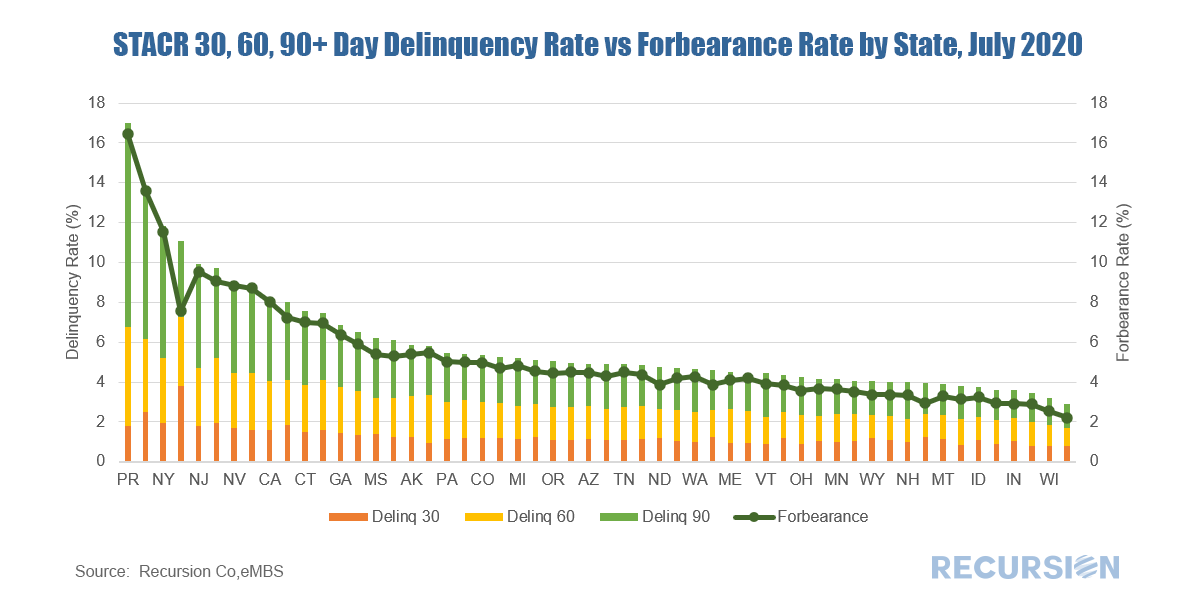
Freddie Mac started to release forbearance data on its STACR CRT program in the July reporting cycle. Previously, the GSEs disclosed only pool-level delinquency and forbearance information [1]. As the loans in the STACR program have a UPB representing over 50% of total deliveries to FHL balances with no obvious state level bias, they would serve as a representative sample in calculating GSE state level delinquency [2]. Similarly, the new STACR data is helpful in assessing the impact of the COVID-19 crisis on forbearance at loan level. From the July STACR data release, we can see a clear correlation between total delinquency rates and forbearance rates at state level. States with higher delinquency rates, such as New York, New Jersey, Hawaii, and Nevada, also have higher forbearance rates. *The Chart can be duplicated using the above two queries This is not a surprise as we noted in an earlier post that Freddie Mac servicers are not required to report loans in forbearance if loans are current [3]. In fact, for STACR data, only 0.95% of current loans are in a forbearance plan, but the forbearance rate for loans in 30 day delinquency, 60 day delinquency, and 90+day delinquency are 30.64%, 92.98%, and 92.12 % respectively. The loan level tapes, delivered by the GSEs each month, unfortunately only contain delinquency data (DQ’s) at the pool level, unlike the Ginnie Mae tape which is at the loan level. One implication of this discrepancy is that state-level DQ’s can be calculated for the Ginnie programs but not, in general, for the GSE’s. An alternative approach for tracking GSE DQ’s at the loan level is to examine the performance of the reference loans in their Credit Risk Transfer (CRT) deals.
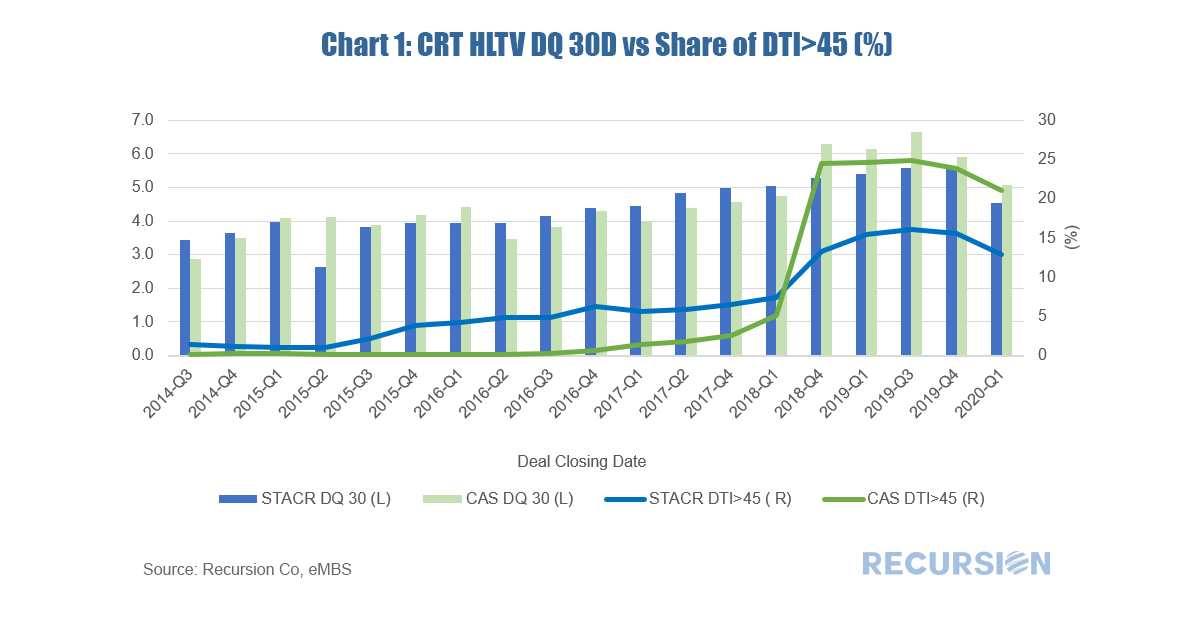
The sample of loans contained in the CRT tapes is a significant portion of the total deliveries to the entities but are not a complete sample. For CAS, the UPB represents 25%-30% of all FNM balances, while for STACR, it represents 50% of all FHL balances. The primary question here is whether the CRT reference loans are a representative sample of the total for delinquencies. The way to validate the assumption is to compute a national aggregate of delinquencies for the whole set of loans in the CRT pools and compare these to the DQ data contained in the GSE monthly summaries[1]. In a recent post we established a correlation between the 30 day dq rate of the loans in the reference pools for the Freddie Mac High LTV STACR CRT program and the share of these loans with high indebtedness as measured by DTI>45 for the month of May[1]. Recently Fannie Mae released the corresponding data for its CAS program and the results are striking. First, the pattern of results we saw for STACR is confirmed. This can be clearly seen if the results of the two programs are overlaid one over the other[2]. *The Chart 1 and Chart 2 can be duplicated using the following two queries
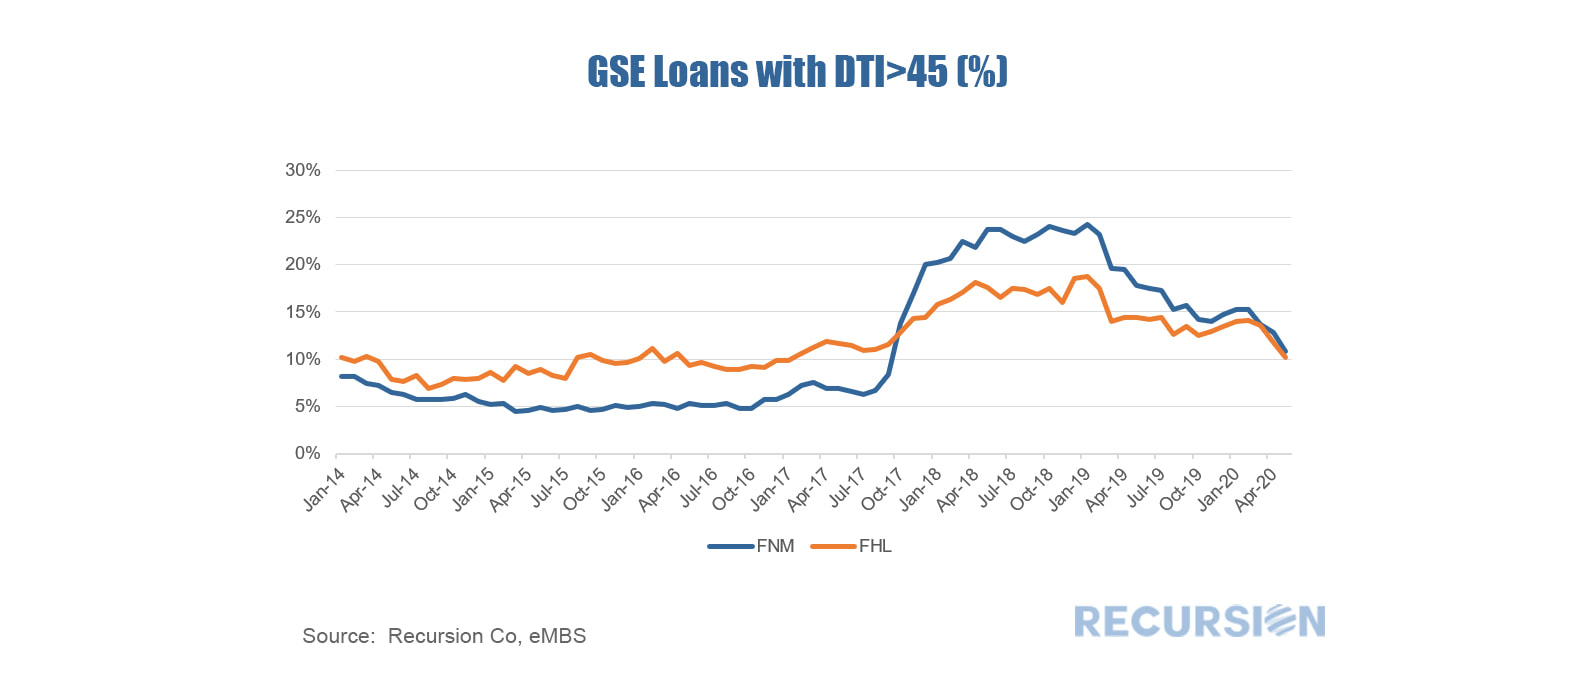
We have written extensively on the mortgage market impact of the Covid-19 crisis, most recently on the first signs of delinquencies in the loans in the reference pools of the Freddie Mac Structured Agency Credit Risk (STACR) program[1]. In that post we noted the dispersion in 30-day average loan delinquencies by state for May 2020. In this note we look at the distribution of delinquencies in the same month across each of the 28 deals issued to date. We can see a distinct increase in the rate of delinquencies from the onset of the program through 2019, before falling early this year. What can account for this pattern? In the five-year period from early 2013 to early 2019, we notice that there was a trend loosening in credit standards as measured by the share of loans in Agency securitized pools with debt-to-income ratios in excess of 45. The trend was exacerbated in 2018 due to rising mortgage rates weighing on mortgage production volumes. As rates fell back during the course of 2019, pressure to keep lending standards so loose eased, and fewer high-LTV loans were delivered to the Agencies. It seems natural to ask if this pattern spills over to the loans in the STACR pools. The chart below shows the share of such loans in high-LTV STACR issues since 2013, plotted against the 30-day May DQ rate for each.
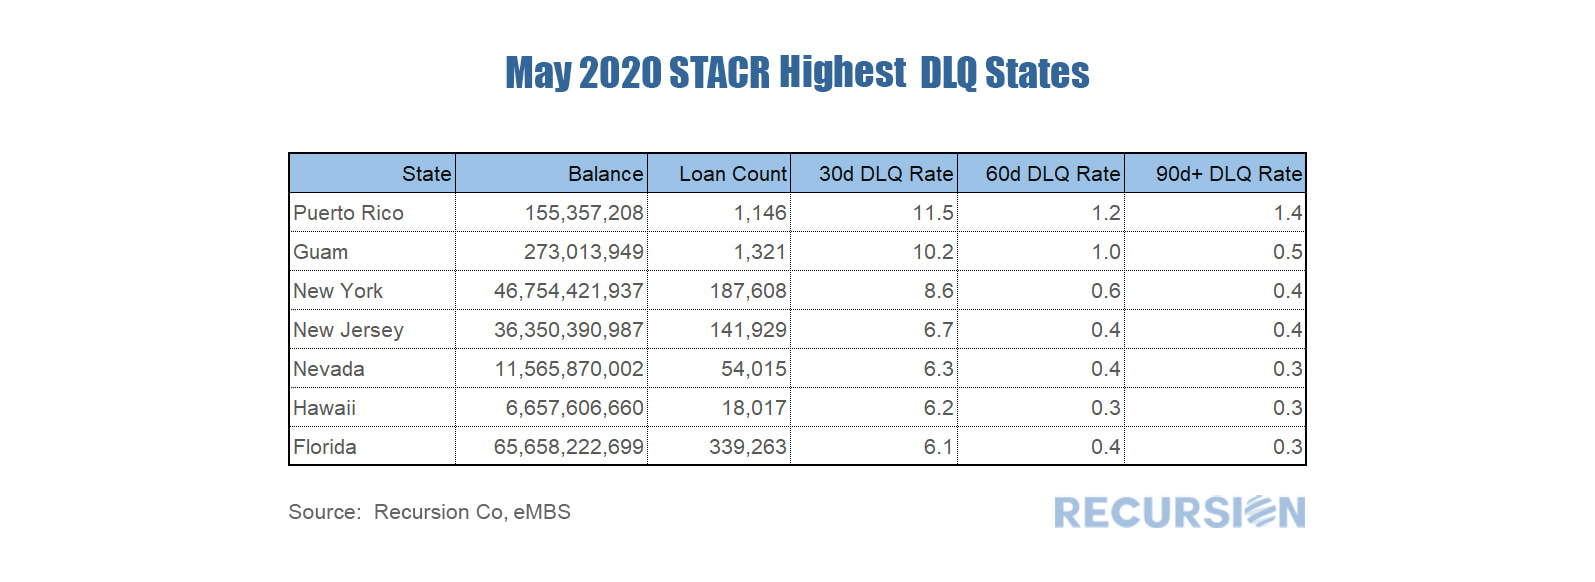
The loan-level data releases we receive early each month contain delinquency data for Government programs such as FHA and VA, but no such information is provided by the GSE’s. However, late in the month data is provided for the reference loans in the Credit Risk Sharing (CRT) programs. However, data for the most recent month is only provided by the Freddie Mac Structured Agency Credit Risk (STACR) program as the comparable Fannie Mae data is released with a 1-month lag. The latest STACR data shows the 30day delinquency rate for Freddie CRT pools went up from 0.76% in April to 4.20% this month. The states with the highest delinquency rates are: And the states with the lowest delinquency rates are: The state rankings are broadly in line with those observed in the Government data. For example, the top three states in terms of 30-day dq’s for the FHA program are New York (14.4%), NJ (13.9%) and Puerto Rico (13.2%). In general, DQ’s for FHA are higher than those for the GSE’s due to the broader credit criteria available in Government programs.
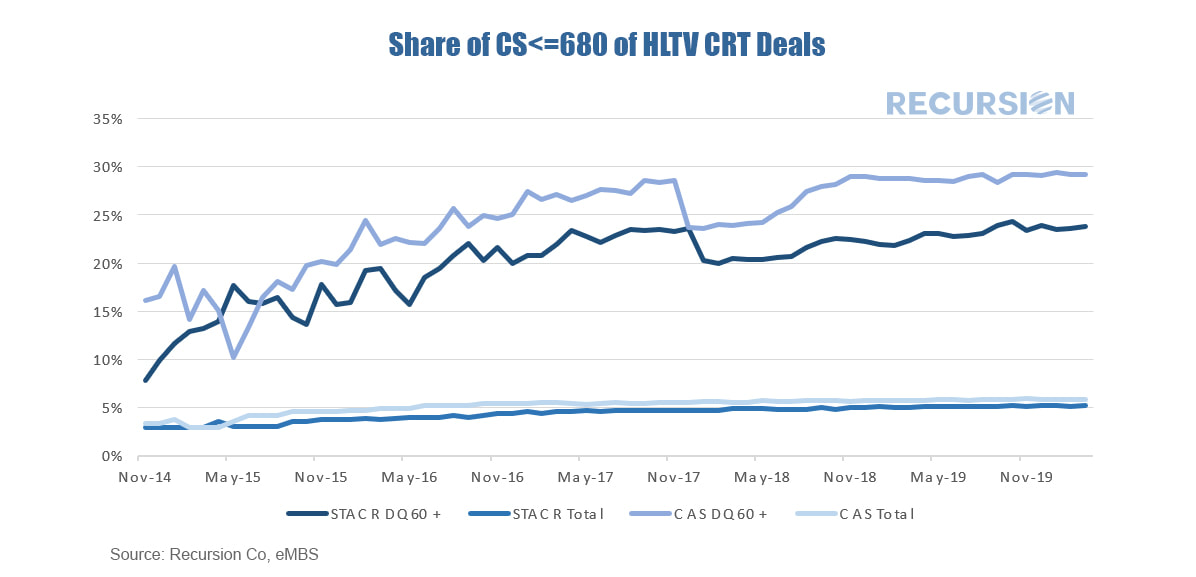
Delinquencies are important in the CRT program because they have the potential to turn into losses shared with private investors. The forbearance programs will delay but not completely prevent this transmission. The ultimate extent of investor losses depends on the duration of the Covid-19 crisis, and ensuing policy actions. As noted in an earlier post[1] we discussed how the GSE’s have been sharing credit risk with private investors through the Credit Risk Transfer (CRT) [2]market. At that time, we discussed how losses tended to grow over time, and noted the significant geographical variation in default rates by state, reflecting local economic conditions. Another consideration noted along these lines is underwriting characteristics. This impact is particularly notable when comparing the performance of loans for lower-credit quality borrowers to others. The chart below looks at the relative performance in CRT high-LTV reference pools between those with FICO scores less and equal to 680 and those greater than that score:
|
Archives
July 2024
Tags
All
|
RECURSION |
|
Copyright © 2022 Recursion, Co. All rights reserved.




 RSS Feed
