|
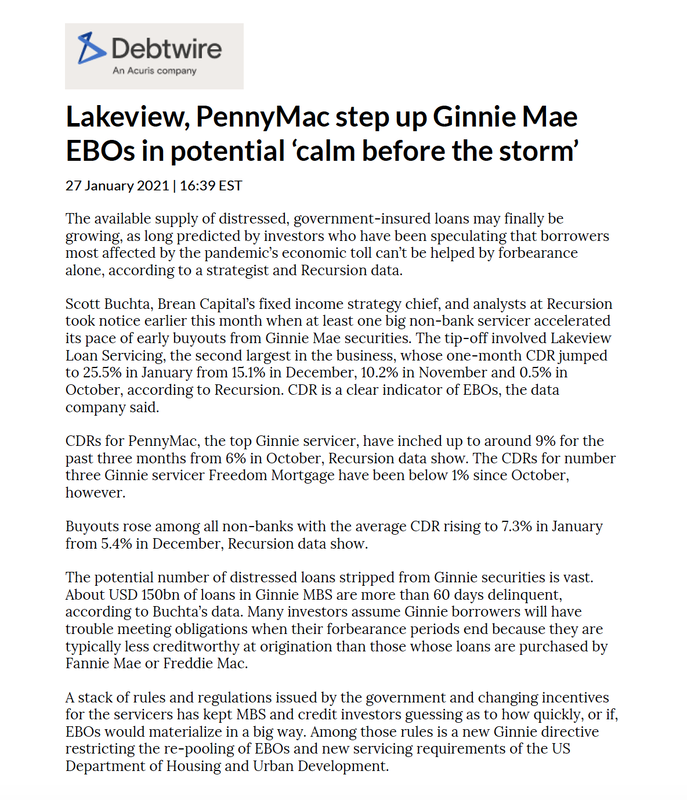
Recursion data was quoted in the January 27th, 2021 Debtwire article on the growing volume of distressed residential loans. The author used Recursion data to observe that the supply of GNM Early Buyouts (EBOs) among non-banks has been rising for months, which indicates that the supply of non-performing loans may be expected to rise when the forbearance program ends.
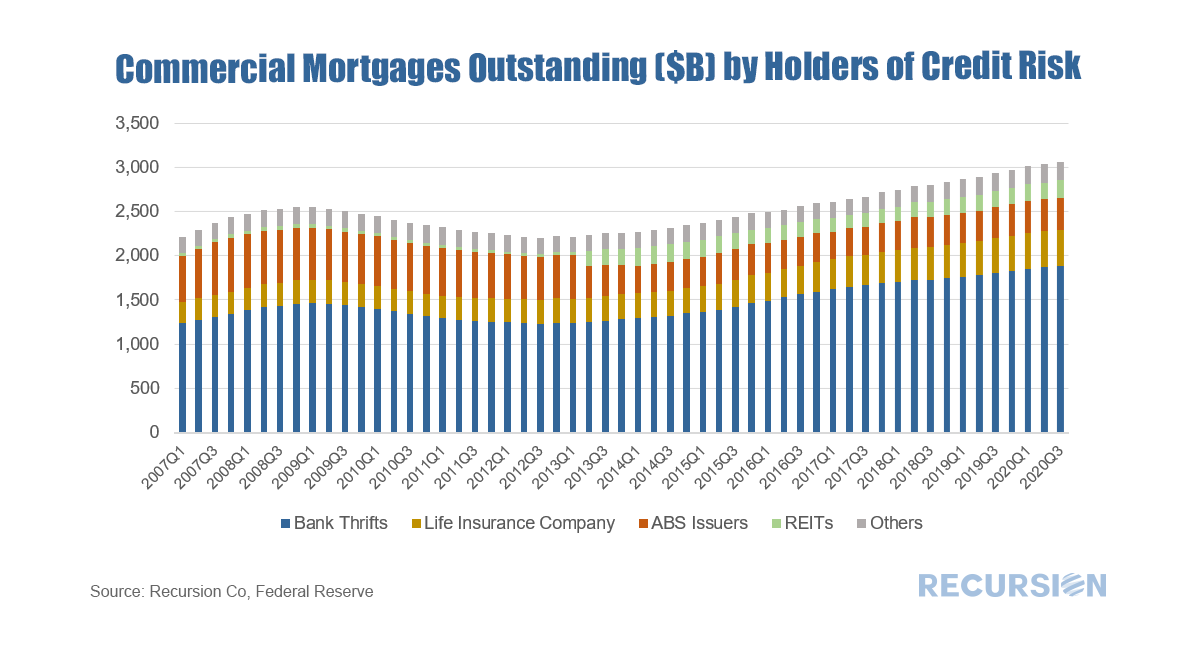
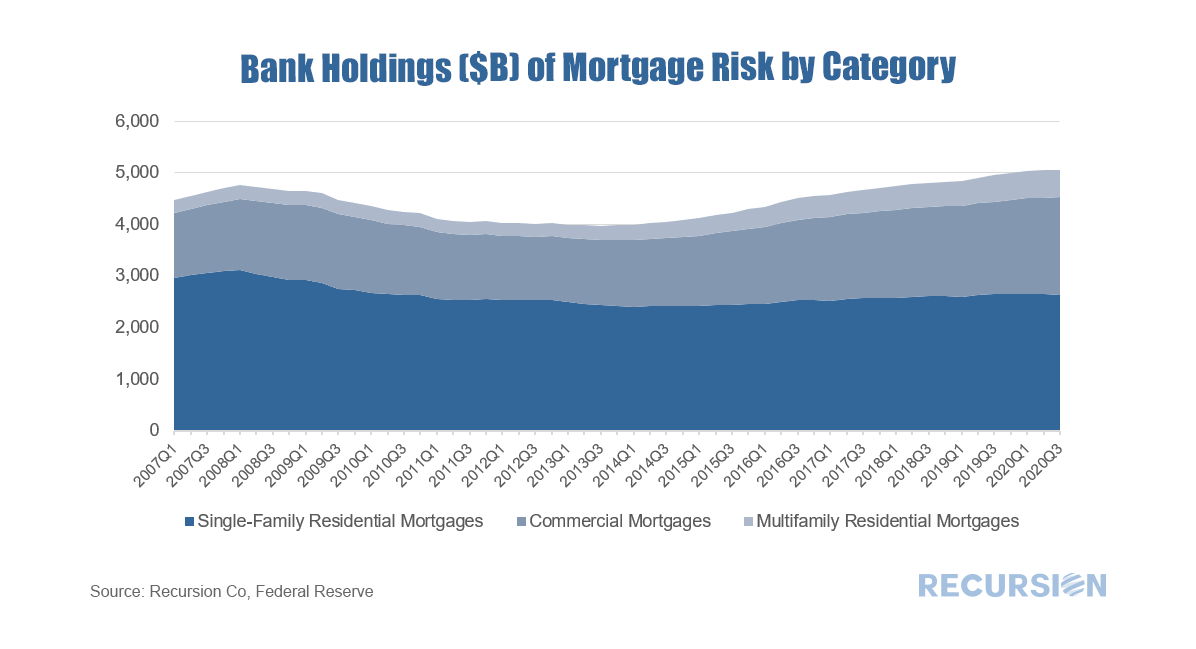
In prior posts, we commented on trends in the distribution of risk in the mortgage markets of single-family residential[1] and multifamily markets[2] from the Federal Reserve Z.1 data. This note takes a look at the commercial mortgage market[3] in a similar fashion. Other than the multi-family category, commercial mortgage for properties such as office, retail, hospitality etc is not normally in our wheelhouse at Recursion, but insofar as it is a substitute as an investment vehicle for the residential markets it is useful to take a look at trends here. Commercial mortgages (excluding multifamily) are exposed to unique risk due to COVID-19, as it is very likely offices, hotels and shopping malls will never to able to achieve the same occupancy rate as before the pandemic. The commercial mortgages(excluding multifamily) outstanding crossed the $3 trillion threshold in Q1 2020. Of interest is that the dominant holder of this risk is banks and thrifts. Their share has been in a narrow 1% range between 61.4% and 62.5% over the past four years[4]. This observation leads naturally to the question of bank holdings across the residential and commercial categories: What is interesting is the steady drop in the share of single-family mortgages held on bank balance sheets over the past dozen years by about 1% per year (currently 52.1%). [5]The impact of Covid-19 on this trend appears to be quite small. Both multifamily and commercial mortgages have gained shares. It’s worth noting that banks hold sizable amounts of single-family MBS in addition to loans, on the order of $2.9 trillion [6] in Q3 2020. In this case, the agencies hold the credit risk, not the banks. There is ample room for banks to boost their holdings of residential loans, one more item to watch in the transition year 2021. [1] https://www.recursionco.com/blog/that-was-then
[2] https://www.recursionco.com/blog/big-data-and-the-multifamily-market [3] Also called “nonfarm, nonresidential” in the Federal Reserve Z.1 data [4] From Q4 2016 – Q3 2020 [5] The denominator of calculation only banks’ holdings of single-family mortgages, multifamily mortgages, and commercial (non-farm, non-residential) mortgages; It does not include the “farm” sector on the Federal Reserve Z.1 data [6] According to L.211 Agency-and GSE-Backed securities outstandings from the Federal Reserve Z.1 data Recursion Co’s Chief Executive Officer Gives the New Year Opening talk at PyData Chicago Group Forum1/26/2021
Recursion Co’s Chief Executive Officer, Li Chang, joined by Recursion’s AWS Solution Architect Tianci Zhu, gave the 2021 opening talk at PyData Chicago Group’s Meetup Forum. PyData is an educational arm of NumFOCUS and it provides a forum for the users and developers within the data analysis community to share ideas regarding data management, processing, analytics and visualization.
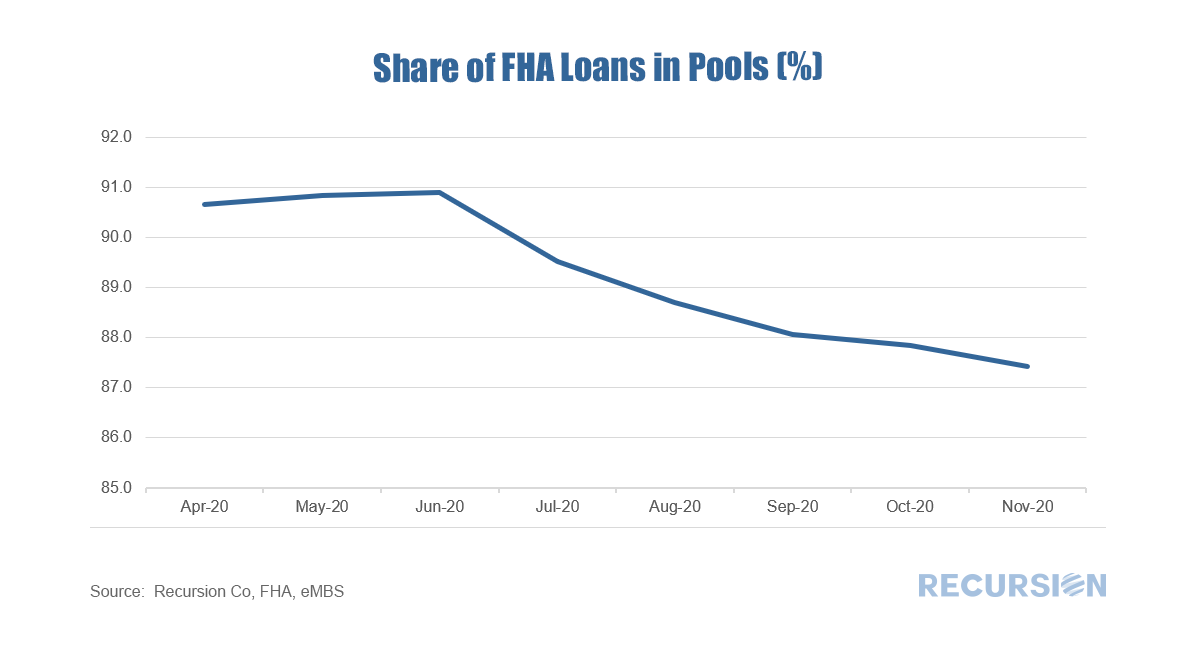
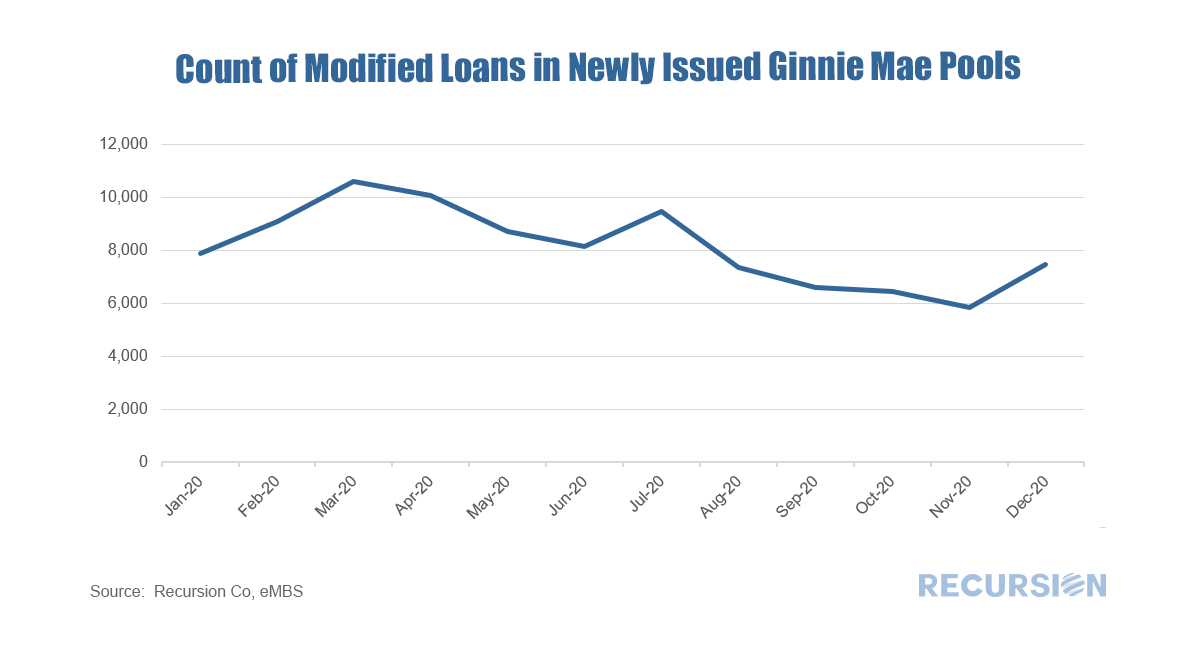
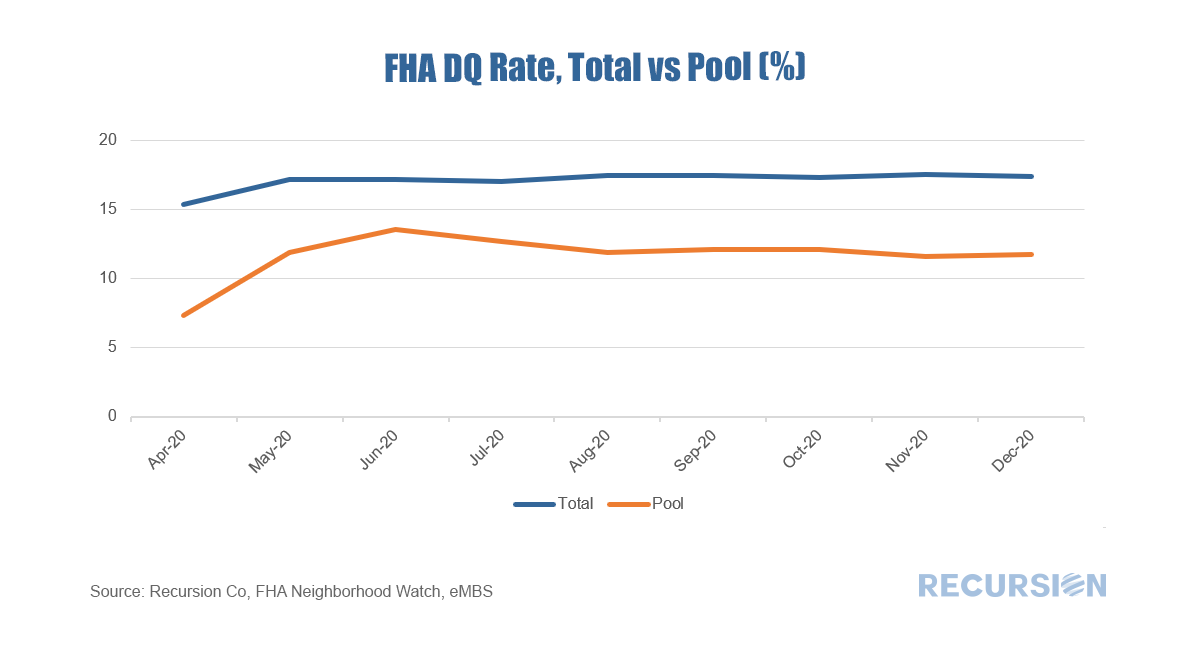
Li and Tianci shared how Recursion applies AWS big data technologies to gigantic financial datasets collected from different sources. They described how the application of advanced technologies brought transparency to the financial markets and realized “data democratization” by cutting down data processing time, reducing user’s costs and making these tools accessible to a much broader audience than was previously the case. The audio can be accessed through PyData’s YouTube channel: https://www.youtube.com/watch?v=YiioELpeasA PyData’s YouTube channel has 108K followers. In a recent post, we discussed the application of the FHA Neighborhood Watch dataset to understanding the market landscape for this program[1]. Peering a bit deeper, more insights can be obtained. We just updated this dataset through December so it is an opportune time to take a look at FHA loan performance. First, the share of FHA loans in pools [2]continued to decline at the end of the year: The loans in pools fell by about 60,000 in December while the total fell by 40,000 implying that perhaps 20,000 loans were purchased out of pools, and presumably modified as foreclosures are currently forbidden. Interestingly, the number of loans in pools new issuance with mods rose for the first time since July: It shows even though most of the loans are expected to be cured by partial claims, modification remains a tool to work out delinquent loans. We will have separate pieces focusing on partial claims in future posts. Now what about delinquencies? What is the delinquency rate[3] of loans in the FHA program? As servicers may buy serious delinquent loans out of pools, and banks tend to hold conventional loans not FHA loans on their balance sheet, the overall FHA delinquency rate reported by FHA Neighborhood Watch data is generally higher than that for loans in pools. When COVID-19 first struck last spring, the 30-day delinquency rate spiked, narrowing the gap with the total figure, but many of these cured as labor markets recovered. More recently, lenders have picked up the pace of purchasing delinquent loans out of pools, as they have the financial incentive to modify the loans to allow the borrowers to become current and then resecuritize them. A key question for 2021 is when forbearance programs expire, how many borrowers will be able to work with lenders to keep their homes, and how many will lose them? Stay tuned. [1] https://www.recursionco.com/blog/fha-buyouts-and-loan-counts
[2] “In pools” means the loans were securitized by Ginnie Mae issuers [3] The delinquency rates are calculated using the delinquent loan counts divided by total loan counts We’ve written previously that the multifamily market will be of growing interest during the course of 2021[1]. During the Global Financial Crisis, the single-family market was ravaged by foreclosures resulting from the popping of the housing bubble. The large number of households losing their homes became renters to a large degree. This time is different. Renters are fleeing congested urban areas and are buying homes in areas with more space, serving to push up house prices while rents are under downward pressure. According to the Elliman Report, the rental vacancy rate for Manhattan in November 2020 was 6.1%, compared to 1.8% a year earlier.[2] This figure will of course vary considerably from place to place. The potential for more vacancies remains once the various Federal and Local Covid-19 bans on evictions are allowed to expire. According to Trepp, the national 30+ day delinquency rate for multifamily loans in December 2020 was 2.75%, up modestly from 2.00% a year earlier[3].
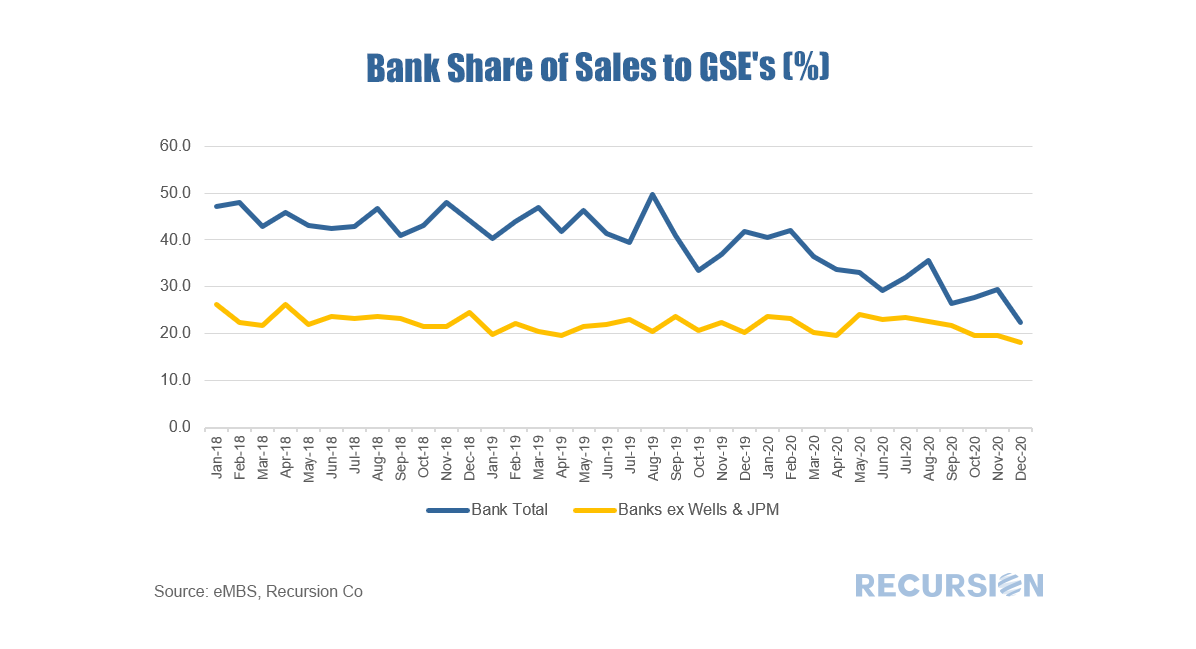
The role of the Agencies in the multifamily debt market is significant, but less than the overwhelming presence seen in the single-family market[4]. Data disclosed by the agencies provides a wealth of information about the rental market but did not receive widespread attention until recently. In this post, we discuss trends in multifamily loan maturity schedule and prepayment penalty schedule. This data is of interest because unlike the single-family market, there are fewer apartment loans, but they are generally quite large. Maturities can clump, leading to periods of time when capital demands can push borrowing costs higher. On the other hand, opportunities for lenders arise when loans mature or exit the prepayment penalty window. Our regular readers will be aware that an ongoing theme is the collapsing bank share of mortgage deliveries to the Agencies[1]. Our recent monthly download shows that the bank share of deliveries to the GSEs fell sharply again in December, collapsing by over 7.0%(!) from November to a record low 22.3%. A year earlier this figure stood at 41.7%. The plunge witnessed over the past year marked an acceleration in a long-term trend, as banks face a heavier regulatory burden relative to nonbanks, and as nonbanks have made inroads into the market through their development of superior technology interfaces with their clients. Covid-19 has served to accelerate this trend by pulling customers out of bank branches and putting them in front of their laptops and smart phones.
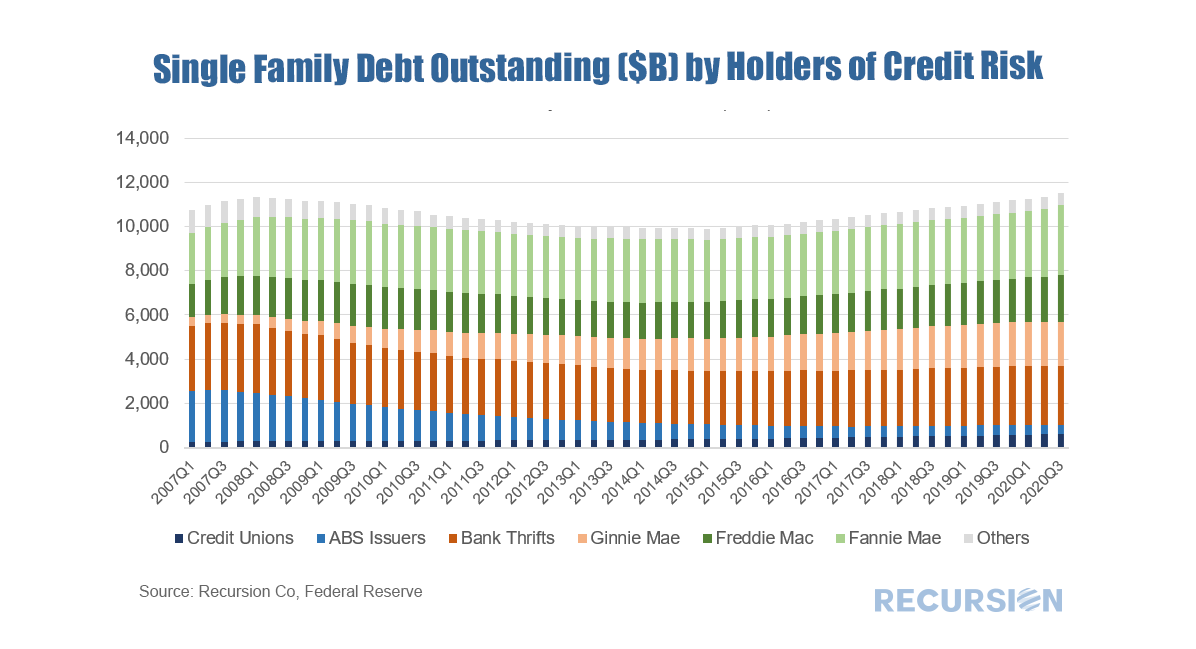
The latest drop incentivized us to dig a little deeper; we didn’t have to peer too deep to find an interesting result. Below finds a bank of the bank share of GSE deliveries, and the same chart excluding Wells Fargo and JP Morgan Chase. As we have commented several times, the Federal Reserve Z.1 data is a fine source of information on long-term financial market trends. This post looks at trends in ownership of single-family mortgage risk. The chart below shows this distribution from Q1 2007 to Q3 2020:
So once again we look at the theme of 2021 as a transition year. A lot of the year will be spent peering at the data to tease out emerging trends as we head towards the new normal.
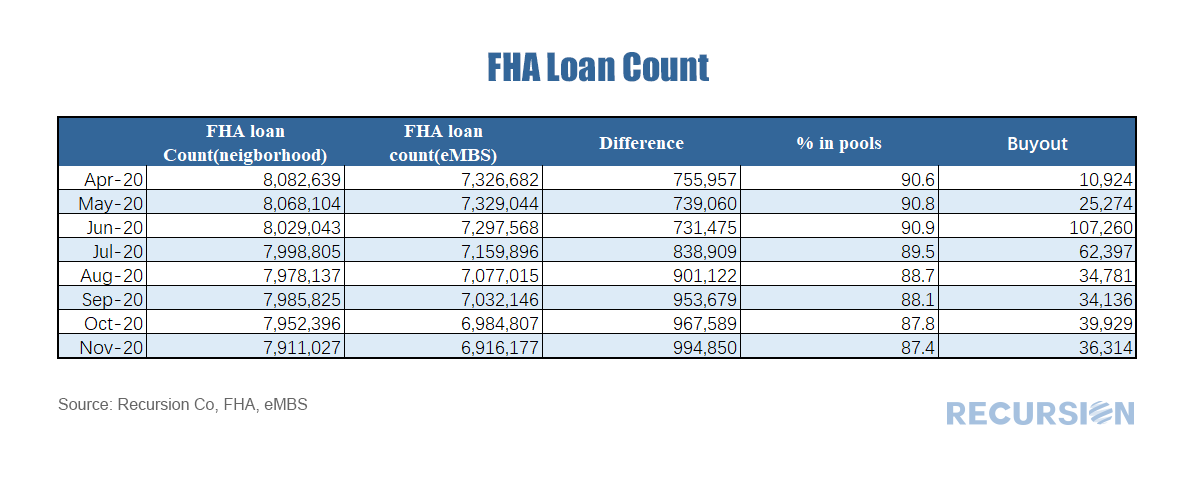
The discernment of new trends requires the use of new data, and new tools. We have recently brought into the Recursion data set FHA Neighborhood Watch data, which was discussed previously in the context of partial claims[1]. These are the suspended mortgage payments for loans in forbearance that are rolled into a second lien, repaid only when the loan is extinguished. This is particularly useful for tracking the financial burden of forbearance by servicer. To accomplish this in a comprehensive manner, FHA releases this data for all endorsed loans. Using this data, we can examine trends in all loans vs those securitized in Ginnie Mae pools. Our data for the FHA Neighborhood Watch extends back only to April 2020, but the last eight months have been an interesting period in mortgage markets. |
Archives
July 2024
Tags
All
|
RECURSION |
|
Copyright © 2022 Recursion, Co. All rights reserved.

 RSS Feed
