• HOME
  • solutions
    • RECURSION ANALYZERS
    • Mortgage Company Data
    • Recursion DataCloud
    • Customized Solutions
  • BLOG
  • CLIENT LOGIN
    • Recursion Analyzers
  • ABOUT US
    • OVERVIEW
    • OUR TEAM
    • News & Events >
      • Recursion In News
      • Recursion Data Citations
  • CONTACT
RECURSION CO
  • HOME
  • solutions
    • RECURSION ANALYZERS
    • Mortgage Company Data
    • Recursion DataCloud
    • Customized Solutions
  • BLOG
  • CLIENT LOGIN
    • Recursion Analyzers
  • ABOUT US
    • OVERVIEW
    • OUR TEAM
    • News & Events >
      • Recursion In News
      • Recursion Data Citations
  • CONTACT
BLOG

FHA Buyouts and Loan Counts

1/8/2021

 
So once again we look at the theme of 2021 as a transition year. A lot of the year will be spent peering at the data to tease out emerging trends as we head towards the new normal.
​
The discernment of new trends requires the use of new data, and new tools. We have recently brought into the Recursion data set FHA Neighborhood Watch data, which was discussed previously in the context of partial claims[1]. These are the suspended mortgage payments for loans in forbearance that are rolled into a second lien, repaid only when the loan is extinguished. This is particularly useful for tracking the financial burden of forbearance by servicer. To accomplish this in a comprehensive manner, FHA releases this data for all endorsed loans. Using this data, we can examine trends in all loans vs those securitized in Ginnie Mae pools. Our data for the FHA Neighborhood Watch extends back only to April 2020, but the last eight months have been an interesting period in mortgage markets.
Picture
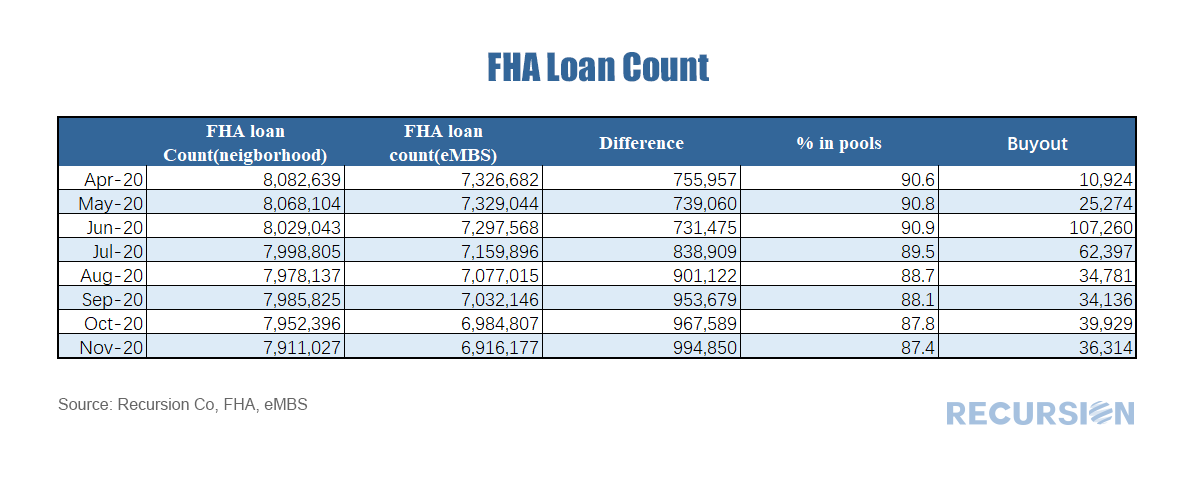
As of November 2020, there were 7.9 million loans in the FHA Neighborhood Watch database, while there were 6.9 million securitized in Ginnie Mae pools, reported by eMBS, a gap of 1 million loans. Since loans may be held by servicers or on bank balance sheets, it’s not surprising that the number of loans in pools falls short of the total. What is interesting here is that the gap of 1 million loans in November has grown steadily since June[2]. Why is that? Well, there are many factors behind financial institutions’ decisions to hold or securitize loans, but what has been particularly interesting since last June is the growing number of buyouts of loans from pools associated with delinquencies stemming from the Covid-19 pandemic[3].
Picture
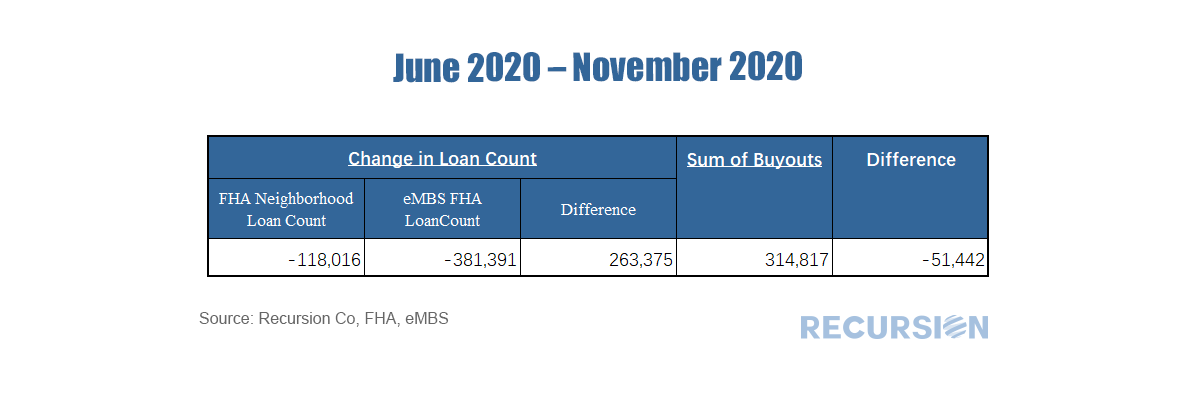
​Between June and November of 2020, the number of loans in the FHA Neighborhood Watch data base fell by 118K while the number of loans in Ginnie pools fell by 382K, 263K more than the drop in the total. Over that same period, 315K loans were bought out of pools, accounting for 51.4K more than the total discrepancy in loan growth between the two sources. The remaining difference may be explained as resecuritization of loans previously bought out of pools, although other explanations are possible.

[1] https://www.recursionco.com/blog/partial-claims
[2] We commented previously that the declining share of FHA loans in the mortgage market is related to a growing share of FHA loans that refinance into conventional loans. https://www.recursionco.com/blog/the-fha-refi-share
[3] The large jump in buyouts last June is related to changes in Ginnie Mae pooling regulations. https://www.recursionco.com/blog/the-great-prepay

    Archives

    April 2025
    January 2025
    November 2024
    September 2024
    August 2024
    July 2024
    June 2024
    May 2024
    April 2024
    March 2024
    February 2024
    January 2024
    December 2023
    November 2023
    October 2023
    September 2023
    August 2023
    July 2023
    June 2023
    May 2023
    April 2023
    March 2023
    February 2023
    January 2023
    December 2022
    November 2022
    October 2022
    September 2022
    August 2022
    July 2022
    June 2022
    May 2022
    April 2022
    March 2022
    February 2022
    January 2022
    December 2021
    November 2021
    October 2021
    September 2021
    August 2021
    July 2021
    June 2021
    May 2021
    April 2021
    March 2021
    February 2021
    January 2021
    December 2020
    November 2020
    October 2020
    September 2020
    August 2020
    July 2020
    June 2020
    May 2020
    April 2020
    March 2020
    February 2020
    May 2019
    March 2019
    February 2019

    Tags

    All
    Affordability
    ARM
    Bank Call Report
    Bank\nonbank
    Borrower Assistant Plan
    Buydown
    Cash Window
    Climate Change
    CMBS
    CMO
    Conforming Loan
    Conventional Loan
    COVID 19
    CPR\CDR\CRR\CCR
    Credit Score\DTI\LTV
    Credit Union
    CRT\CAS\STACR
    Delinquency
    DPA
    Early Buyout
    Early Payment Default
    ESG
    ET Pools
    Fannie Mae
    Fed
    FHA
    FHFA
    Forbearance
    Foreclosure
    Foreign Investor
    Freddie Mac
    Freddie Mae
    FTHB\Repeated Purchase
    Ginnie Mae
    Green Loans
    GSE
    HECM
    HELOC
    HMDA
    HUD
    LMI
    Macro
    Manufactured Housing
    Modified Loans
    MSR
    Multifamily
    Multi-issuer
    Occupancy Type\NOO
    Partial Claim
    Payoff
    PIW
    Prepayment
    Property Valuation Methods
    PUD
    Purchase Loans
    Recursion In News
    Recursion In The News
    Refi Loans
    Reperforming
    Repurchase
    RG Pools
    RIN
    Rural Housing
    SEC
    Second Lien
    Single Family
    Special Eligibility Program
    TBA Market
    TIC
    TPO
    UMBS
    US Treasury
    VA

    RSS Feed

RECURSION

SOLUTIONS ​
Recursion Analyzers
​
Mortgage Company Data
Recursion DataCloud
Customized Solutions


ABOUT US  ​
Overview
​Our team
CLIENT LOGIN   ​
Recursion Analyzers

CONTACT

224 West 30th St., Suite 303, New York, NY 10001
Contact Us

Picture
Copyright © 2024 Recursion, Co. All rights reserved.​
  • HOME
  • solutions
    • RECURSION ANALYZERS
    • Mortgage Company Data
    • Recursion DataCloud
    • Customized Solutions
  • BLOG
  • CLIENT LOGIN
    • Recursion Analyzers
  • ABOUT US
    • OVERVIEW
    • OUR TEAM
    • News & Events >
      • Recursion In News
      • Recursion Data Citations
  • CONTACT