|
In a recent post[1] we noted that prepayment speeds jumped in June, led by a startling 12.4% rise in 1-month FHA speeds to 36.1, likely due to a change in pool rules that prohibited loan buyouts from being re-securitized beginning on July 1. This bears looking into. If this jump is due to such a policy change then one would expect that prepayment speeds would rise more for banks than thinly capitalized nonbanks. Indeed, this is the case, and remarkably so. 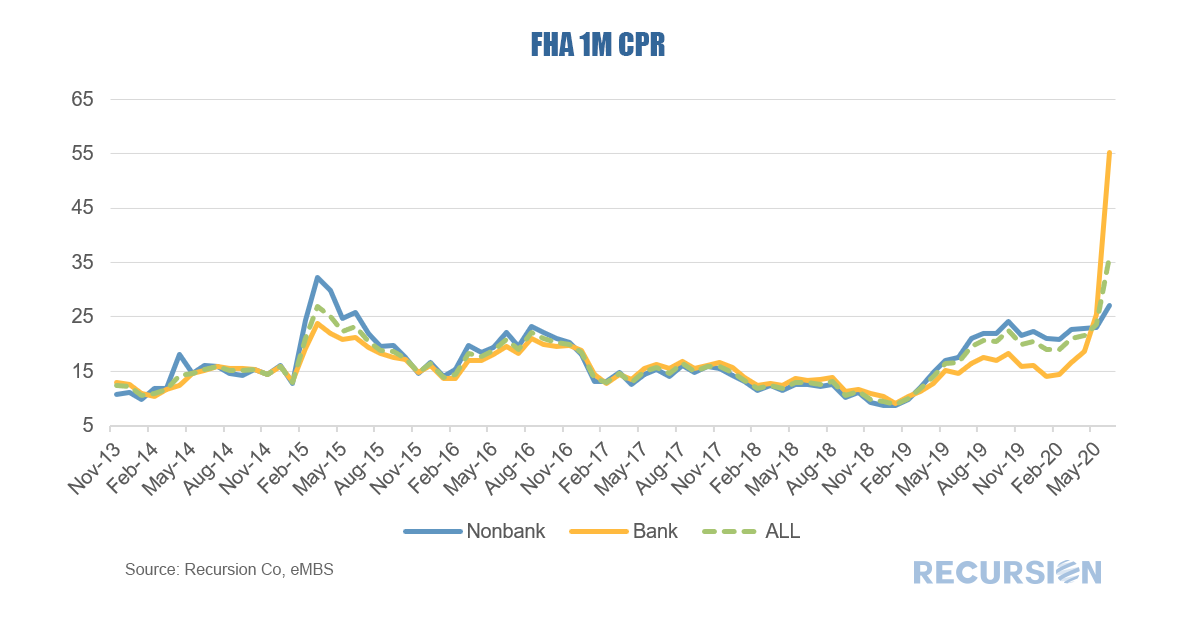 For most of the past seven years, nonbank prepays were higher than those of banks during periods of falling rates, such as 2015, 2019 and the first quarter of 2020. Last month, the situation dramatically reversed. Nonbank prepays rose, but failed to reach the peak attained in 2015. On the other hand, 1-mo prepays for FHA loans serviced by banks soared by almost 30 CPR to 55.2(!) more than twice the speeds reached in 2015. It is interesting to look at which institutions are most involved in this dramatic jump. Below find a table of the UPB and speeds for the top 20 servicers for FHA loans, ranked by prepayment speeds.  Banks are six of the top 20 servicers, comprising 24.1% of the books managed by the top 20 servicers. They were also the five fastest servicers as measured by 1-month CPR, led by a 43 CPR jump to 72(!) on the part of Wells Fargo, while their involuntary prepays, measured by CDR, is 65, a level that has never been seen before. Going forward, we expect prepays to slow as the window for these buyouts to re-securitize closed at the beginning of the month. It will be very informative to watch speeds between the bank and nonbank sectors in coming months, as well as that for specific servicers. |
Archives
July 2024
Tags
All
|
 RSS Feed
RECURSION |
|

Copyright © 2022 Recursion, Co. All rights reserved.