|
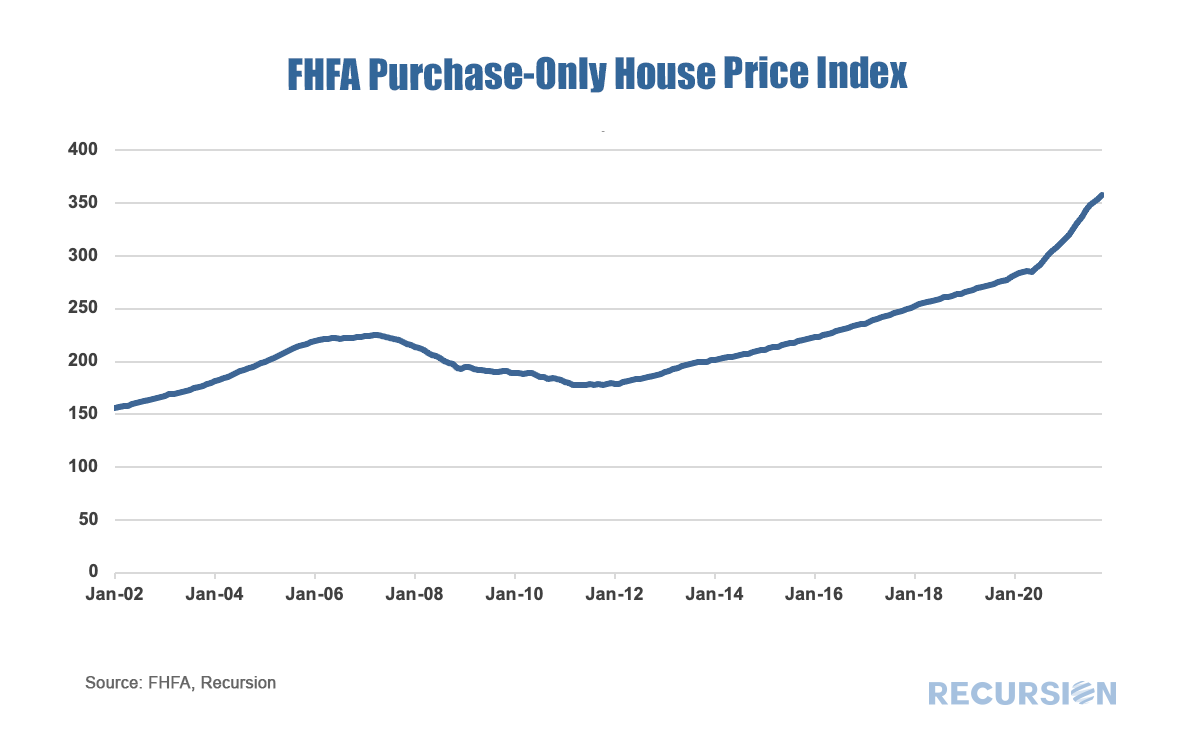
Over the past couple of years, we’ve witnessed some volatility with regards to FHFA’s approach to mortgages on second homes and investor properties (sometimes referred to non-owner occupied housing or NOO). In January 2021, FHFA announced that caps would be imposed to limit the acquisitions of loans backed by second homes and investment properties to 7% of the total on a rolling 52-week basis[1]. These caps were then suspended in September of that year. Then, on January 5, 2022, FHFA announced targeted fee hikes on second home mortgages and jumbo mortgages on loans delivered to Fannie Mae and Freddie Mac, to be implemented on April 1, 2022[2]. These up-front fees are tiered by LTV and for second home mortgages range from 1.125% and 3.875% and for high balance loans range from 0.25% and 0.75%. Borrowers in special affordability programs[3] are excluded from these fees, as are first-time homebuyers in high-cost areas whose incomes fall below 100% of the area median income. To see what if any impact these fee hikes have had on the targeted market segments, we look first at the share of conventional loans broken into second homes, investment homes and others, as measured by loan count. 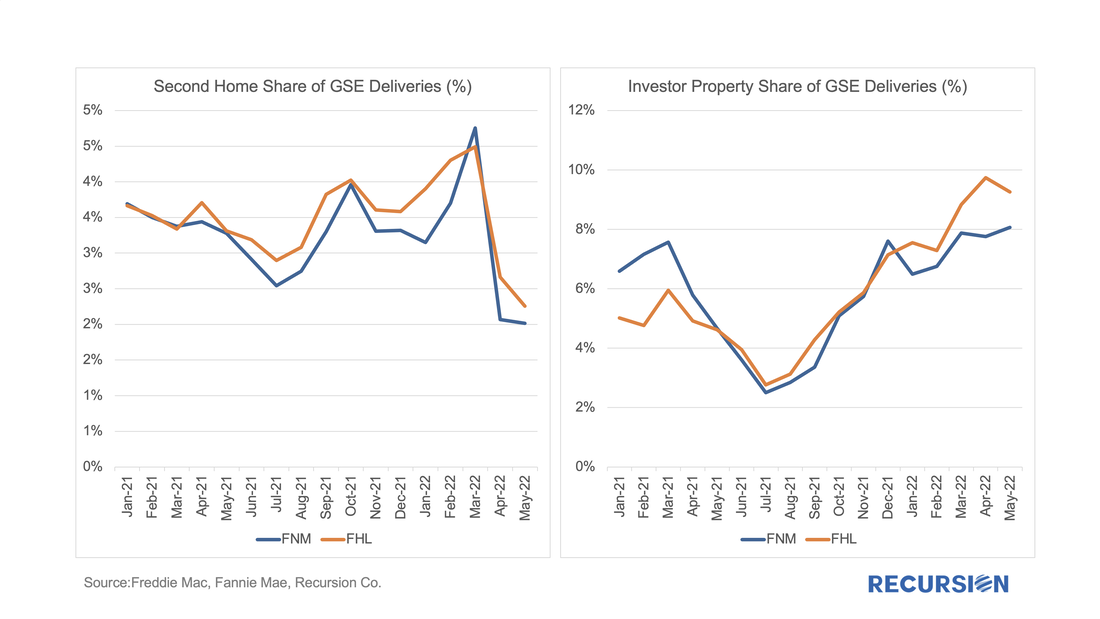 In a recent post, we discussed the market impact that arose from the imposition, and subsequent reversal, of limits on deliveries of NOO (non owner-occupied) residences, as well as on deliveries via the cash window, to the GSEs[1]. In summary, it discussed how the imposition of limits resulted in declines in the share of the NOO categories in the summer, with some rebound in evidence in Q3 when these were rescinded. In this exercise, we look at the change in the share of purchase mortgage deliveries to both Enterprises from the same quarter in the prior year. This is done to eliminate the seasonal pattern that is in evidence in these shares that derive from the fact that owner-occupied purchases tend to have a strong seasonal pattern (peak in the spring) while the NOO categories do not. If the suspension of the constraints in September 2021 were binding, we would expect to see a jump in the share in the NOO categories in Q4. This is certainly the case for investment properties: 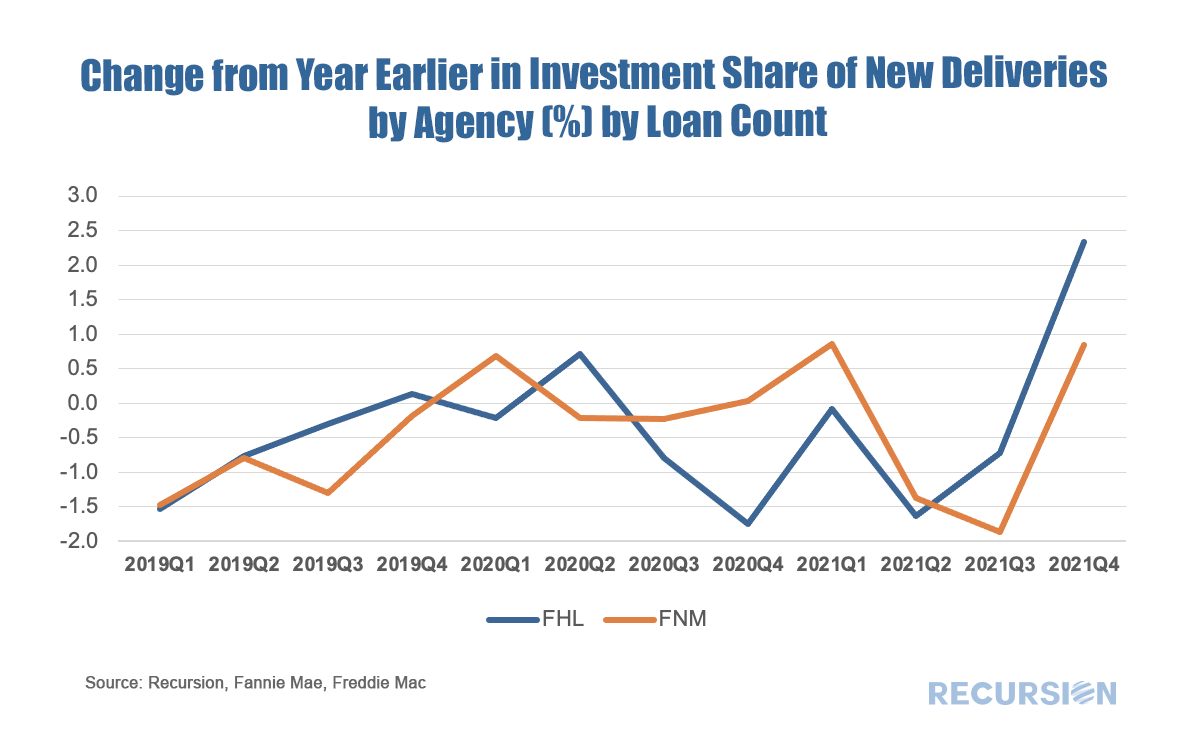 A curious policy development this year has been the stop-start approach towards the imposition of caps on the GSE’s regarding their purchases of loans backed by non-owner occupied (NOO) residences. In January the Treasury and FHFA amended the Enterprise’s Preferred Stock Purchase Agreements (PSPAs) to limit their acquisitions of single-family mortgage loans secured by second homes and investment properties to 7% of single-family acquisitions over the preceding 52-week period[1]. In September these caps were suspended[2]. Below find charts of the shares of second homes and investment properties out of all purchase mortgage deliveries to Fannie Mae and Freddie Mac, along with supporting fundamental factors. 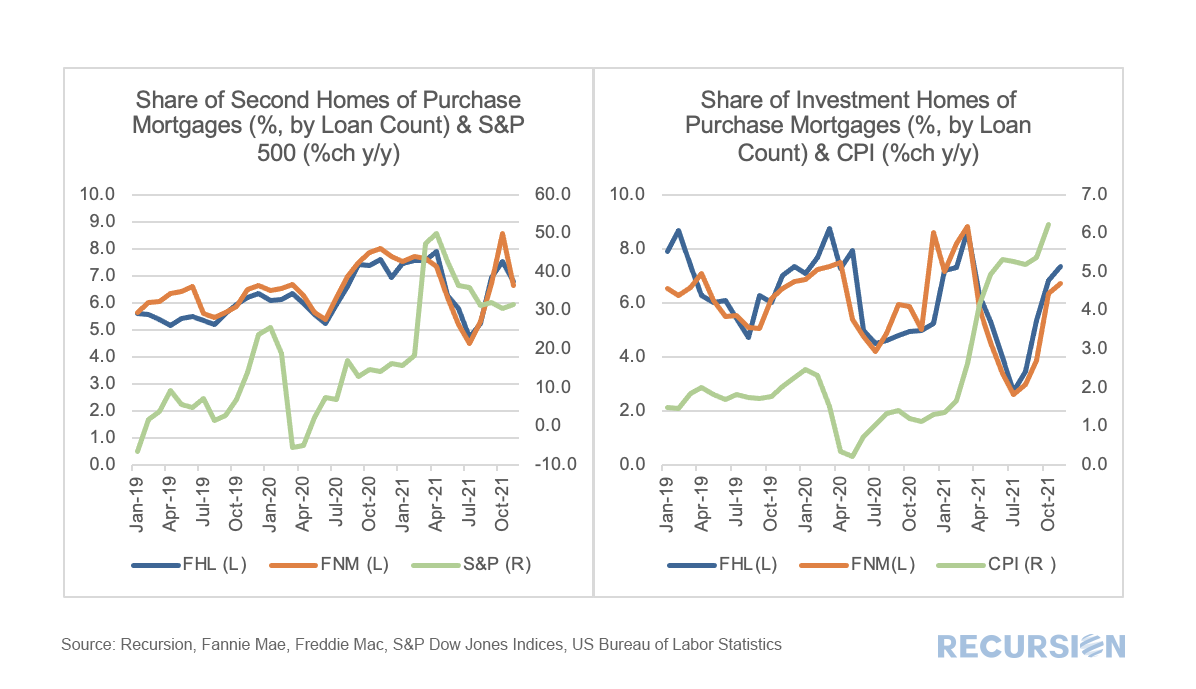 In both cases, there was a drop in the shares in the NOO categories after the initial policy announcement this year followed by a rebound in recent months. With regards to the fundamental factors, in the case of second homes, the share of purchase mortgages rose from about 6% to 8% following the onset of the pandemic as households sought refuge from densely populated areas. According to the National Association of Realtors, more than 50% of second homes are all-cash transactions, suggesting that the equity market is more important than earned income in driving these buying decisions[3]. Of course, the data used here come from loans in Agency pools, but the performance of the equity market likely has a significant influence on buyer sentiment in this market segment. The recent acceleration of consumer prices is likely supporting the sales of homes purchased for investment purposes, as real estate is widely seen as a hedge against inflation, in part because mortgage payments will not rise if the purchase is financed with a fixed-rate mortgage. Once again, we have a case where optimal investment decisions are driven by detailed knowledge of a combination of policy and fundamental factors. Loan-level digital tools are essential in drilling down to the level needed to formulate successful strategies. Recently, the Federal Reserve released its May 2021 Financial Stability Report[1], with a particular emphasis on asset valuations. Valuations are raised as a concern as “Prices of risky assets have generally increased since November with improving fundamentals, and, in some markets, prices are high compared with expected cash flows”. While not cited as a matter of high alarm the report commented that “House price growth continued to increase, and valuations appear high relative to history.” On May 25, FHFA released the purchase-only house price index for March, showing a record-high growth rate of 13.9%, far above the bubble-era peak of 10.7% attained in 2005[2]. Housing fundamentals are of course supportive with mortgage rates below 3% and economic activity rebounding as vaccine optimism spreads. The unique factor now in housing is the impact of the pandemic on preferences for housing away from density and towards suburban and smaller-urban centers. This new fundamental can easily be seen via booming housing demand during the pandemic as measured here by purchase mortgage deliveries to Freddie Mac[3]. 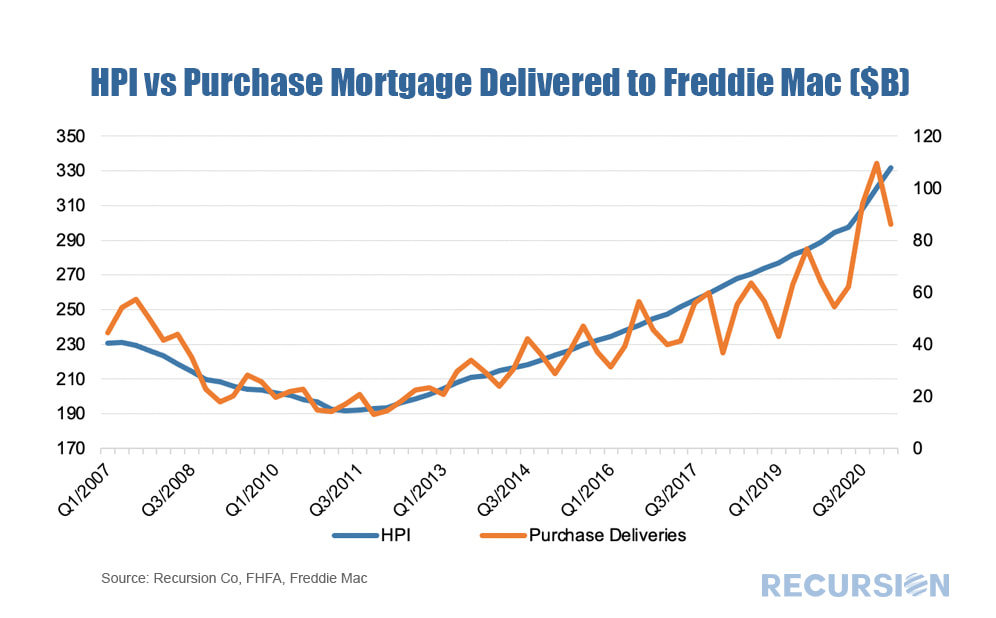 In a recent post we discussed trends in the conforming purchase market by occupancy type[1]. In this note we look at performance metrics. To begin, we look at prepayment speeds. It’s important to note that certain fees (which Fannie Mae calls LLPA’s[2] and Freddie Mac calls Credit Fees[3]) vary by occupancy type, particularly for those with high LTV’s. 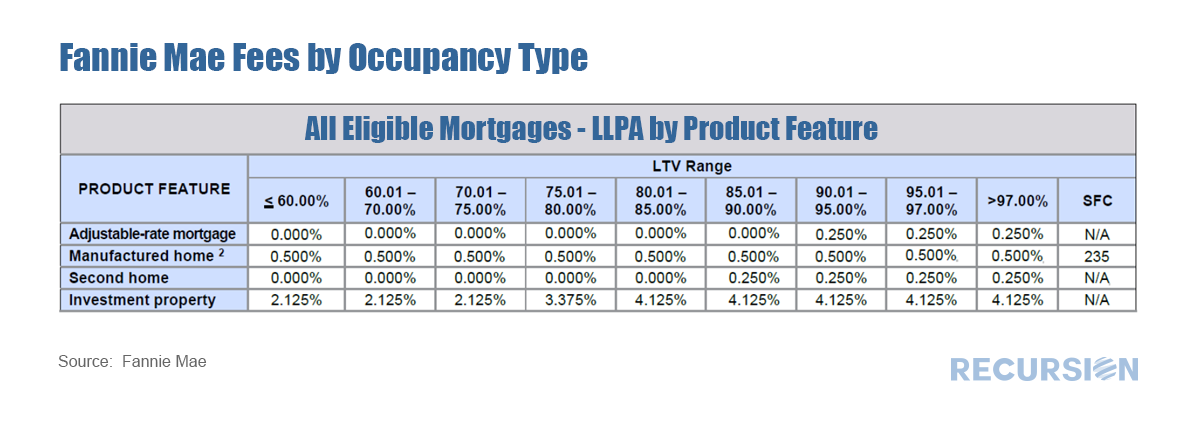 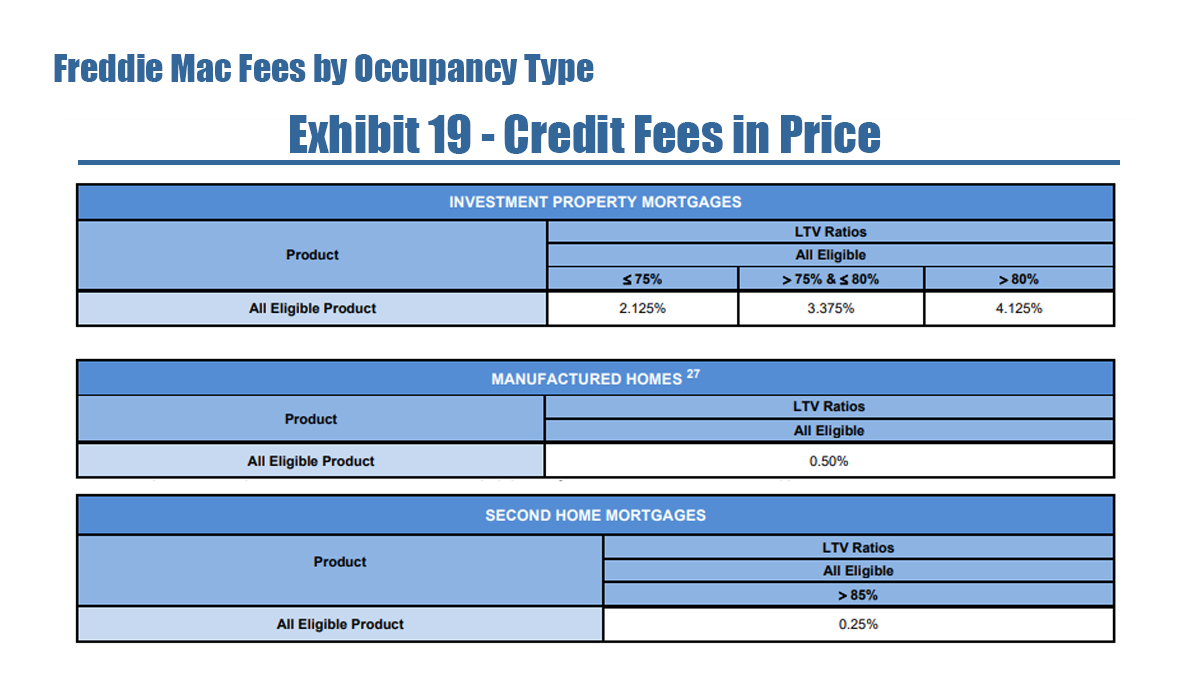  With house prices soaring to new highs on the back of pandemic-related household relocations and sub 3% mortgage rates, the natural question is how far these trends can continue. While we have no crystal ball for calling market tops and bottoms, we feel we can gain some insight into market dynamics by looking into the composition of demand. The GSE’s provide us with the ability to peer into this composition through the “Occupancy Type” flag, which consists of three types: owner-occupied, second homes and investor properties. Here we look at the share of all purchase mortgages from the last two types: 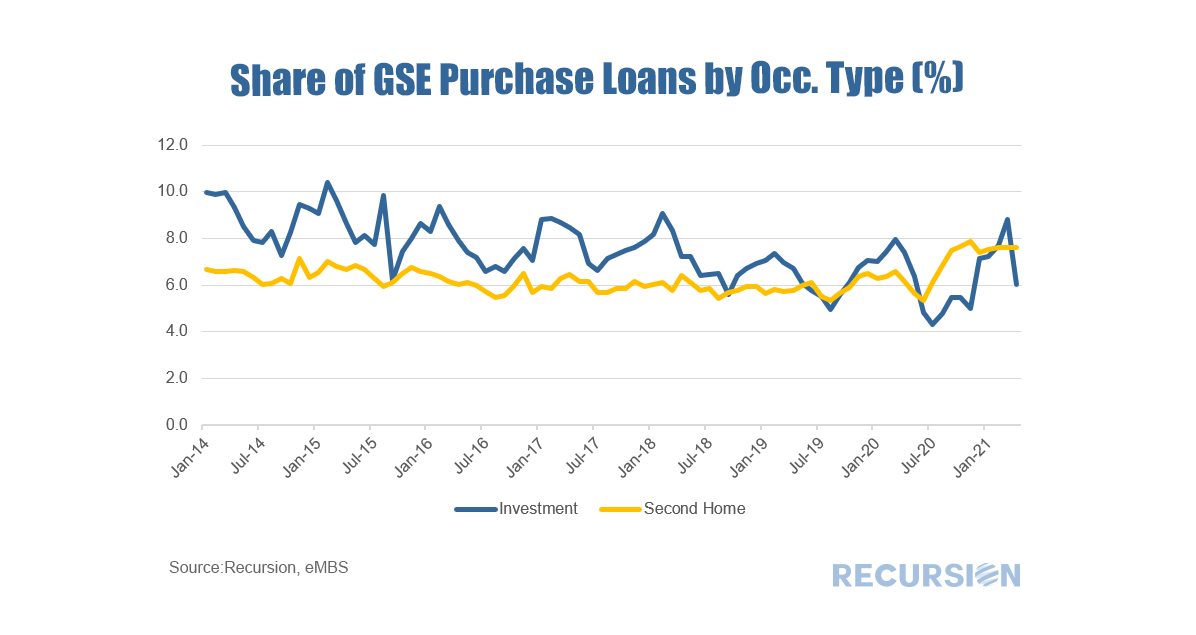 Recently, researchers at the Federal Reserve published a blog about trends in first time home buyers (FTHB)[1]. They utilize a dataset that is a 5% sample of credit files from a credit bureau. It appears from their analysis that there was a bit fewer than 5 million loans originated in 2020, so it would seem they are using a sample of around 250,000 loans. It is natural to ask how their measure of first-time home ownership compares with our calculation using Agency loan level delivery data consisting of over 4 million loans for that year. To start, we can look at the trend of purchase mortgage delivery for the past seven years: 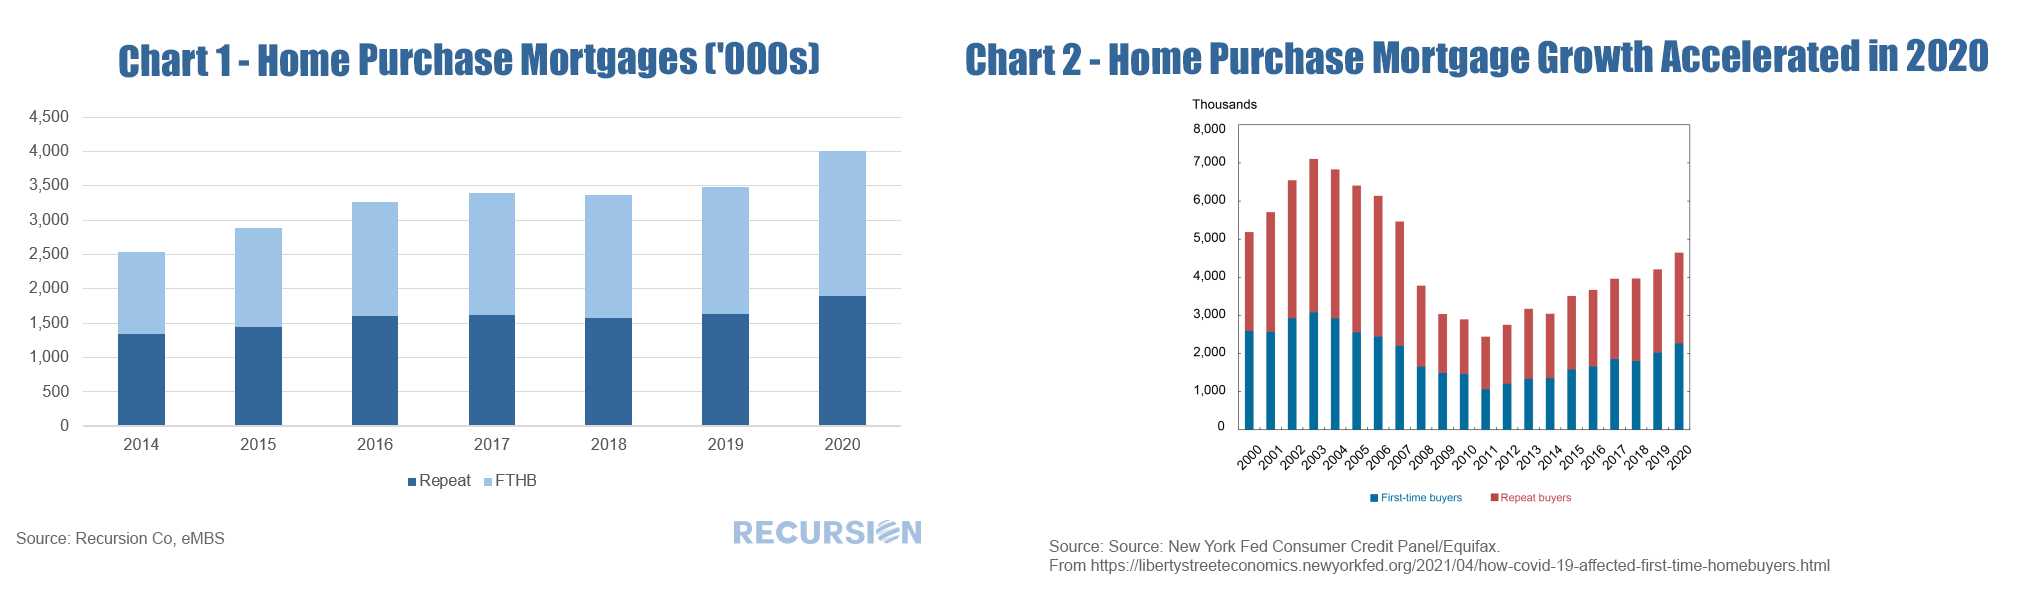 And second, we can compare estimates of first-time homeownership: 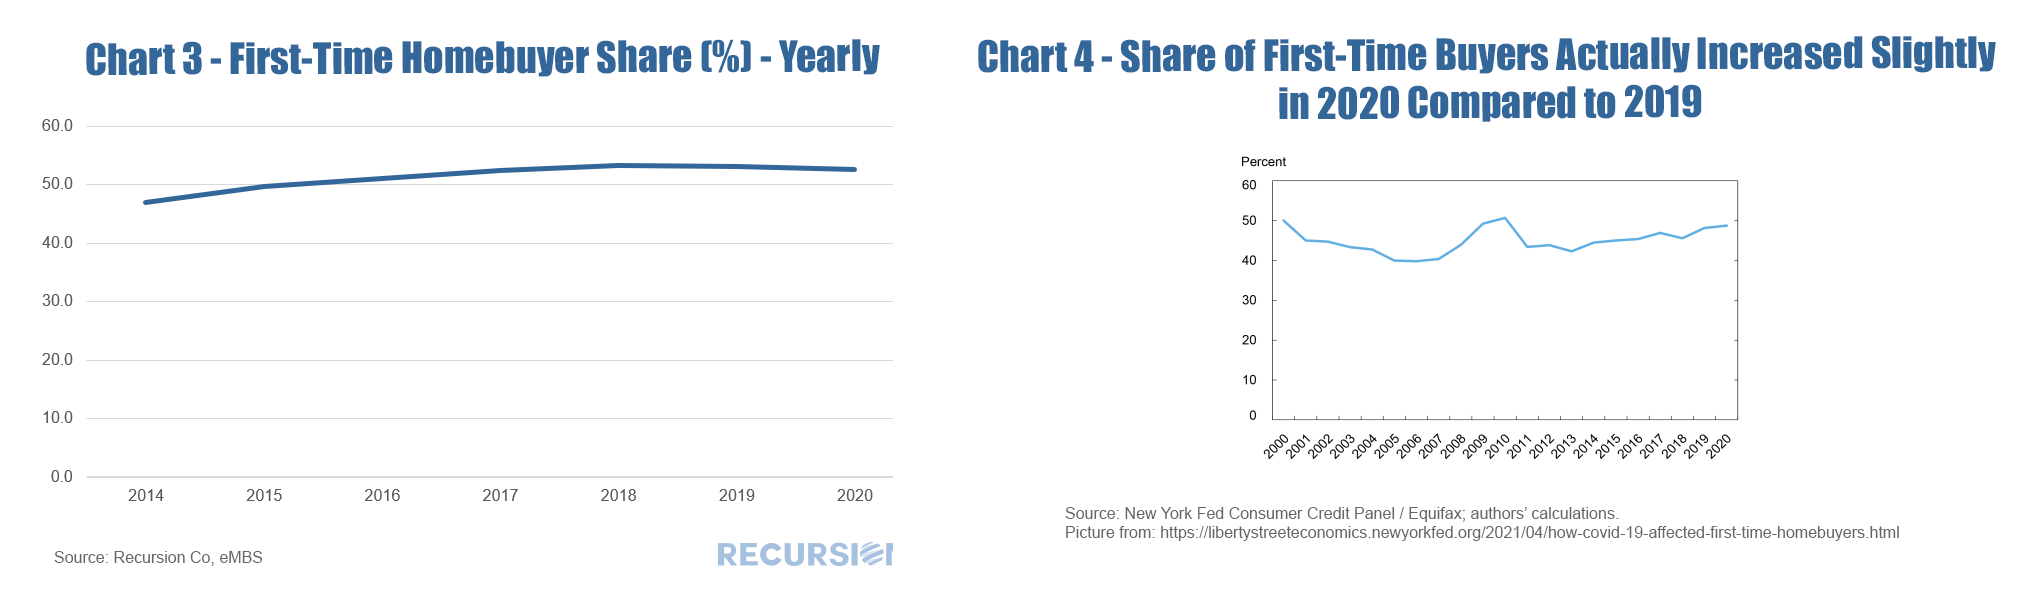 There are several distinctions to be made between the two data sets that are worth pointing out. First, the loan level delivery data only goes back through 2014 on an annual basis. Second, the Agency delivery data does not include loans originated but held on investor balance sheets, including any non-QM loans. A third difference is that the Fed researchers consider FTHB to be the first-ever mortgage file for a household while the Agencies consider a household to be “first-time” if they have not owned a house in more than three years. The number of loans delivered to the Agencies in 2020 increased by considerably more (15.1%) in Chart 1 than that from the credit bureau (10.5%) in Chart 2, which does not reflect a difference in the growth in the total number of loans originated, but rather an increase in the share of originated loans delivered to the Agencies. During Covid, investors preferred to hold mortgages with insured credit risk. This can be seen in the sharp decline seen in the “not sold” category from the recent 2020 release of HMDA data. 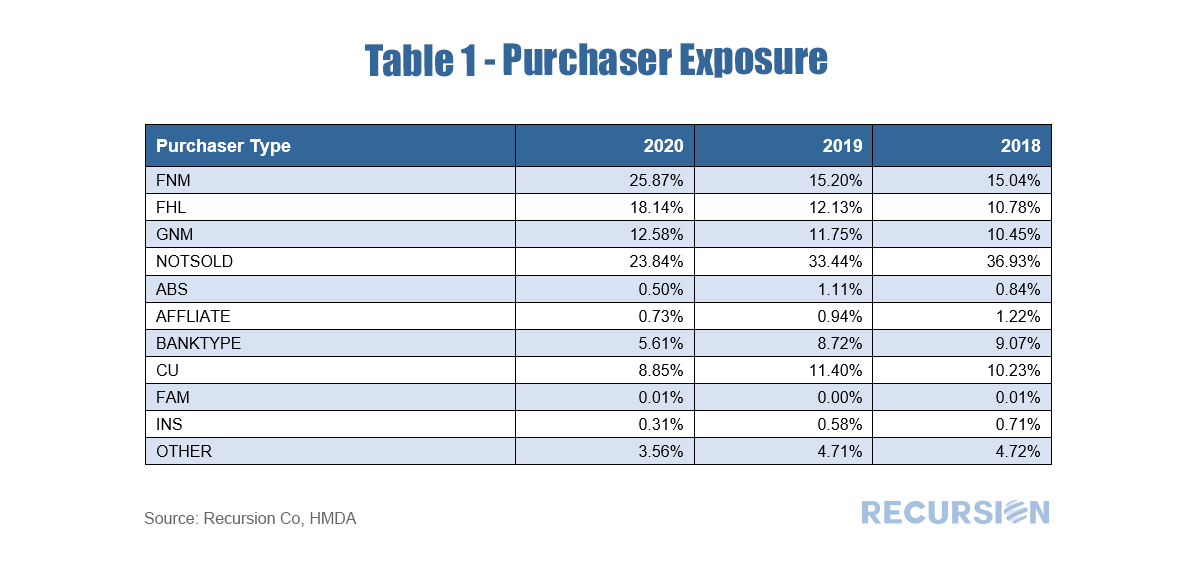 The share of FTHB in our data is slightly higher than in the Fed report, which may be due to a low FTHB share in segments such as Jumbos and non-QM loans not included in our datasets. But a key difference is that our FTHB share declined slightly in 2020 from the prior year (52.5% from 53.1%) while it rose slightly in the Credit Bureau data (48.8% from 48.2%). A rigorous attribution of the difference is beyond the scope of this note, but a few comments based on the composition of our delivery data can be made. First, in our data, the decline in the first-time homebuyer share can be attributed to a rise in the market share of conforming loans with lower FTHB shares at the expense of GNM loans with higher FTHB shares[2]. Second, our data comes in monthly so we can look a bit at the dynamics within the year: 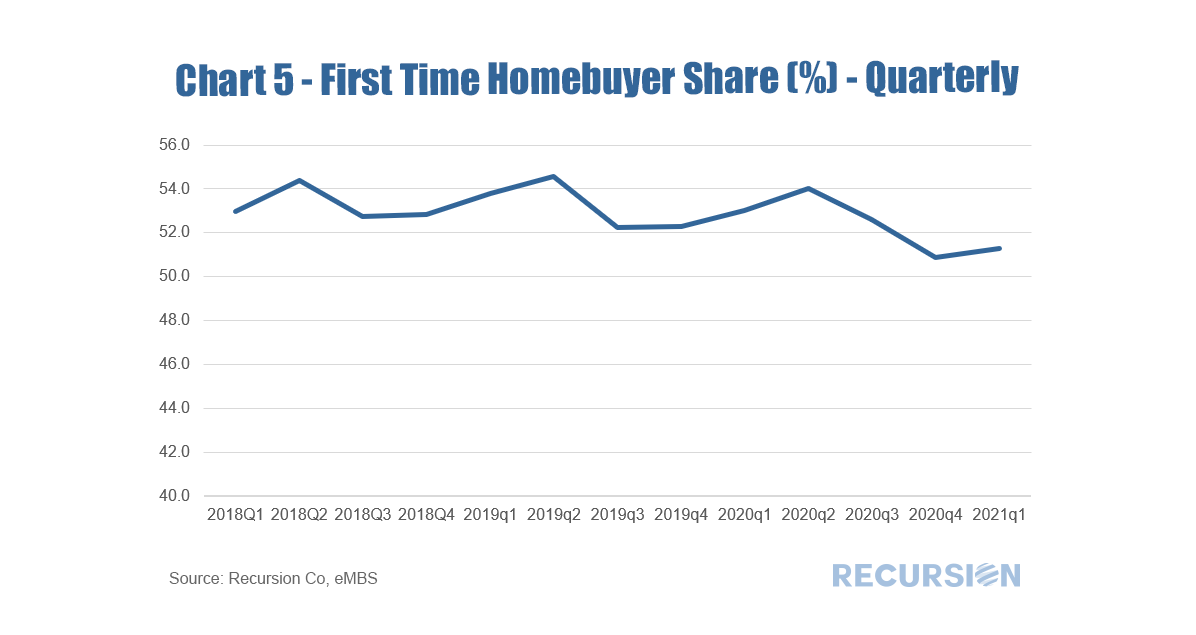 Interestingly, we show the FTHB share picked up in a normal seasonal pattern in 2020 Q2 and Q3, when the pandemic hit with full force. However, in Q4 the share declined to pre-pandemic levels, and rebounded only slightly in the first half of this year. It will be very interesting to monitor these trends going forward. |
Archives
July 2024
Tags
All
|
 RSS Feed
RECURSION |
|

Copyright © 2022 Recursion, Co. All rights reserved.