|
Last week’s announcement by FHFA of elaborate changes in the GSE’s upfront fee matrixes to be implemented in May[1] reminded us that this is just the latest in a series of announcements made by the housing regulator over the past year. Just over a year ago, FHFA announced fee hikes for second homes and high balance loans.[2] At the time, we looked at the impact of the second home fee hike on the market through the lens of the relative impact compared to investor properties, which did not experience such an increase. To complete the picture, here is a chart for high-balance loans: 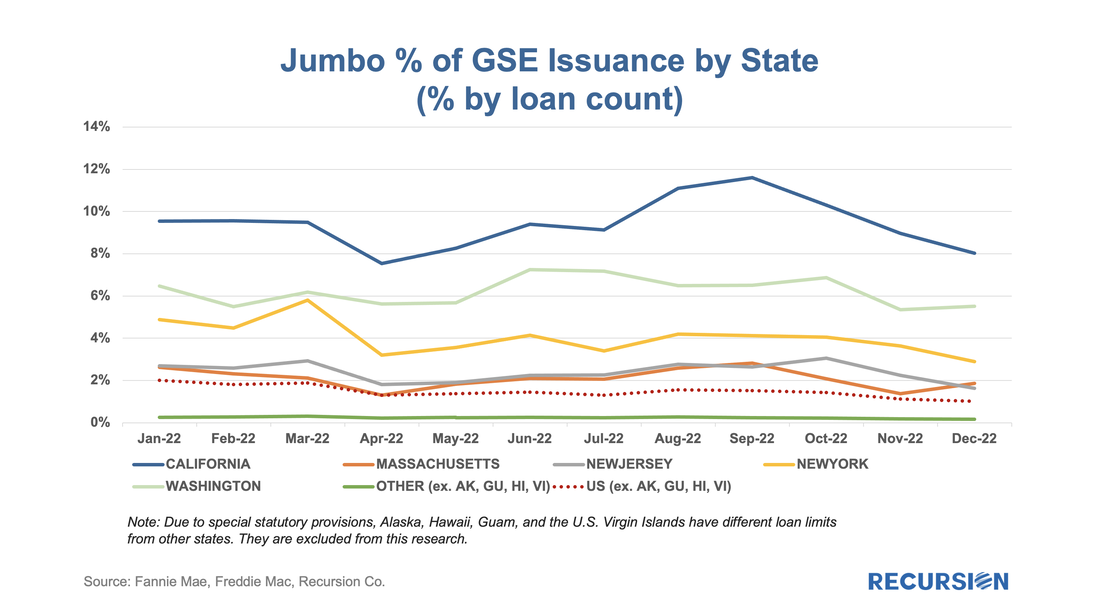 Over the past couple of years, we’ve witnessed some volatility with regards to FHFA’s approach to mortgages on second homes and investor properties (sometimes referred to non-owner occupied housing or NOO). In January 2021, FHFA announced that caps would be imposed to limit the acquisitions of loans backed by second homes and investment properties to 7% of the total on a rolling 52-week basis[1]. These caps were then suspended in September of that year. Then, on January 5, 2022, FHFA announced targeted fee hikes on second home mortgages and jumbo mortgages on loans delivered to Fannie Mae and Freddie Mac, to be implemented on April 1, 2022[2]. These up-front fees are tiered by LTV and for second home mortgages range from 1.125% and 3.875% and for high balance loans range from 0.25% and 0.75%. Borrowers in special affordability programs[3] are excluded from these fees, as are first-time homebuyers in high-cost areas whose incomes fall below 100% of the area median income. To see what if any impact these fee hikes have had on the targeted market segments, we look first at the share of conventional loans broken into second homes, investment homes and others, as measured by loan count. 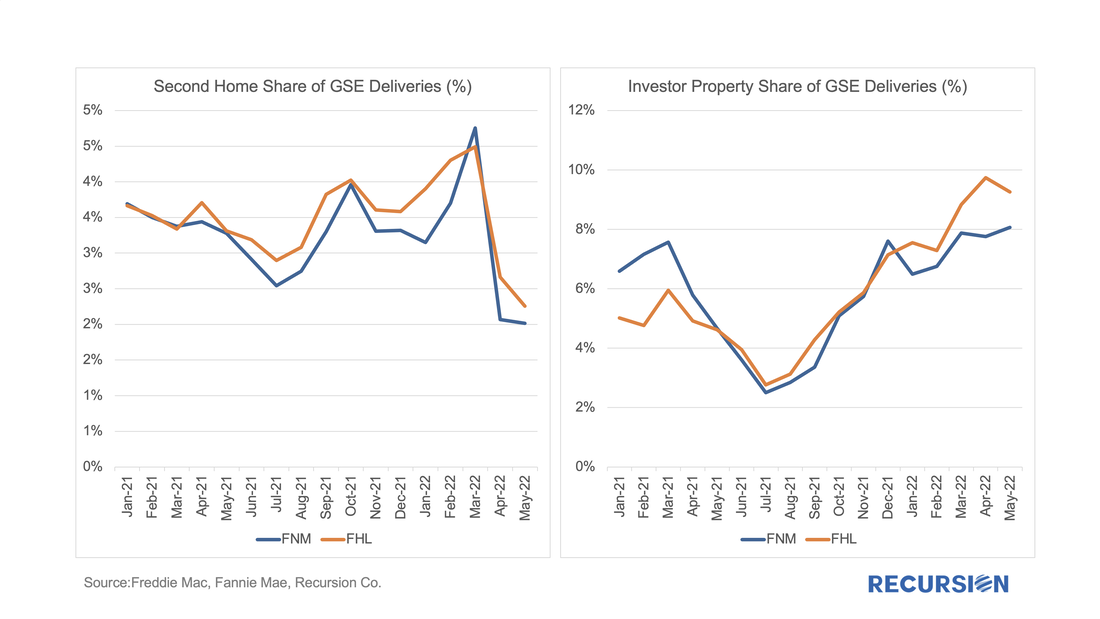 In a recent post[1], we discussed findings obtained with the recent release of 2021 HMDA data. Among other things, we looked at the share of mortgage originations by income group and product type. In this note, we look at the difference in lending patterns between the banks and nonbanks. The incentive behind this approach is policy driven. There is a long history of measures taken to encourage lenders and builders to foster economic development in low-income areas via the housing market. For example, the Community Reinvestment Act (CRA) stipulates that a bank’s performance with regards to compliance of their regulatory requirements depends in part on: “the geographic distribution of loans—that is, the proportion of the bank's total loans made within its assessment area; how these loans are distributed among low-, moderate-, middle-, and upper income locations[2]” To assess this issue, we assign a flag to each of the census tracts designated by HUD as having a greater than 51% share of households with incomes in the Low-to-Moderate (LMI) range in the larger MSA the tract is part of[3], which are called LMI area by HUD, or “low income” tracts by FHFA. Below find a chart of the 10-year trend in the share of loans originated in this category by institution type for conventional and FHA loans: 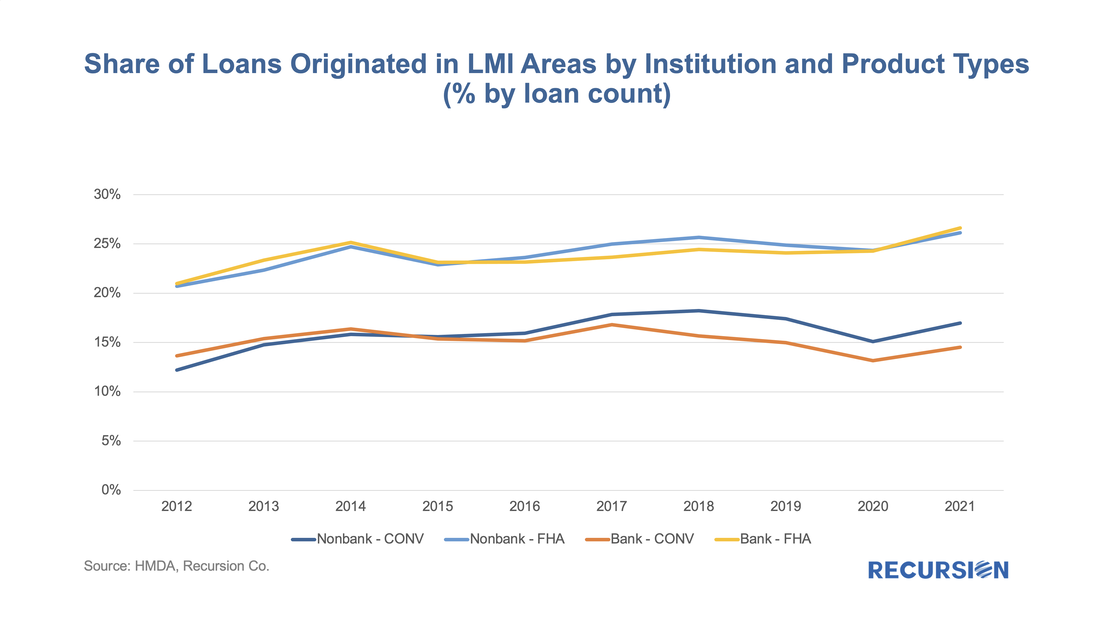 On December 30, 2021, FHFA announced that the baseline conventional loan limit for 2022 would rise by $98, 950 to $647,200.[1] The new ceiling for high-cost areas is set at 150% of the baseline limit or $970,800. Since loan limits apply when they are delivered to the agencies, not when they are originated[2], it would be of interest to look at the pace at which loans reaching to the new limit are delivered at the start of the year. The chart below shows the distribution of mortgages delivered to the GSE’s in Q1 2021 by loan size($K). 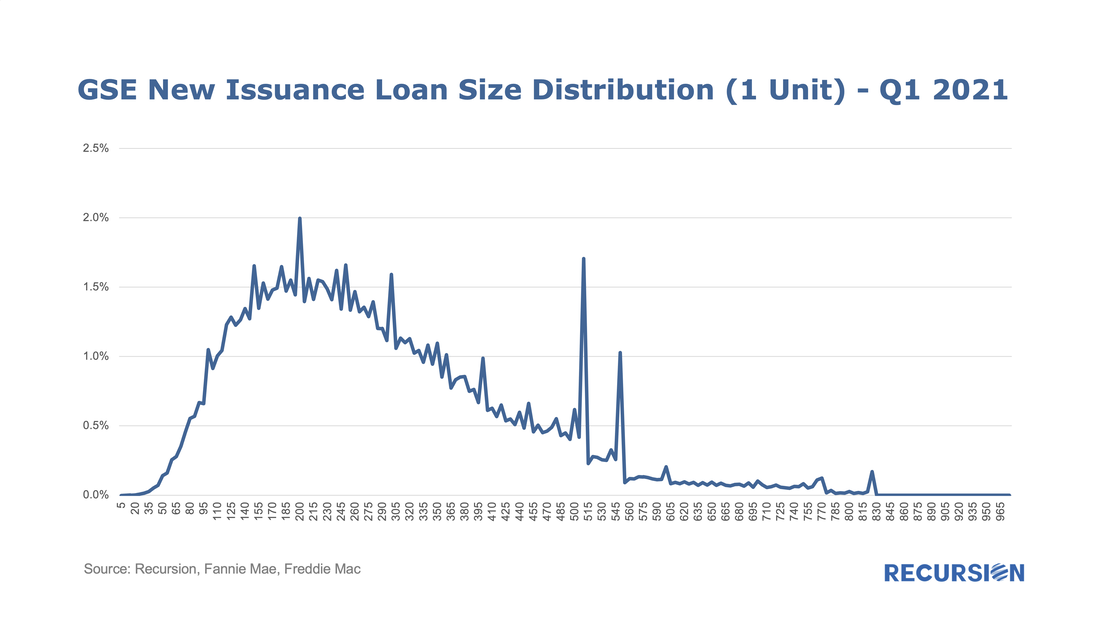 In a recent post, we discussed the market impact that arose from the imposition, and subsequent reversal, of limits on deliveries of NOO (non owner-occupied) residences, as well as on deliveries via the cash window, to the GSEs[1]. In summary, it discussed how the imposition of limits resulted in declines in the share of the NOO categories in the summer, with some rebound in evidence in Q3 when these were rescinded. In this exercise, we look at the change in the share of purchase mortgage deliveries to both Enterprises from the same quarter in the prior year. This is done to eliminate the seasonal pattern that is in evidence in these shares that derive from the fact that owner-occupied purchases tend to have a strong seasonal pattern (peak in the spring) while the NOO categories do not. If the suspension of the constraints in September 2021 were binding, we would expect to see a jump in the share in the NOO categories in Q4. This is certainly the case for investment properties: 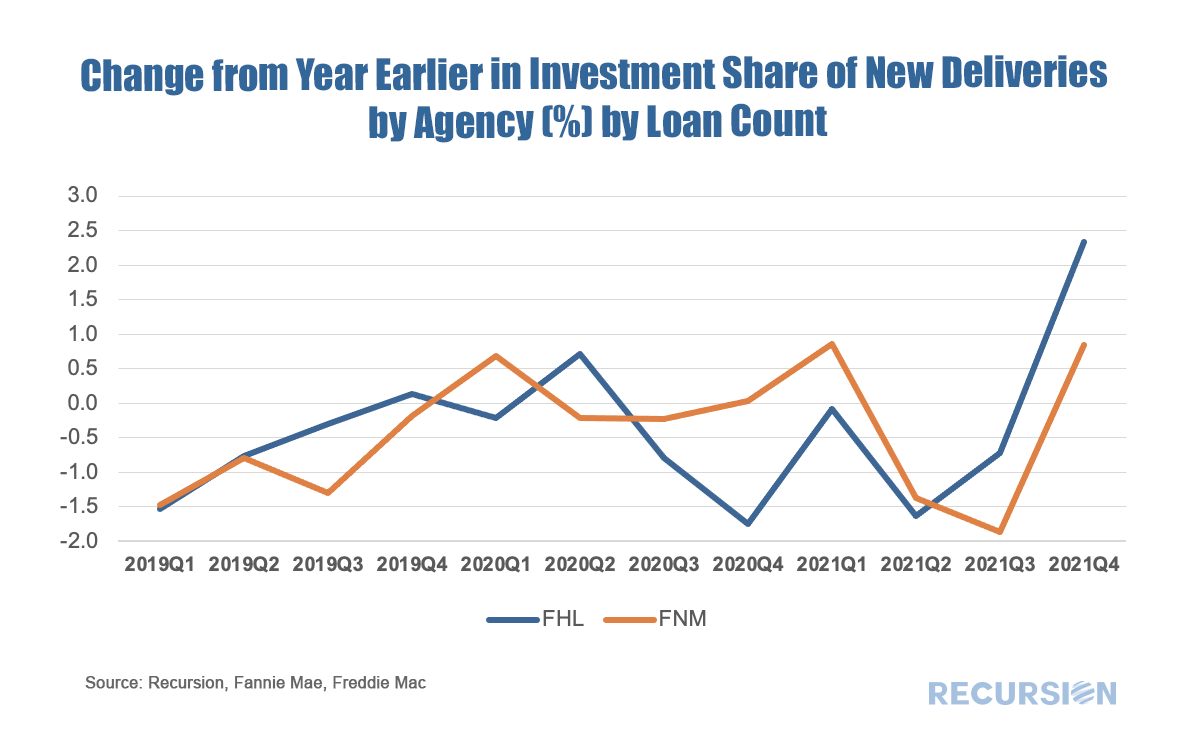 In a recent post[1], we looked at the share of the use of the cash window for bank and nonbank sellers. We found a reversal in the long-term upward trend in this share this year, correlated with the imposition of FHFA imposed lender-level caps on the use of the cash window. We next turn to performance. We look below at prepayment speeds for the 2018, 2019 and 2020 cohorts broken down by bank and nonbank sellers. 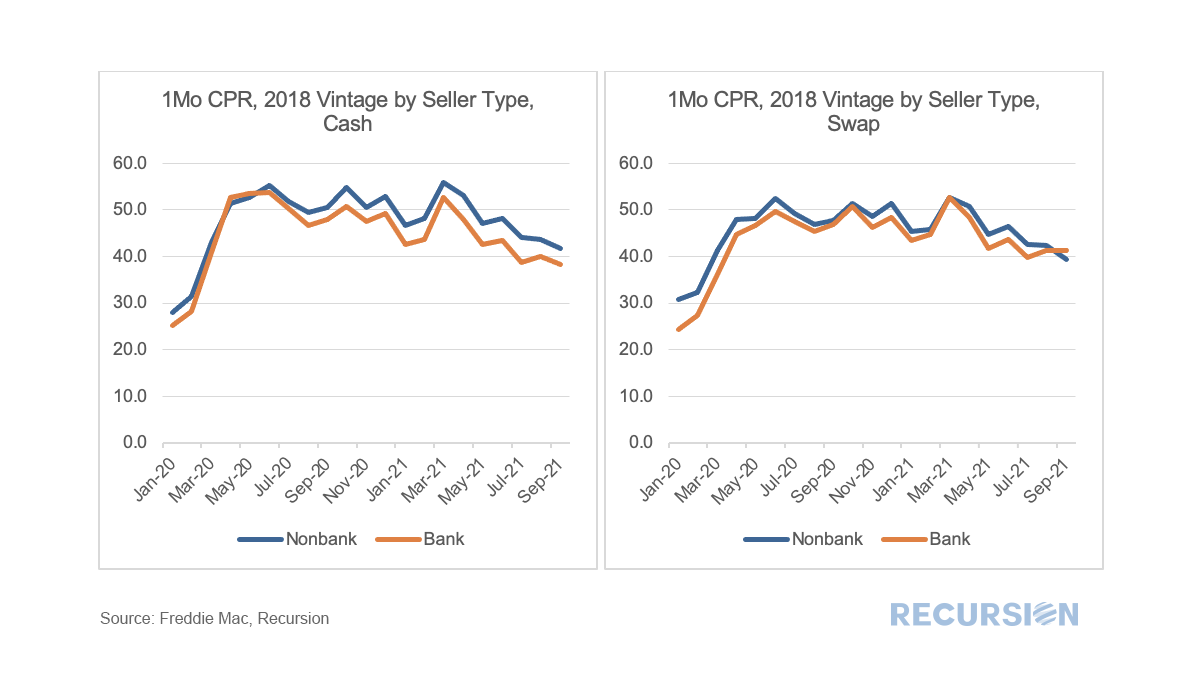 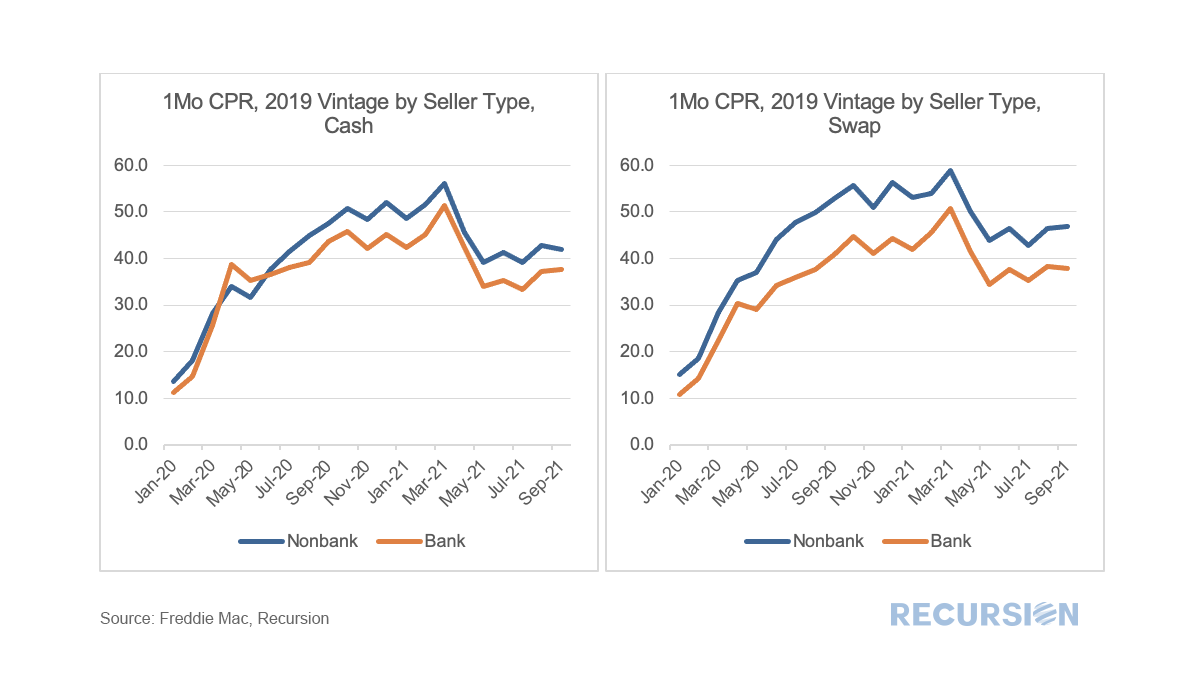 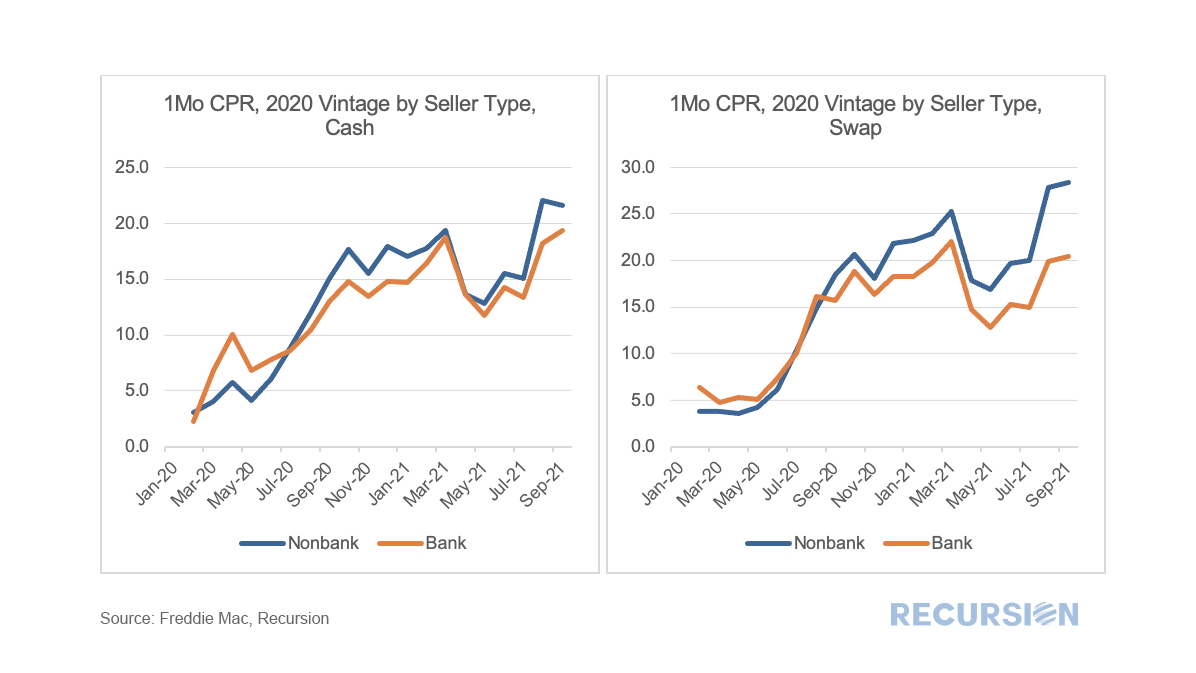  Recursion is teaming up with Lincoln Institute of Land Policy and Rice University to work on the Underserved Mortgage Markets Coalition project and the Social Policy Analysis Capstone Course (“SOPA”).
It’s always interesting to look at the underlying dynamics within the mortgage market to get a deeper handle on the forces behind recent trends and to gain insights into the market impact of policy changes. This time we will look at a breakdown of the market between the cash window and swaps. Simply, in a swaps transaction the lender sends loans to one of the Enterprises, Fannie Mae or Freddie Mac, and in return obtains a security which it can keep as an investment (mostly in the case of banks) or else sell into the market (both banks and nonbanks). The alternative is to sell the loans directly to the Agencies for cash. This is important to nonbanks in particular as this cash is used as a funding source for running their businesses. As it turns out, neither GSE reports the path by which a loan is obtained in their loan-level disclosures. However, in the case of Freddie Mac, cash loans are placed in their own pools with distinct prefixes. As a result we can unpack these pools and perform a matching exercise with the loan tape and assign these accordingly. This allows us to perform queries on this characteristic across our loan-level querying tool Cohort Analyzer. Below find the share of deliveries made to Freddie Mac from the Cash Window by loan purpose. 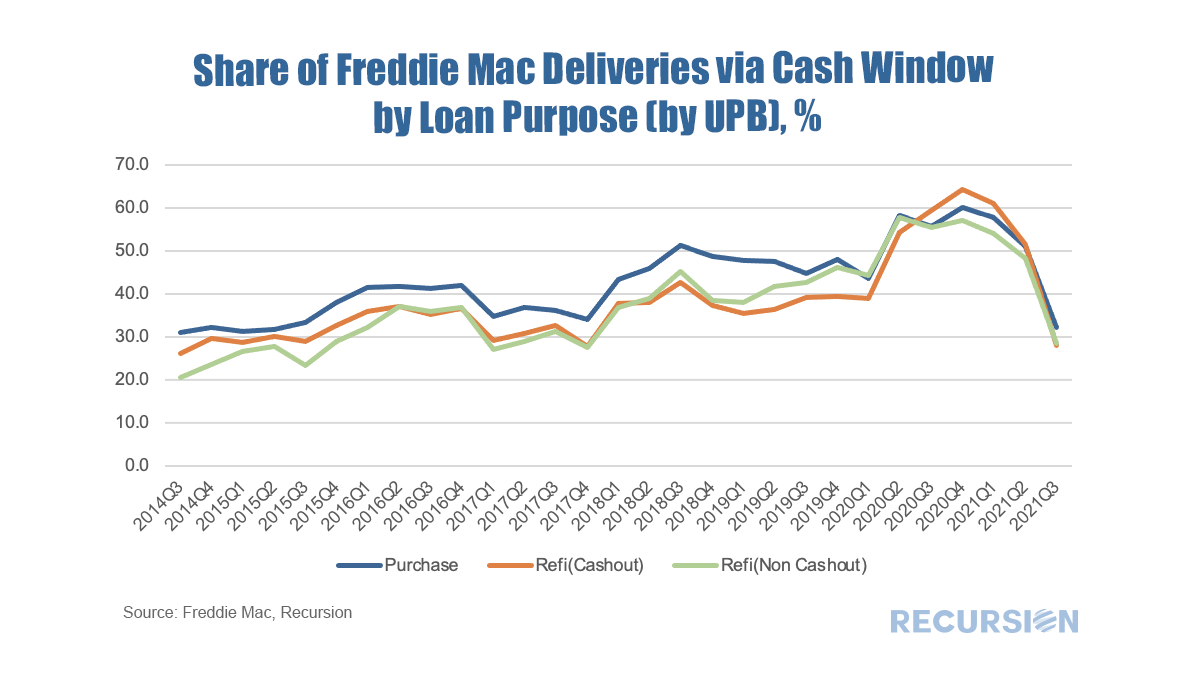 |
Archives
July 2024
Tags
All
|
 RSS Feed
RECURSION |
|

Copyright © 2022 Recursion, Co. All rights reserved.