|
It’s always interesting to look at the underlying dynamics within the mortgage market to get a deeper handle on the forces behind recent trends and to gain insights into the market impact of policy changes. This time we will look at a breakdown of the market between the cash window and swaps. Simply, in a swaps transaction the lender sends loans to one of the Enterprises, Fannie Mae or Freddie Mac, and in return obtains a security which it can keep as an investment (mostly in the case of banks) or else sell into the market (both banks and nonbanks). The alternative is to sell the loans directly to the Agencies for cash. This is important to nonbanks in particular as this cash is used as a funding source for running their businesses. As it turns out, neither GSE reports the path by which a loan is obtained in their loan-level disclosures. However, in the case of Freddie Mac, cash loans are placed in their own pools with distinct prefixes. As a result we can unpack these pools and perform a matching exercise with the loan tape and assign these accordingly. This allows us to perform queries on this characteristic across our loan-level querying tool Cohort Analyzer. Below find the share of deliveries made to Freddie Mac from the Cash Window by loan purpose. 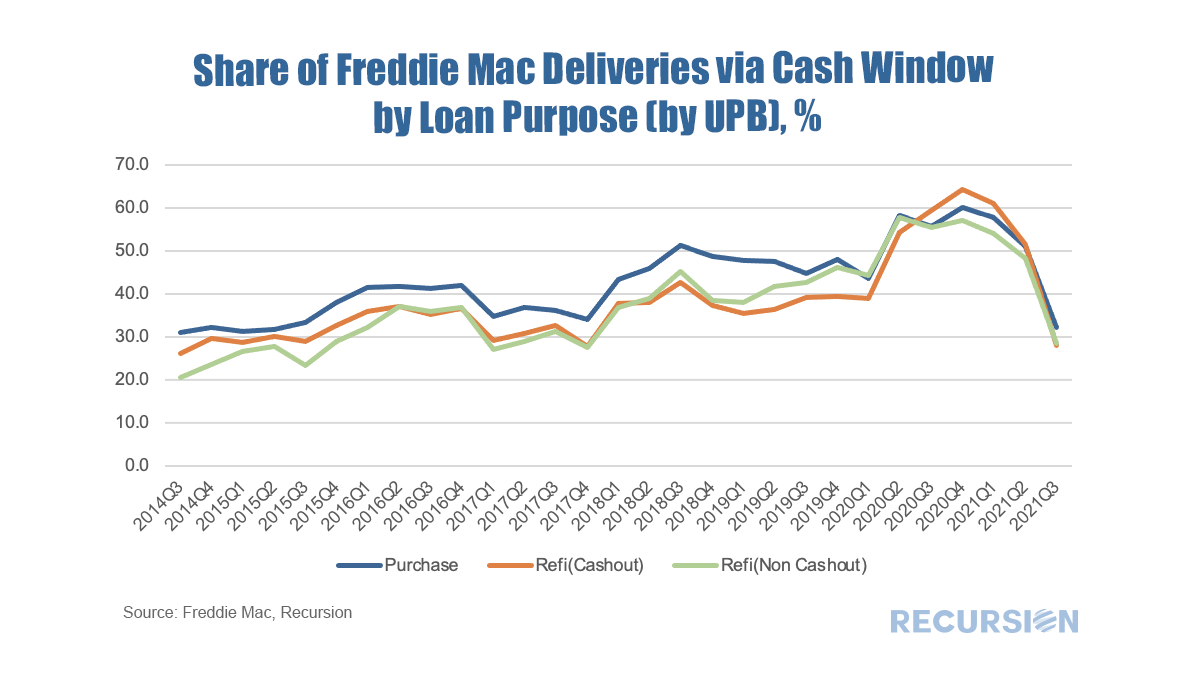 There are several distinct observations that jump out right away. First, the cash share was in a modest trend rise in the five-year period prior to the onset of the Covid-19 pandemic. During that period, the share for purchase loans tended to be slightly higher than for other loan purposes. With the onset of the pandemic, the share of cash window deliveries soared for all loan purposes, but then flattened out late last year before dropping sharply so far in 2021. Given the statement up front about the cash window being particularly useful to nonbank lenders, it follows naturally to break the market down by lender type. 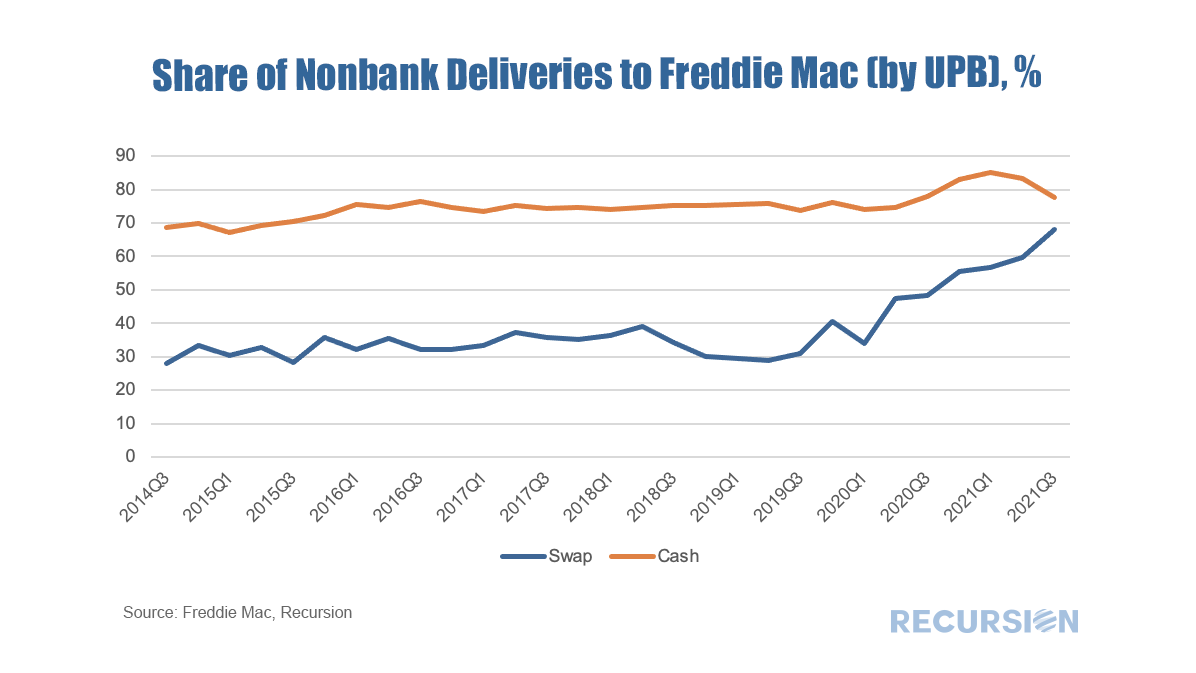 We have previously discussed the upward trend in the share of nonbank deliveries in the years 2014 to 2019 leading up to the pandemic[1]. Interestingly, it appears that this was not so much due to an increase in the share within either of the swap or cash delivery vehicles. but instead was due to their greater weight in the delivery vehicle that was gaining share: the cash window. However, the surge and then the steep fall of the cash window share in recent months has received less attention. On January 14 this year, FHFA amended the terms of the Stock Purchase Agreements for the GSEs[2]. This included the statement “… to ensure that the cash window is for the benefit of community lenders, each GSE will limit volume purchased through the cash window to $1.5 billion per lender during any period comprising four calendar quarters.” This corresponded quite closely to the start of the drop-off in the cash share. More recently, on September 14, FHFA suspended these limits, pending further review[3]. There are, of course many ways to slice and dice this data, but an interesting perspective on these developments can be found by breaking down the nonbank share by distribution channel. 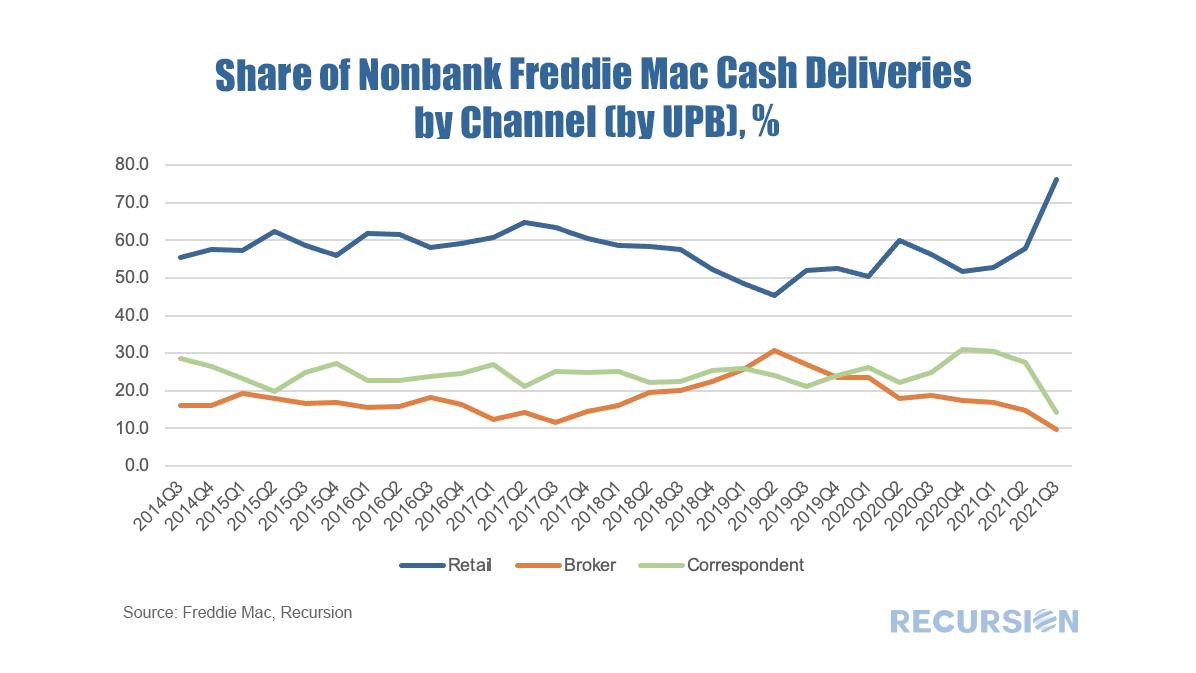 With limits imposed on cash window transactions, it’s perhaps not surprising to see the Broker and Correspondent channels struggling against a robust Retail market. Of course, future developments in these trends depends critically on the outcome of FHFA’s review. This story serves to underscore our theme that successful investment in the MBS market is not just a matter of developing solid performance models, but also depends crucially on having a robust framework for thinking about policy. |
Archives
July 2024
Tags
All
|
 RSS Feed
RECURSION |
|

Copyright © 2022 Recursion, Co. All rights reserved.