|
On April 11, NPR cited Recursion data in a story about VA policies designed to assist distressed borrowers[1]. Last year, VA terminated its forbearance program, leaving borrowers vulnerable to foreclosure. In November, VA initiated a foreclosure moratorium, and on April 10, the Veterans Affairs Servicing Purchase (VASP) program was announced[2]. Recursion data was cited by the reporters to show that interest rates of newly modified VA mortgages are higher than those currently in the forbearance program. 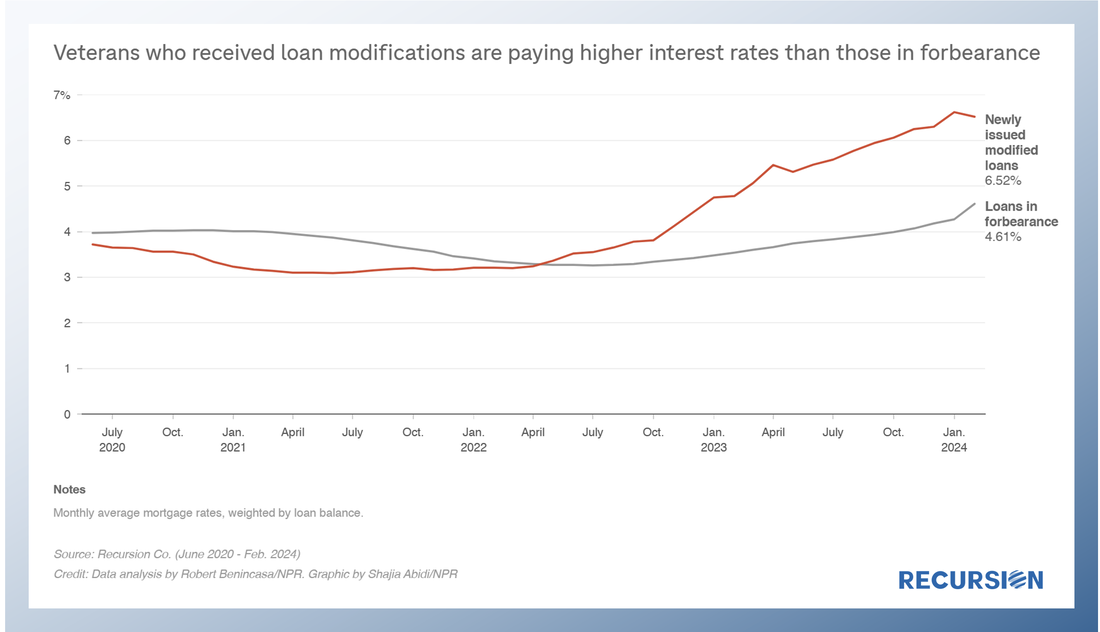 In a recent post[1], we discussed the disposition of loans that are exiting forbearance programs. In the Ginnie Mae programs, many loans bought out of pools have received modifications or other workouts, and then redelivered to Ginnie Mae pools. However, we have historically observed that there are more loans bought out than re-delivered, even considering the time needed for the workout. As it turns out, there are other market-based outlets for these loans, which is more evident at the issuer level than in aggregate. Below find a chart of buyout and securitization activities within Ginnie Mae program for Lakeview, the third-largest Ginnie Mae servicer as of April 2022. 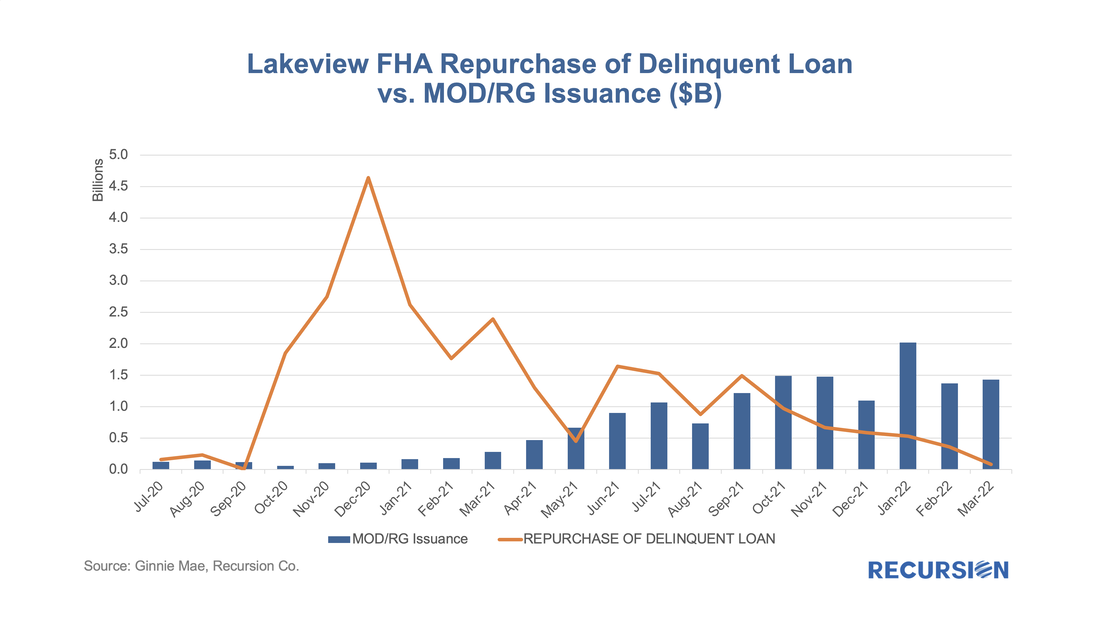 With the expiration of forbearance programs underway, there is an interesting question about how loans exiting these programs will perform once they are resecuritized. For Ginnie Mae programs, these are either loans that exit forbearance with a partial claim or receive a permanent mod under the various waterfall options in the FHA or VA programs. In our previous blogs[1], we have noted MOD and RG loans are becoming a significant portion of loans delivered to newly issued Ginnie Mae pools. 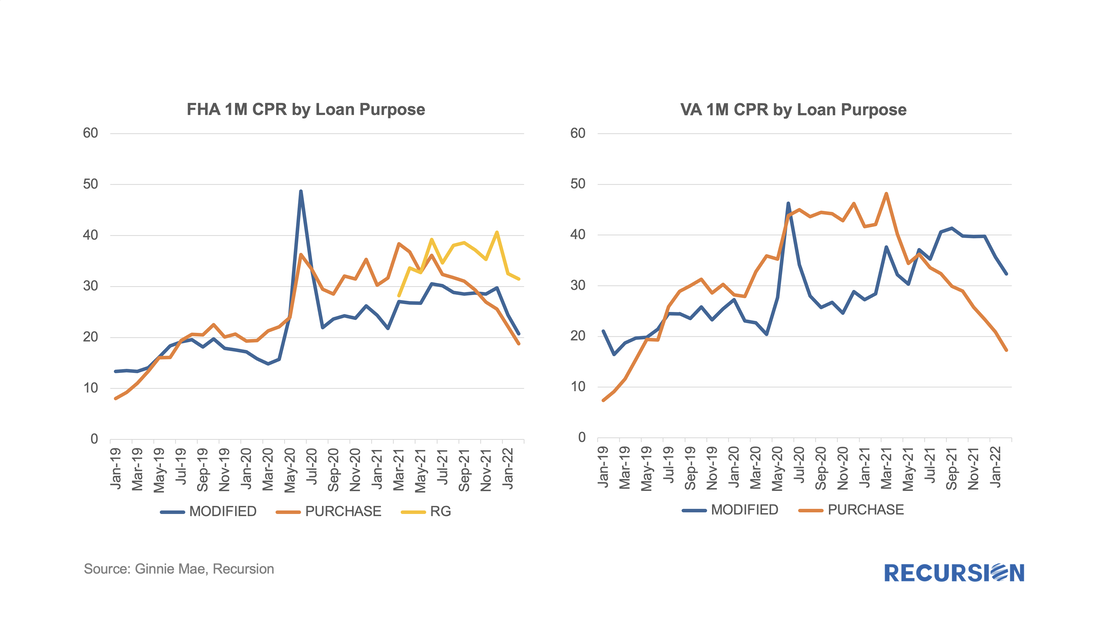 Tracking the Disposition of GSE Loans in Forbearance: Borrower Assistant Plan Transitioning3/15/2022
In a recent post, we mentioned that the 24-month timeline for the purchase of delinquent loans out of pools implied that this activity would not pick up until April 2020[1]. However, some leading indicator of loan disposition was available through the release of trial modification data in the Borrower Assistance Plan (BAP) field released in the monthly Agency disclosures. Once loans have completed three months of successful payments in this plan, they are eligible to be purchased out for the commencement of a permanent modification, and eventual resecuritization. A loan in trial modification plan (trial mod) can transit into the following state the next month:
The number of loans in these programs continues to grow, standing at 37,957 in February 2022, with a balance of about $8.3 billion, up from 9,911 and $2.1 billion in March 2021. The evolution of the disposition of loans is shown in the following chart: 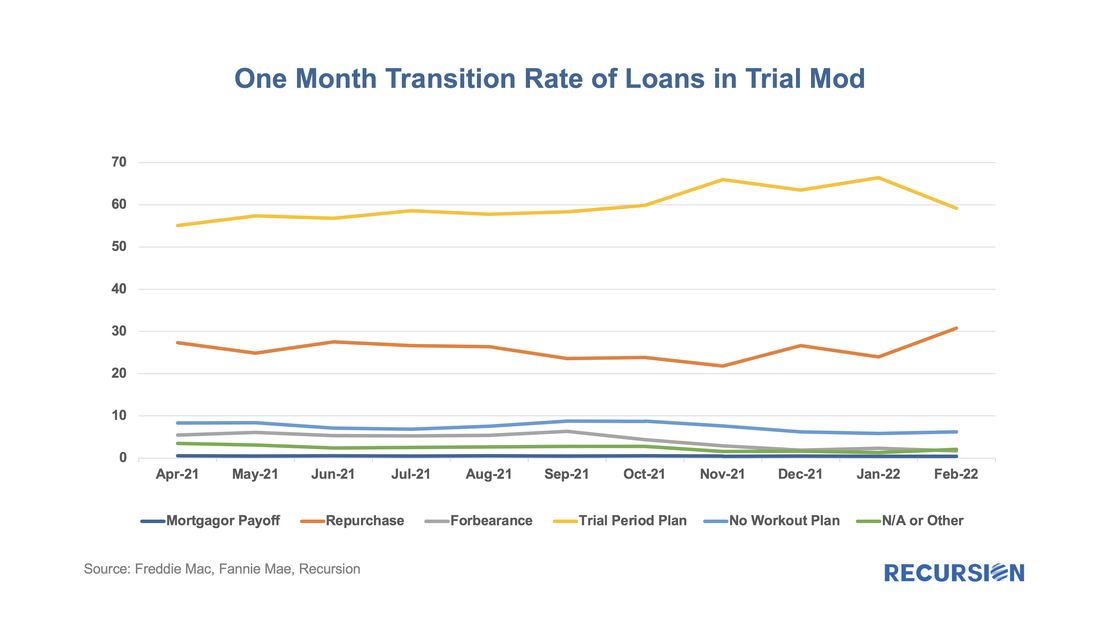 In a recent post, we discussed the utility of secondary market indicators to track the progression of loans that are coming out of forbearance in Government programs[1]. This short note looks at this progression in the conforming loan market. For the Ginnie Mae programs, issuers may buy loans out of pools after they are delinquent more than 90 days and begin a workout process that culminates in one of the options, including loan modification. The situation is quite a bit different for Fannie Mae and Freddie Mac. The main distinction is that on January 1, 2021, the GSEs extended their timeline for buying loans out of pools to 24 consecutive months of missed payments[2]. As the Covid-19 pandemic began in March 2020, we expect to see buyouts being extended as much as to April and May this year. However, we can obtain a view on future loan modifications through the trial mod flag in the borrower assistance plan field in the monthly disclosures the GSEs started to release in March, 2021. In order to obtain a permanent modification, borrowers must first successfully complete a three-month trial modification plan[3]. Below find the progression in the number of loans in such plans since March 2021: 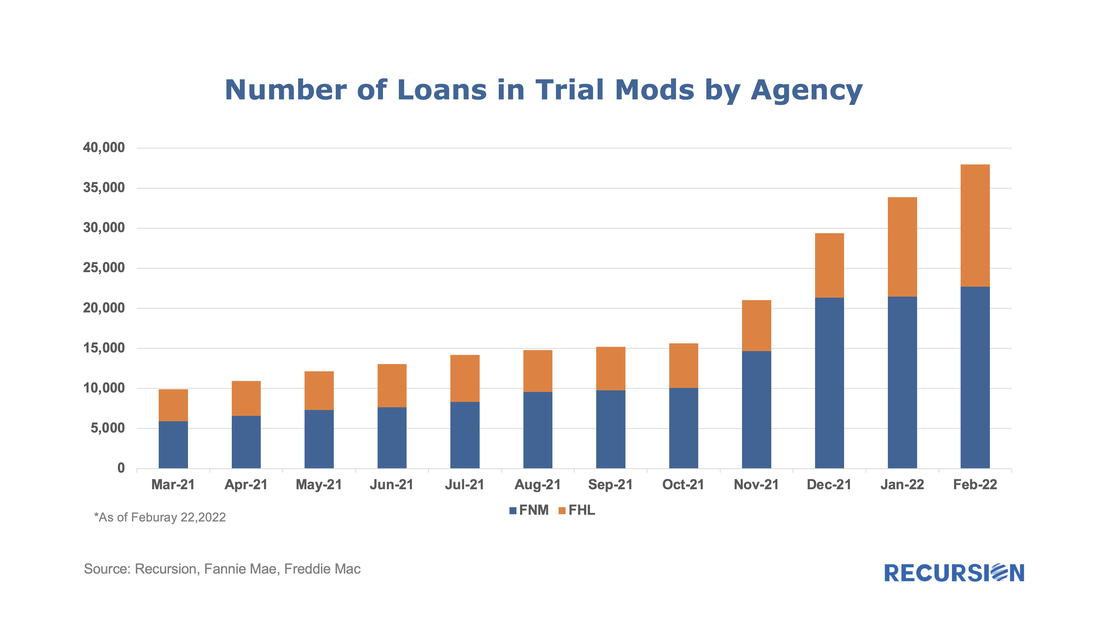 In a fine recent paper, the Federal Reserve Bank of Philadelphia “highlights the immediacy of the challenges facing mortgage servicers and policymakers” that arise from the resolution of mortgage forbearance and delinquencies[1]. As of the time of writing, the Philly Fed stated that “some 2.73 million mortgages are either in forbearance or past due; about 0.78 million of those are in Coronavirus Aid, Relief, and Economic Security (CARES) Act forbearance plans”. In addition, “about 47 percent of loans in forbearance will expire in the first quarter of 2022; another 42 percent will expire in the second quarter”. They go on to discuss recent trends and provide data on income and demographics of these borrowers.
The point of this brief article is to look at secondary market indicators to shed additional light on these issues. The note is broken into two parts, the first looks at Government programs, notably FHA and VA, while the second looks at the GSEs. In a recent post[1], we discussed the various factors behind the elevated pace of prepayments in Ginnie Mae securitized pools relative to those in conventional pools. A key driver of the difference in speeds is the different incentives facing Ginnie Mae program servicers regarding loan buyouts on one hand and those facing the GSE’s on the other. In the first case, the economics of the transaction are often favorable for servicers with cash available to purchase loans out of pools while the GSE’s take a more balanced view of the interests of servicers and investors.
The key regulation driving GSE behavior in this regard is the September 30, 2020 statements by the Enterprises extending the timeframe for delinquent loan buyouts from four consecutive months to twenty four consecutive months[2]. While forbearance was not explicitly mentioned in these announcements, there is clearly a connection between this timeframe and that of the duration of the forbearance programs. For conventional loans that entered a plan prior to February 28 2021, borrowers have a maximum 18 months of forbearance available to them[3]. Since the biggest share of loans in forbearance took place in Q2 2020, that 18 month period is running out for many. As borrowers work with their servicers to consider their options, loan buyouts should start to pick up in coming months as distressed borrowers pursue loan modifications or enter into foreclosure proceedings. In addition, distressed borrowers with equity in their homes may choose to sell their properties, leading to a pickup in voluntary prepayments. Over the past six months, prepayment speeds of Ginnie Mae securities have notably widened against those of the GSEs. 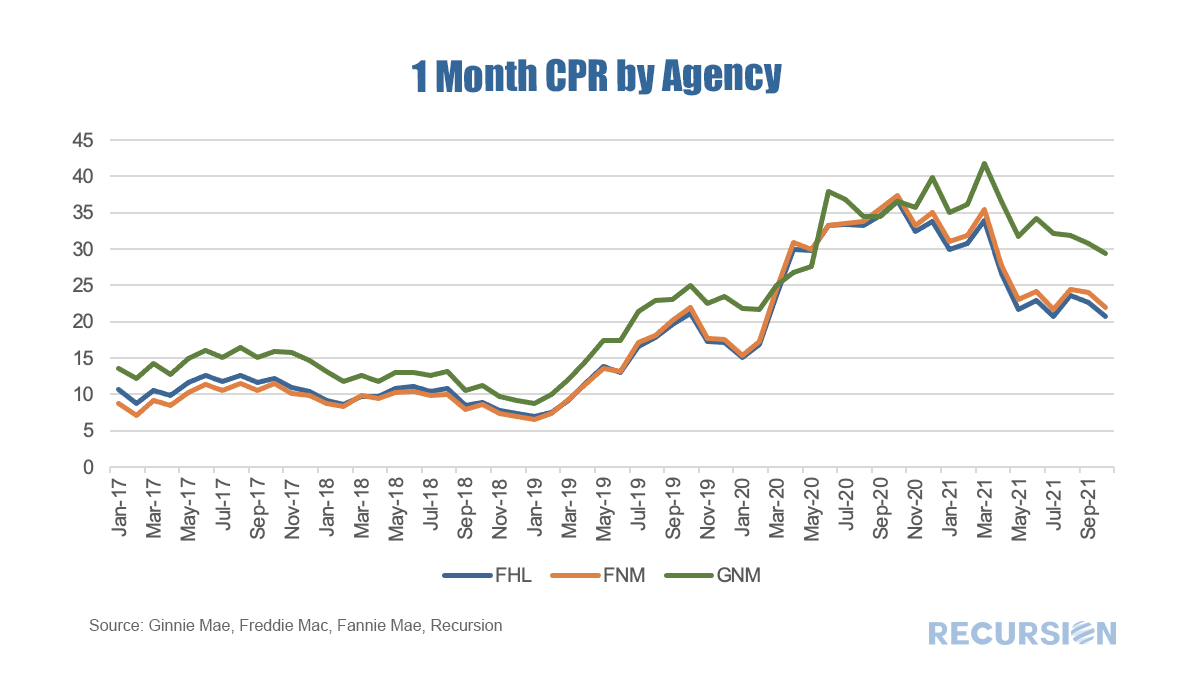 |
Archives
July 2024
Tags
All
|
 RSS Feed
RECURSION |
|

Copyright © 2022 Recursion, Co. All rights reserved.