|
In a recent post[1], we discussed the various factors behind the elevated pace of prepayments in Ginnie Mae securitized pools relative to those in conventional pools. A key driver of the difference in speeds is the different incentives facing Ginnie Mae program servicers regarding loan buyouts on one hand and those facing the GSE’s on the other. In the first case, the economics of the transaction are often favorable for servicers with cash available to purchase loans out of pools while the GSE’s take a more balanced view of the interests of servicers and investors. The key regulation driving GSE behavior in this regard is the September 30, 2020 statements by the Enterprises extending the timeframe for delinquent loan buyouts from four consecutive months to twenty four consecutive months[2]. While forbearance was not explicitly mentioned in these announcements, there is clearly a connection between this timeframe and that of the duration of the forbearance programs. For conventional loans that entered a plan prior to February 28 2021, borrowers have a maximum 18 months of forbearance available to them[3]. Since the biggest share of loans in forbearance took place in Q2 2020, that 18 month period is running out for many. As borrowers work with their servicers to consider their options, loan buyouts should start to pick up in coming months as distressed borrowers pursue loan modifications or enter into foreclosure proceedings. In addition, distressed borrowers with equity in their homes may choose to sell their properties, leading to a pickup in voluntary prepayments. By extending the buyout date to 24 months of delinquency, the GSEs are giving themselves room to work with borrowers without the need for a sudden burst in buyout activity that would inject volatility into the market. A final point to consider is the expiration of the GSE foreclosure moratorium on July 31, 2021. For now, this only applies to loans where the foreclosure process was initiated prior to the pandemic as CFPB rules prohibit servicers from issuing a first notice of foreclosure to borrowers before December 31, 2021[4]. Below find a chart of 1M CDRs for Fannie Mae and Freddie Mac. 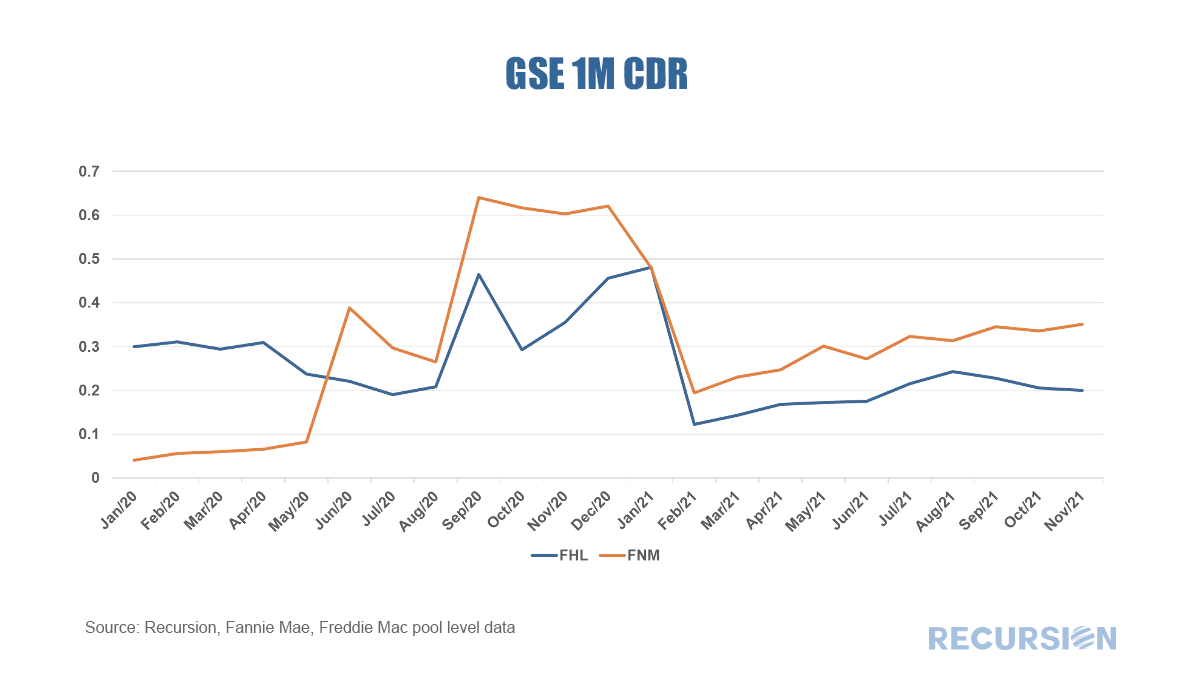 A few points stand out. First, the number of loans bought out the last two years is quite small. For Fannie Mae, the rate peaked at just above 0.6% in the last four months of 2020 while the rate for Freddie Mac did not top 0.5%. By way of contrast, the CDR for VA currently as of November 2021 stands at 2.8%, while that for FHA at 6.3%. This is a key explanation for the higher prepayment speeds in Ginnie pools relative to those of the GSE’s. A second point is the drop in the rate in February 2021 for both Enterprises when the 24-month rule was initiated. Finally, the slow creep up in the rates in recent months may have something to do with a resumption of foreclosure processes started before March 2020, but further investigation into the status of the loans being bought out needs to be conducted to be sure about this. To gain some perspective about the path of buyouts going forward, we need to look at the trend in long-term delinquencies. Fortunately, with the June 2021 loan level data release the GSEs have started disclosing delinquencies from 5-24 months and the patterns are interesting: 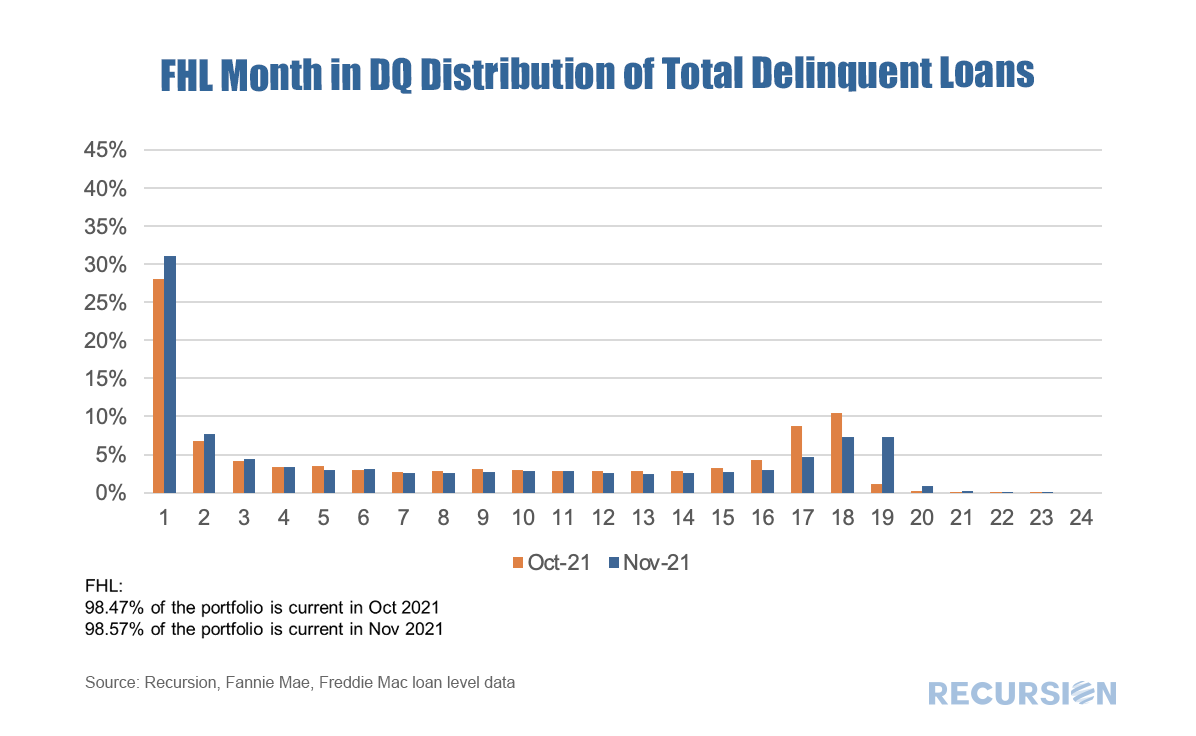 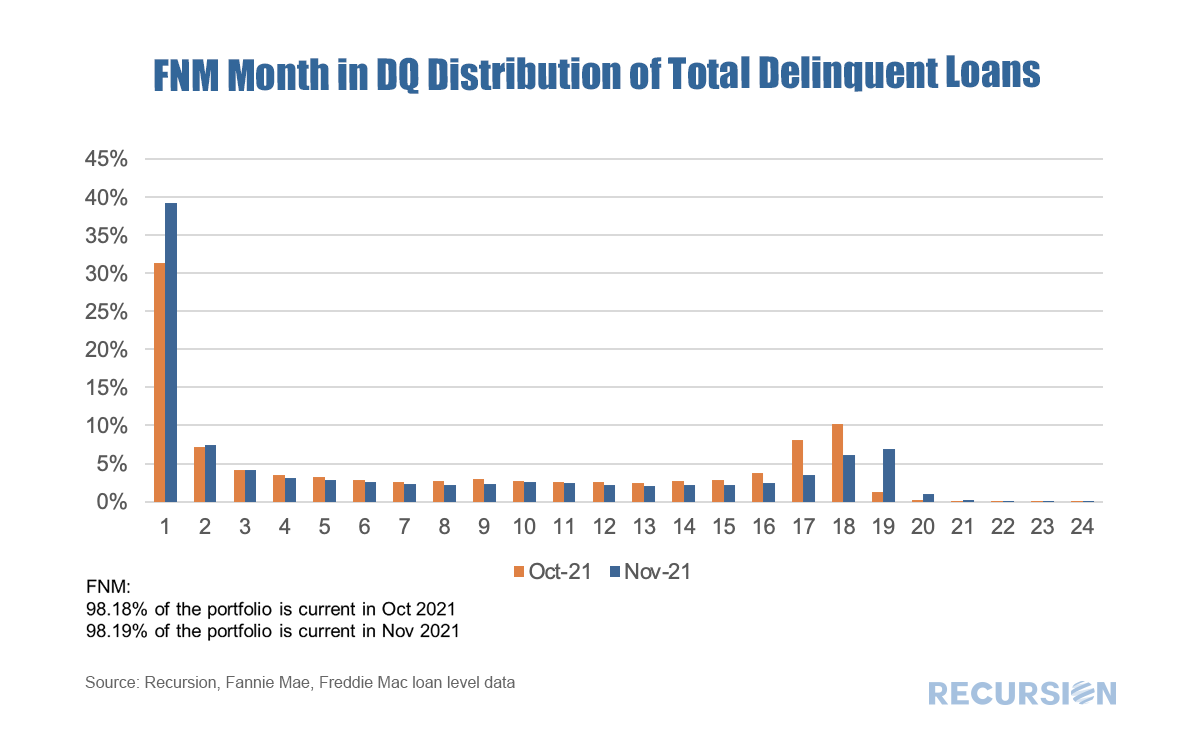 The heavy weight in the distribution the first month reflects normal behavior regarding missed payments and that tend to cure rapidly in subsequent periods. Of most interest is the rise in the share of delinquencies after month 16. These reflect borrowers initiating forbearance plans in the months after the passage of the Cares Act in late March 2020. The orange bars are the distribution for October 2021 and the Blue bars for November. The sense of a cresting wave can be clearly seen in the charts. At this point, lenders are reaching the end of their forbearance plans, but have some ways to go before their loans must be bought out of pools if they do not cure. These will be interesting charts to watch over the next six months as we approach the second anniversary of the onset of the Covid-19 pandemic. [1] https://www.recursionco.com/blog/why-are-ginnie-prepays-widening-relative-to-conventionals
[2] https://capitalmarkets.fanniemae.com/mortgage-backed-securities/single-family-mbs/fannie-mae-extends-timeframe-single-family-mbs-delinquent-loan-buyout-policy, and http://capitalmarkets.freddiemac.com/mbs/docs/f380news.pdf [3] https://www.consumerfinance.gov/coronavirus/mortgage-and-housing-assistance/help-for-homeowners/learn-about-forbearance/ [4] https://www.fhfa.gov/Media/PublicAffairs/Pages/FHFA-Protects-Borrowers-After-COVID-19-Foreclosure-and-REO-Eviction-Moratoriums-End.aspx |
Archives
July 2024
Tags
All
|
 RSS Feed
RECURSION |
|

Copyright © 2022 Recursion, Co. All rights reserved.