|
This is the third and (for now) final entry in our series of posts regarding appraisal modernization. The first describes the framework of data disclosures provided by the GSEs[1], while the second looks at differences in usage of the various programs between Fannie Mae and Freddie Mac and between banks and nonbanks[2]. In this note, we look at loan prepayment performance and the drivers behind it. Here we see 1-month CPRs and loan rates for purchase loans issued in 2023 with waivers and those eligible for waivers but did not obtain one: 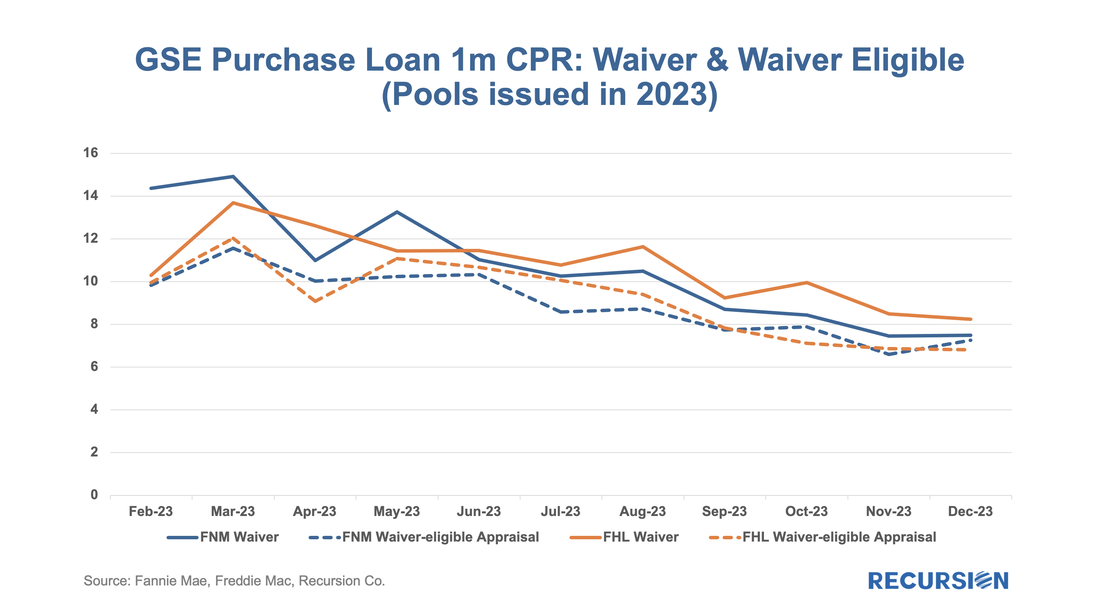 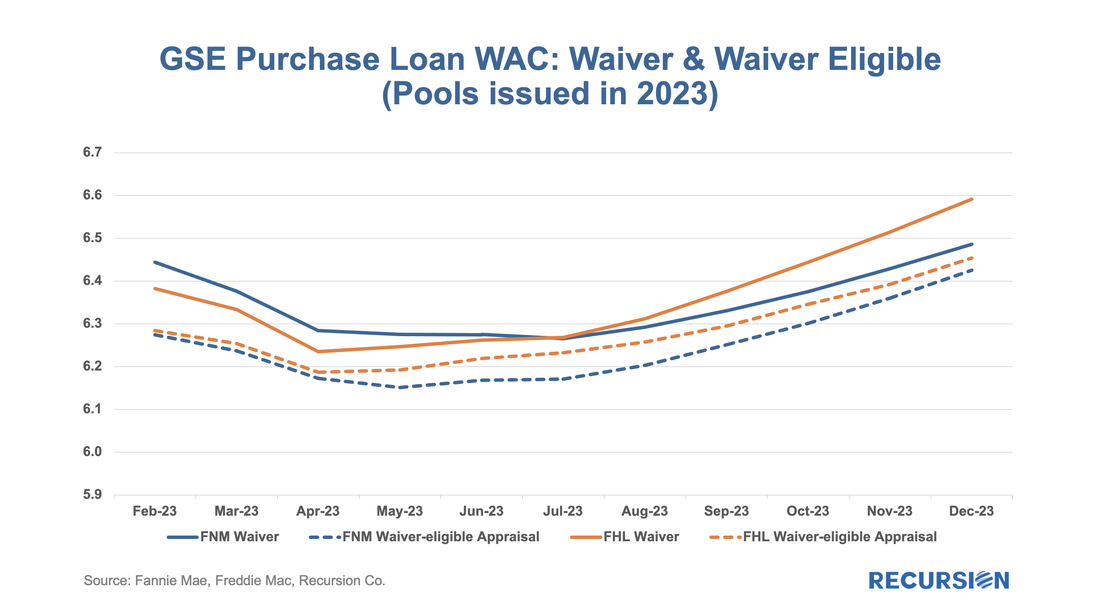 Those loans eligible for waivers but that obtain appraisals have lower loan rates and prepayment rates than loans with waivers, likely due to relatively reduced uncertainty surrounding valuation. Another key result that can be obtained from the chart is the more recent development whereby loans delivered to Freddie Mac with waivers have displayed persistently higher speeds than those delivered to Fannie Mae over the last six-month period. This corresponds with an increase in the pace of growth in FHL coupons compared to those of FNM over this period. It’s natural to ask if there are differences in loan characteristics that account for this gap. Below find the corresponding data for average credit scores across these categories: 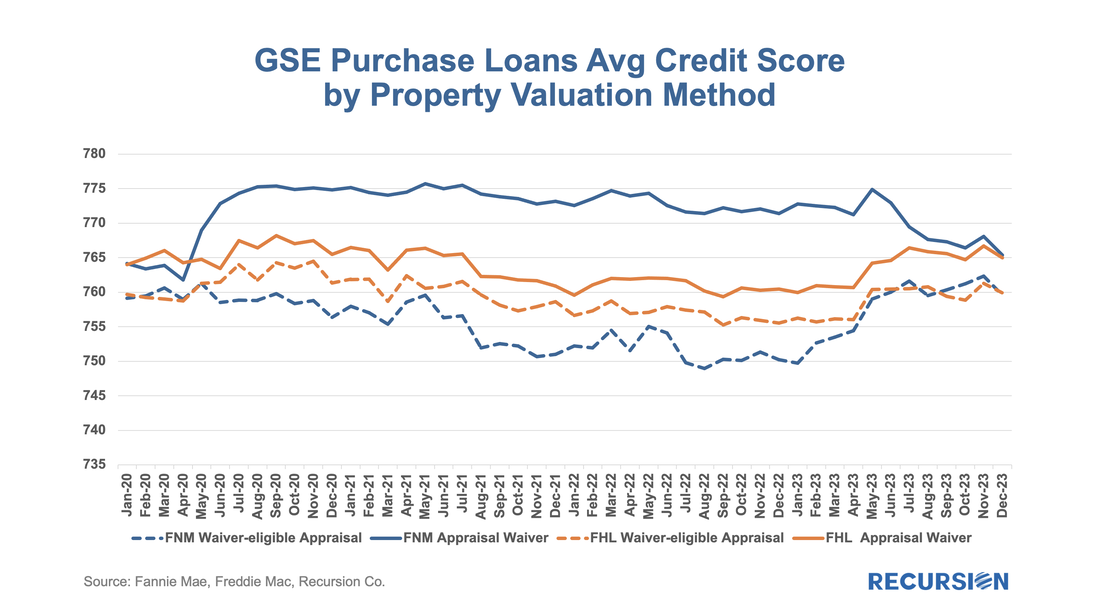 Over the past six months, FNM has loosened its credit standards for waivers as measured by credit scores relative to Freddie Mac. As this would tend to boost FNM coupons vs FHL, another explanation would seem to be required. We can speculate that FHL is discouraging waivers for its own risk-management purposes, but there is no verifiable support for this view. We can, however, see if this pattern persists in the newer appraisal types. 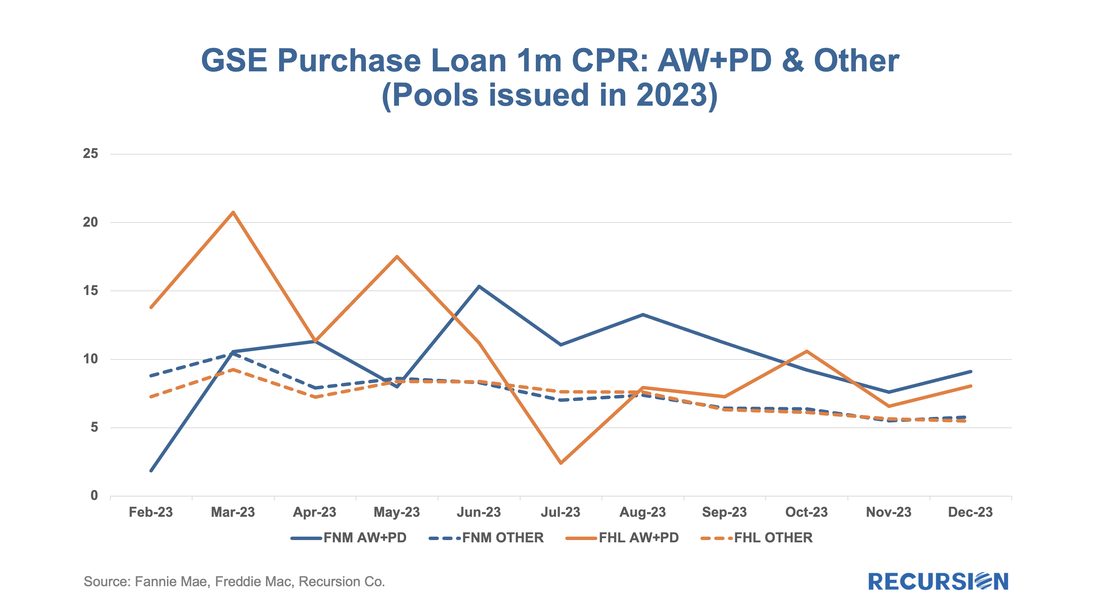 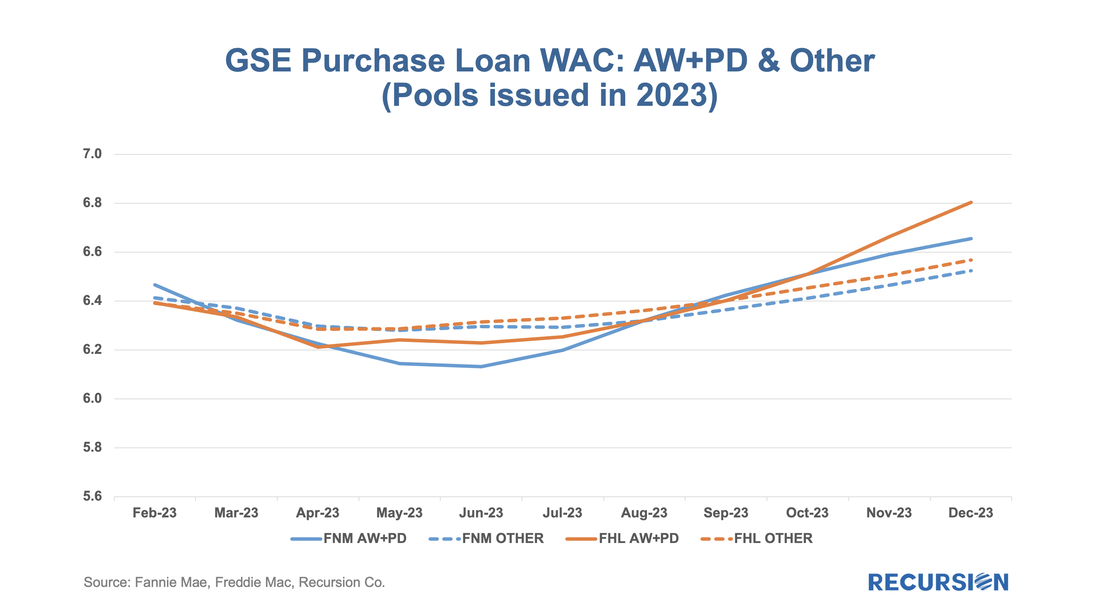 The loan counts here are quite small, so it is not surprising to see a noisy CPR chart for these categories. On the other hand, the trend increase in FHL AW+PD loans relative to those of Fannie Mae can be seen, although it is a more recent development in this case. Our conclusion is there is enough distinction here to say that modelers and traders ought to keep an eye on collateral risk as an independent factor in their decisions. The last time we discussed the topic of appraisal waivers was at the end of 2022, when we looked at the impact of sharply higher interest rates on the use of this flexibility. Property valuation impact profitability of loan origination. Lenders can gain a significant advantage if they fully understand and choose from all the options in front of them. Given recent market developments, it is no doubt time to take another look at this topic, but structural change has come to this space, so it makes sense to discuss this first. Until last year we were in a binary appraisal/waiver world. One or zero. For some time, there have been discussions of various “modernization” programs somewhere in between, with valuations produced via a process that requires less information than that obtained from a full appraisal but not no information. 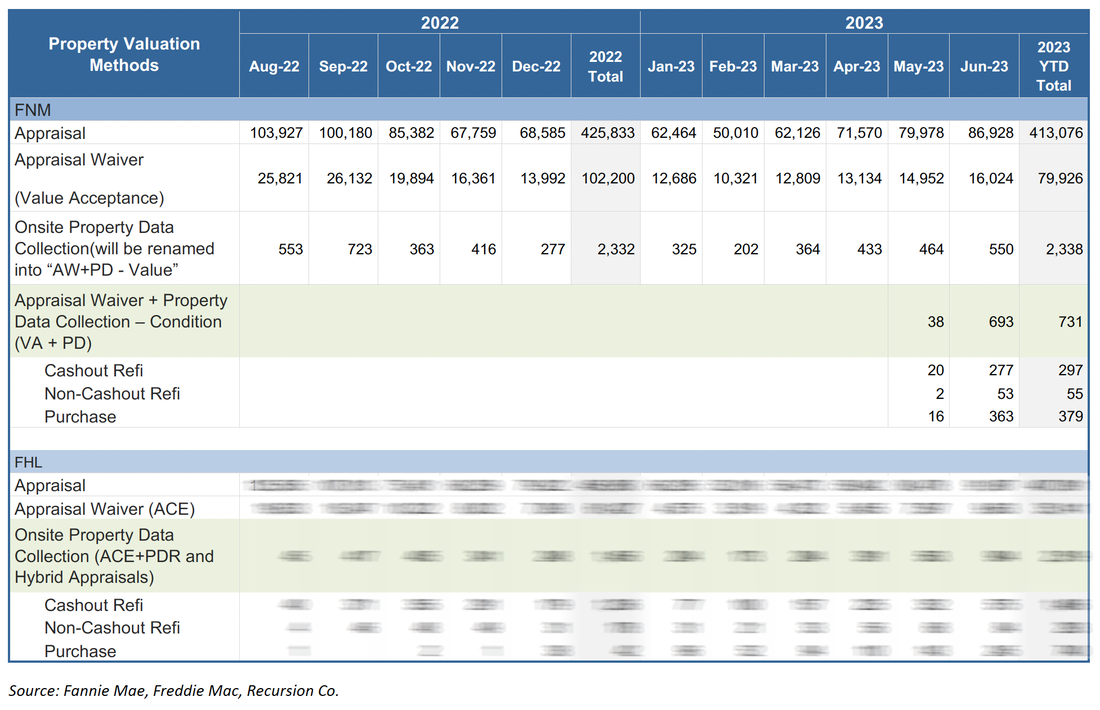 To read the full article, please send an email to [email protected]
For some time, we have been following the trends in appraisal waiver usage for loans delivered to the GSEs[1]. Now it’s interesting to revisit these trends in the wake of the recent sharp volatility in economic and market conditions. Appraisal waiver usage by originators is one of a number of decisions that reflect the risk appetite of loan-producing firms. All else being equal, a waiver serves to reduce costs, and potentially volumes, at a cost of increased uncertainty about a property’s valuation. As the mortgage market is currently dominated by purchase mortgages in this high interest rate environment, we limit our analysis to this loan purpose. The risk aspect can be clearly seen by the tendency for waivers to be more widely available for borrowers with strong credit profiles: 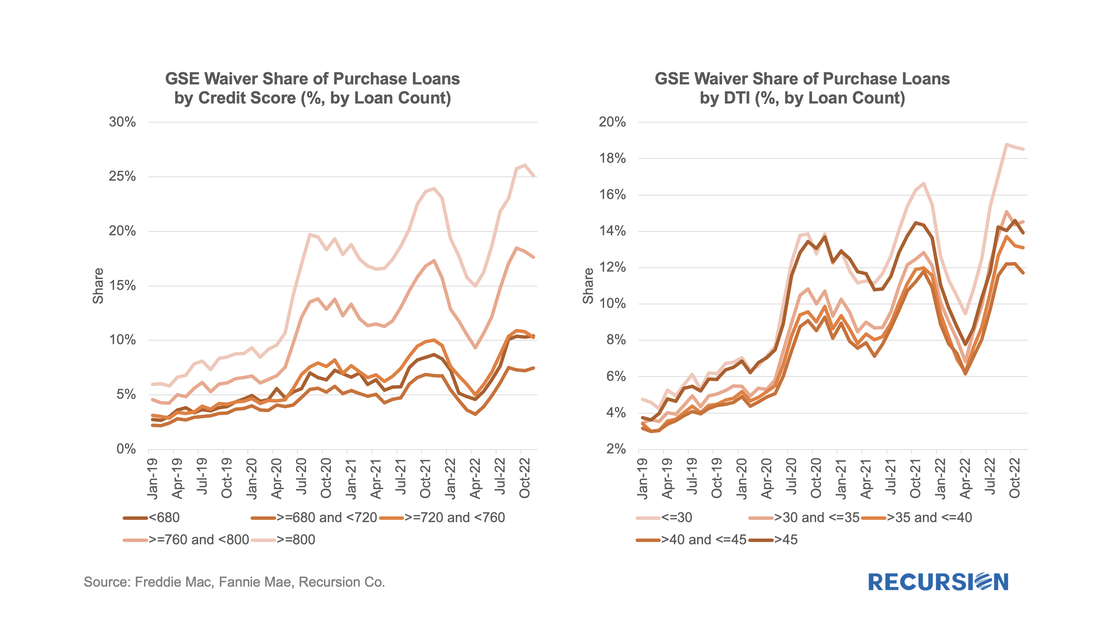 Recursion data was cited in an article on how higher mortgage rates have resulted in higher shares of appraisal waiver usage in the last few months. The author notes that “An increasing share of originations are purchases, which have lower appraisal-waiver eligibility rates than refinances. But at the same time, there's increased willingness on the part of government sponsored enterprises to accept digital valuations….However, while waivers may be less available for purchase loans, lenders and borrowers seem no less eager to use them when they can, even with reductions in loan volume potentially reducing appraisal delays.”, citing Recursion data. 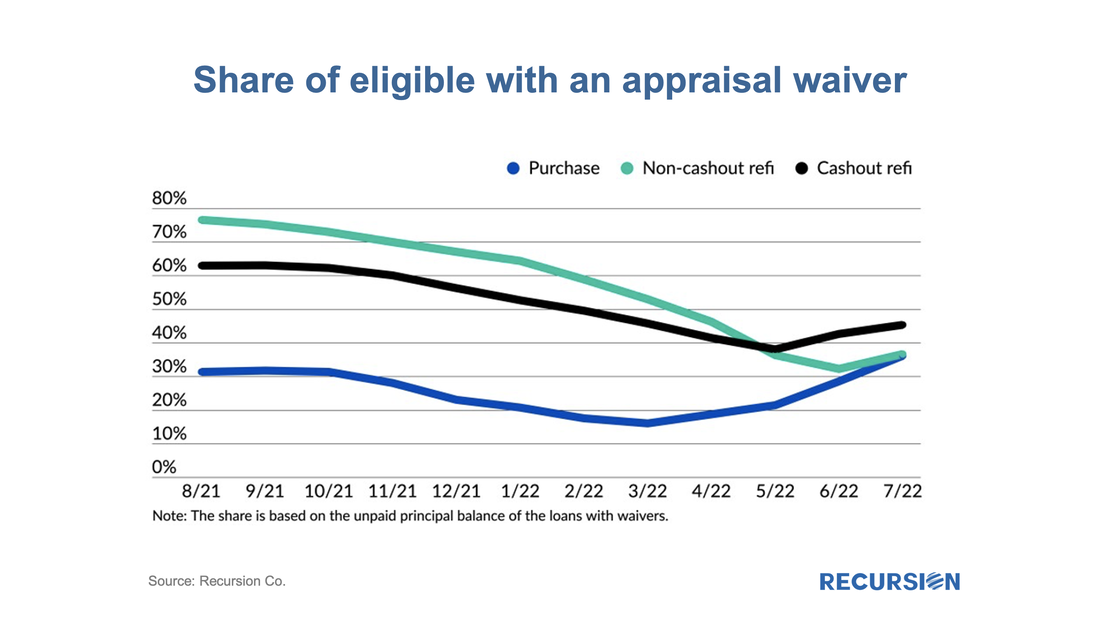 We’ve noticed that the prevalence of appraisal waivers for purchase mortgages within the eligible population peaked in Q4 last year, and recently has gone into steep decline. Our working thesis as to what is behind this trend is that lenders are getting concerned about the rapid pace of home price increases and want the additional security associated with an on-site appraisal. If this is indeed the case, we should see a greater decline in this share for larger mortgages than for smaller ones. So we break up the universe by GSE, and by loans above and below 2021’s conforming loan limit of $548,250: 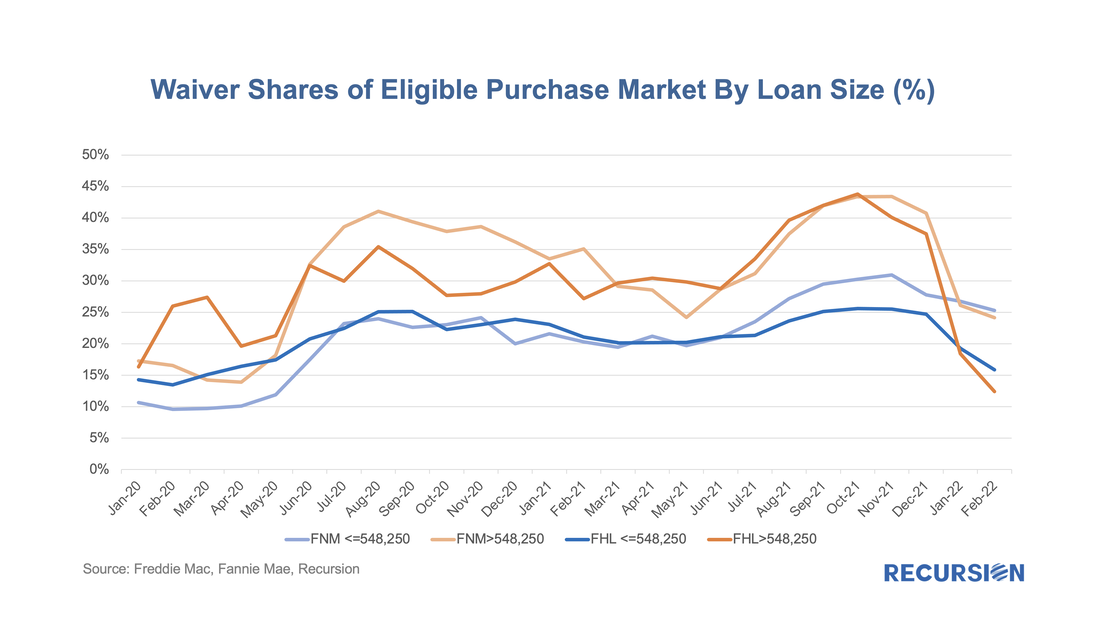 As we have noted many times, one of the best features of loan-level analysis is the ability to segment the mortgage market into components that allow for a deepening of understanding of the behavior of the various market players. In this note we look at two groups: borrowers who get an appraisal and those who are eligible to get one but do not. In previous posts we pointed out that analysis of the performance characteristics of mortgages with and without appraisal waivers cannot be accomplished by looking at loans with waives vs those without as many loans without waives are ineligible to obtain them. A robust analysis can only be conducted by looking at loans with waivers against loans that are qualified to get one. The qualification characteristics can be complex, but the main factor is LTV, which differs by loan purpose.[1] The question that naturally arises is why do some eligible borrowers not obtain a waiver when doing so would save money on the transaction? To address this issue, we look at the distribution of loan sizes for purchase loans with waivers vs those without them that are eligible. Here is the pattern of loans delivered to the GSEs YTD October 2021 by Agency: 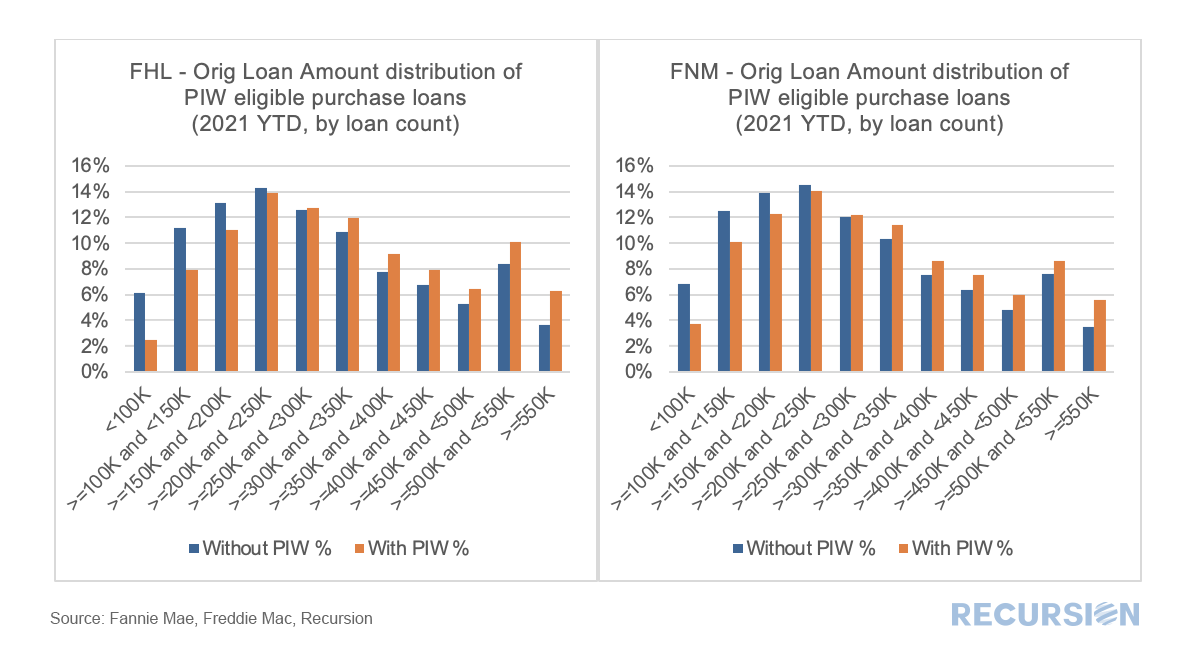 The matched dataset continues to pay dividends (sorry no buy-backs). This time we take a look at appraisal waivers. The very straightforward question based on the new data is to ask if there are differences in the rate of PIW take-up among eligible loans between areas with a higher share of low to moderate income people and those with a lower share. Our breakpoint is areas with LMI>=51(Low-or Moderate-Income Areas) and LMI<51 (Not Low-or Moderate-Income Areas), and we look here at just purchase loans. Before we begin, as this query is focused entirely on GSE loans, we felt it necessary to put the bots into overdrive to improve the match rate between HMDA and the GSE loan tapes and for those keeping track the updated match rate is: 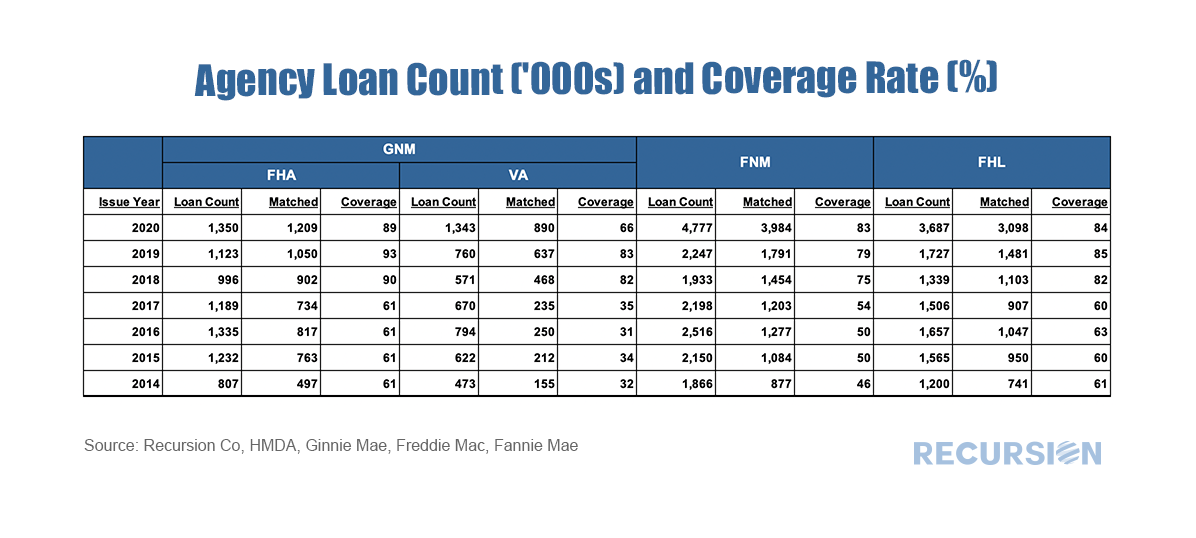 In a recent post, we discussed the relative performance of loans with property inspection waivers vs those with traditional appraisals that qualified for a waiver[1]. We commented that the observed out-performance of loans with waivers as measured by lower total delinquency rates (DQs) was likely influenced by relatively tighter lending standards (eg higher credit scores, lower DTI) for these loans compared to eligible loans that received a traditional waiver. A fully rigorous examination of this issue would be an extensive undertaking outside the scope of these brief posts. But let’s do a quick example as a demonstration of what our tools can produce along these lines. To make for an apple-to-apple comparison, below find two grids containing the difference between the total delinquency rates for purchase loans with PIWs compared to those that are eligible but obtain a traditional appraisal. The first is for loans originated in 2019 and the second is for those originated in 2020:  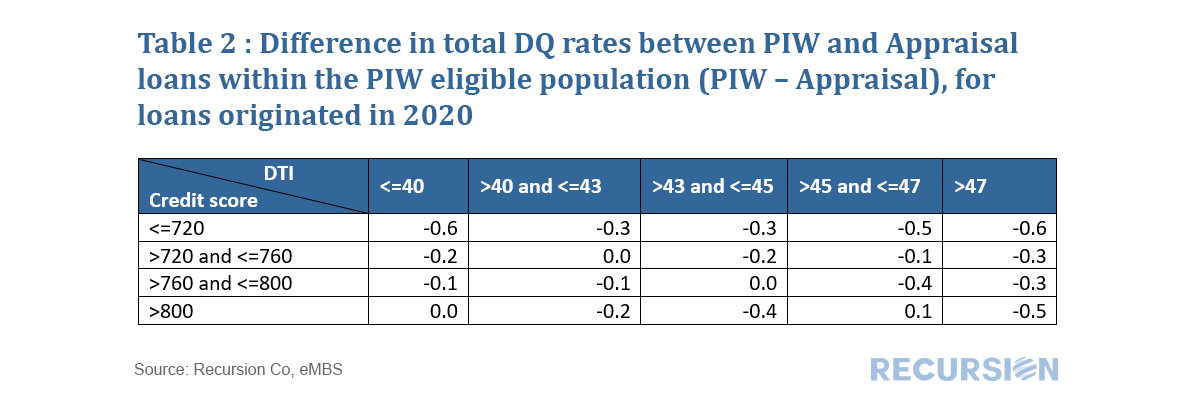 We find that PIW’s are more extensively used in 2020 than in 2019. In addition, in 2019 the range of PIW takeup across cells was 8%-13%, while for 2020 it was 14%-28%. In both cases, takeup tends to rise with credit score. Lenders appear to be more willing to allow a waiver for borrowers with better credit. 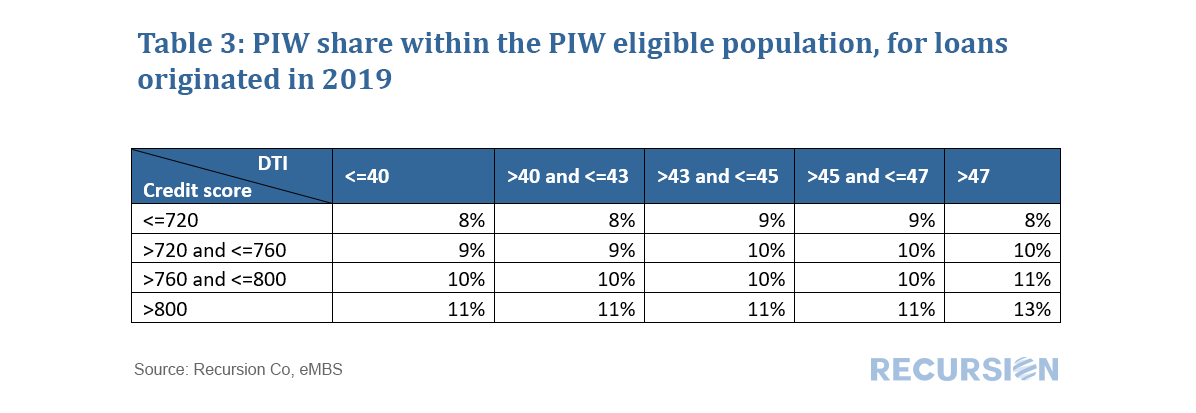 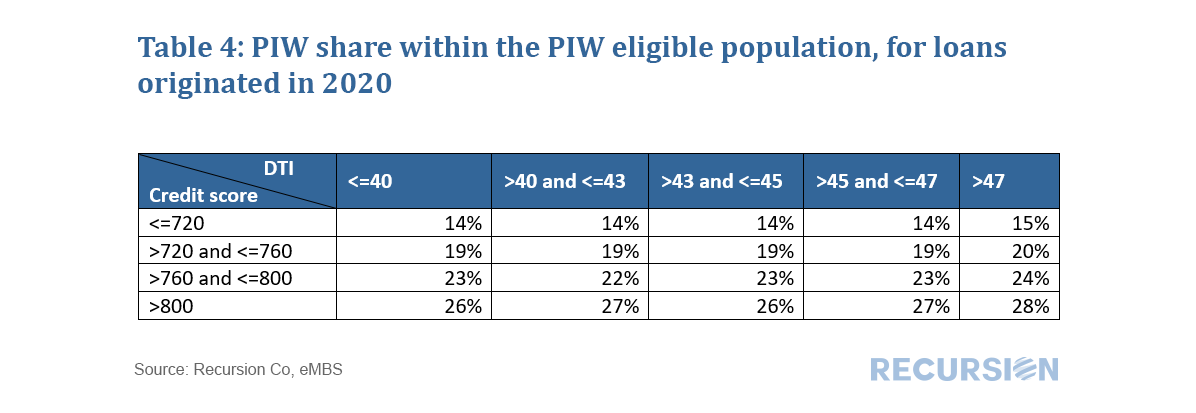 For 2019, there are a number of outliers, but there is no clear pattern across the grid. Many lenders were just beginning to implement their waiver programs that year. By 2020, PIWs became a standard part of the toolkit. For most of the center of the grid, loans with waivers very slightly outperform those eligible loans using appraisals. Bigger outperformance can be seen, however, along the edges, i.e. loans with credit scores less than 720, and DTIs greater than 47. It appears it is not the waiver itself that leads to outperformance, but likely that underwriters are more careful and pay more attention in general to these riskier classes of loans. Further work would look at performance across the largest servicers, and by state. |
Archives
July 2024
Tags
All
|
 RSS Feed
RECURSION |
|

Copyright © 2022 Recursion, Co. All rights reserved.