|
In a recent post, we discussed the utility of the FHA Performance dataset in tracking borrower stress in the housing market[1]. Here we look at other interesting market perspectives that can be obtained from this release.
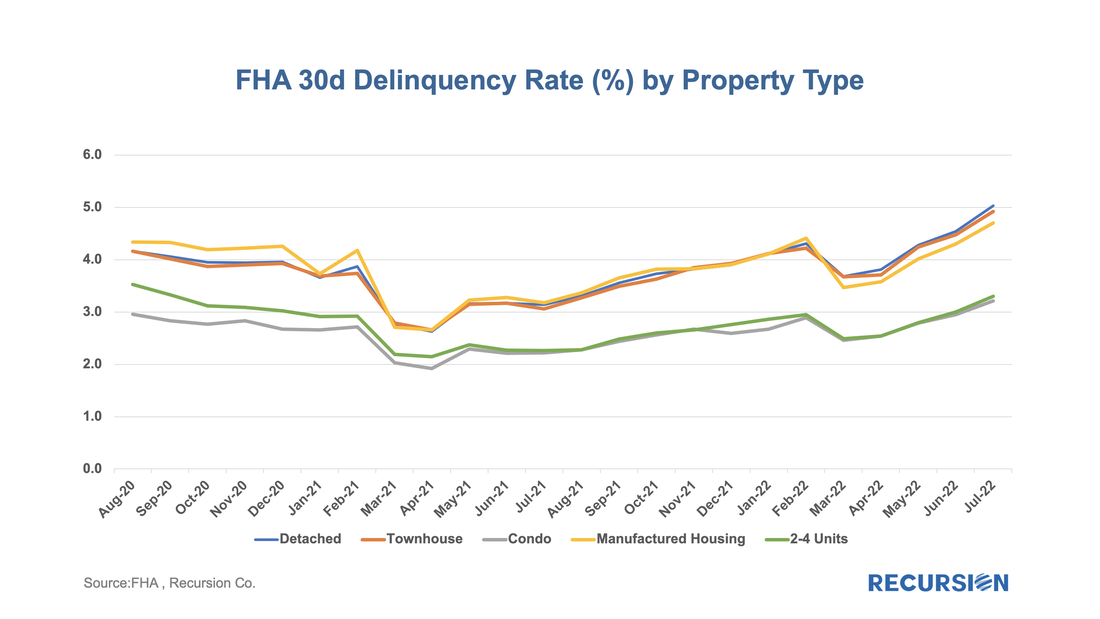
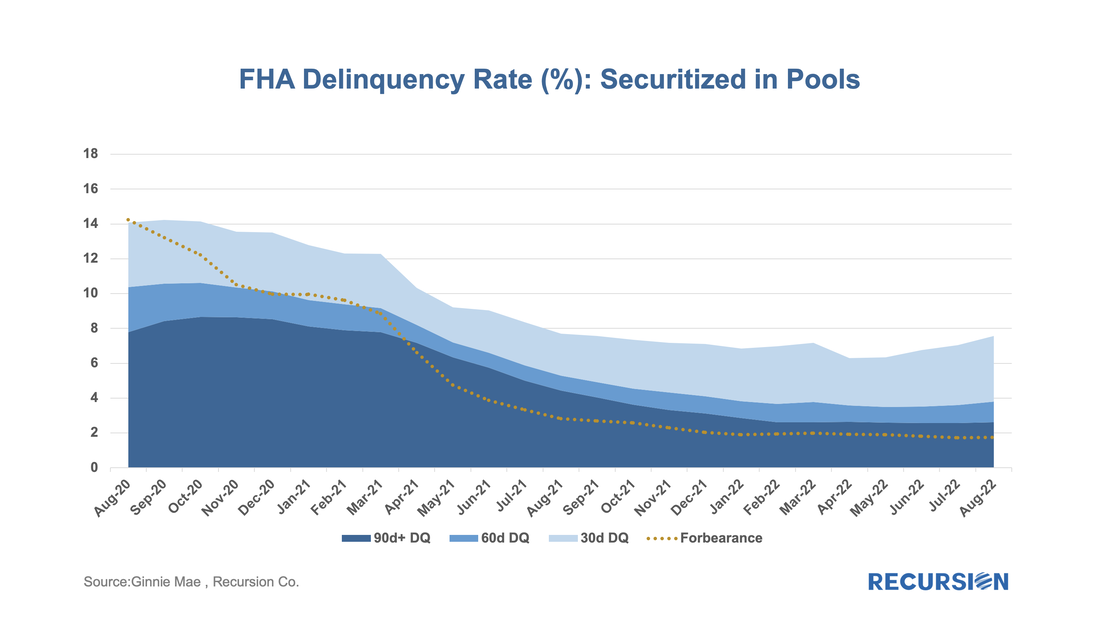
First, we look at property type. This breakdown is not available in the GNM loan-level disclosures, so this is a new view. Here we have 30-day DQ rates broken down over five categories: We recently wrote about the increase in short-dated delinquencies in FHA pools relative to loans in conforming pools[1]. We took this as a sign of the disproportionate impact that inflation has on lower-income households. This is a useful observation, but it is limited by the lack of visibility on delinquencies of three-month duration or longer as these loans are often bought out of pools. To address this gap, we recently imported the FHA performance data. This data is not available at the loan level, but the aggregate characteristics are informative.
In a recent post, we discussed the attributes of manufactured housing data that came with the final 2021 HMDA release in July[1], which were not available in the preliminary release. Another important data point from this final release is the conforming flag, identifying which loans satisfy the requirements for delivery to Fannie Mae and Freddie Mac. Obviously, any loan sold to a GSE is conforming, so its main use is to enable analysts to examine these loans which are held on bank balance sheets.
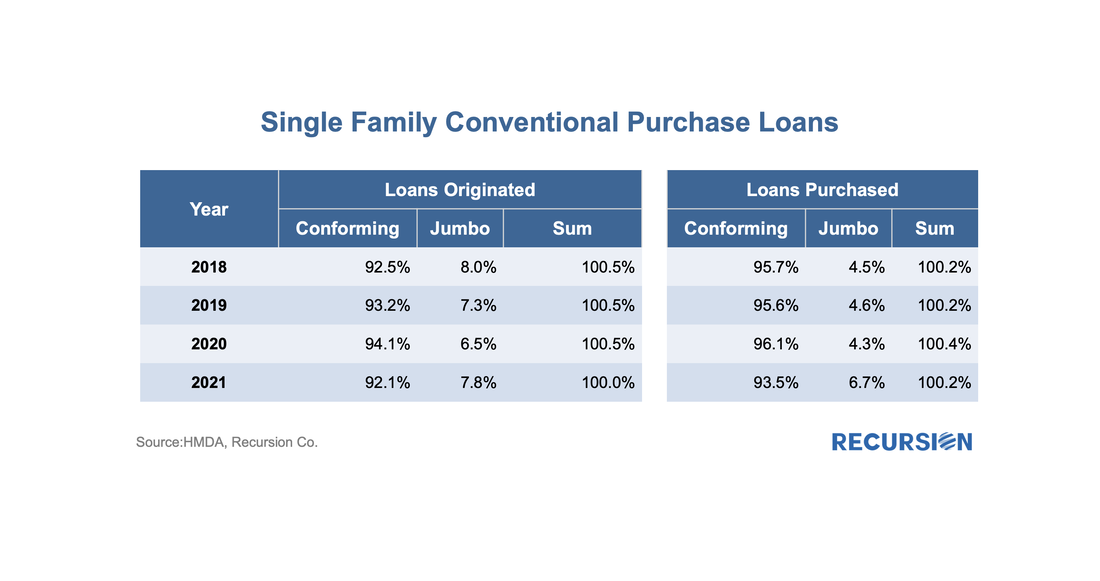
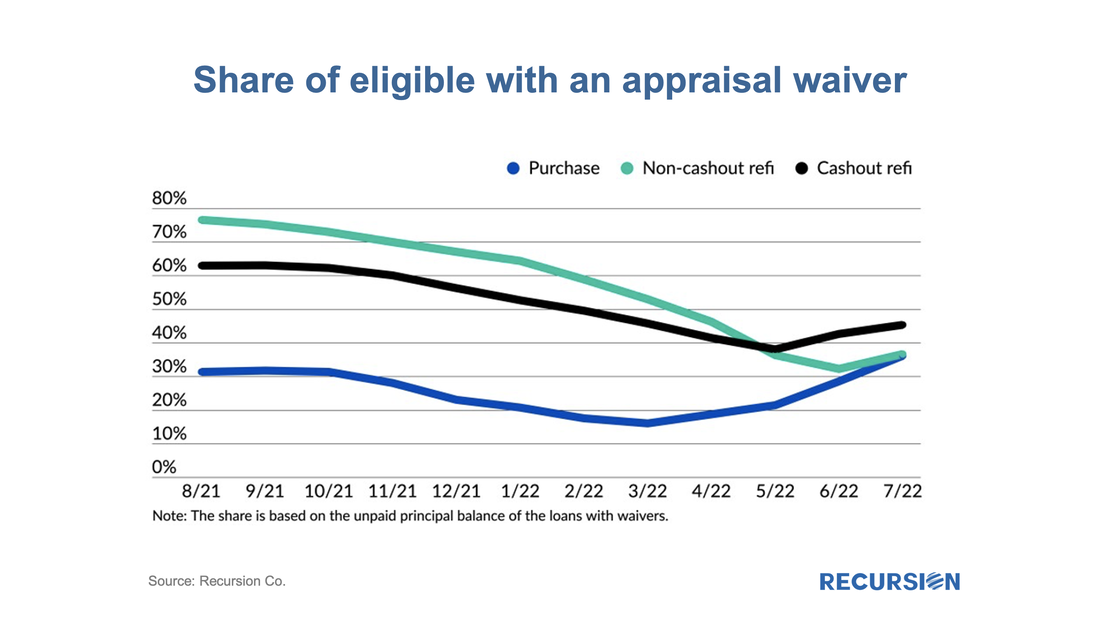
The lag between the preliminary and final releases of HMDA data can be four months or longer, so it would be useful to be able to identify these loans right after the preliminary release. One way to approach this is to flag non-government loans with balances above the conforming limits as “jumbo”. How does Recursion’s “Jumbo” flag compared with HMDA’s Conforming flag? If the information is perfect, “Jumbo” loans should be all the loans that are not “Conforming”. However, the exact original balance of a mortgage is not provided by HMDA to protect privacy. For those loans close to the conforming boundary, our program can misjudge which category to assign. Given all that, going back to 2018, there is still a very strong negative connection between the two measures: Recursion data was cited in an article on how higher mortgage rates have resulted in higher shares of appraisal waiver usage in the last few months. The author notes that “An increasing share of originations are purchases, which have lower appraisal-waiver eligibility rates than refinances. But at the same time, there's increased willingness on the part of government sponsored enterprises to accept digital valuations….However, while waivers may be less available for purchase loans, lenders and borrowers seem no less eager to use them when they can, even with reductions in loan volume potentially reducing appraisal delays.”, citing Recursion data.
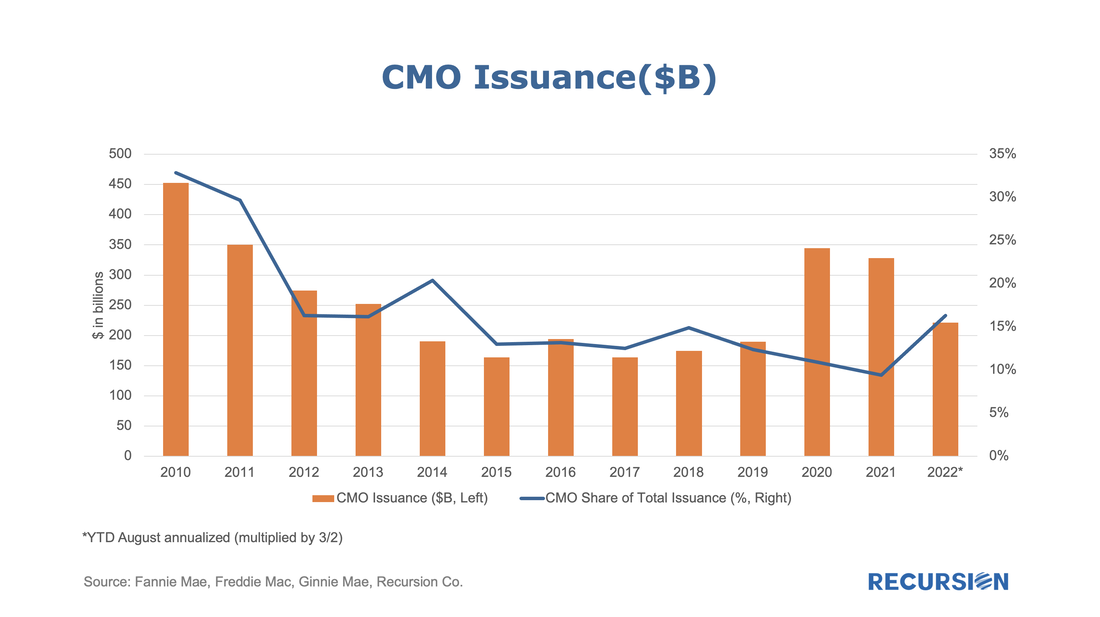
As pool issuance reached historical high amid record low mortgage rate with the onset of Covid-19 in 2020, Agency CMO took off correspondingly. Investors apparently looked favorably on the diversification opportunities in structured products, given the heightened uncertainty during that time. In 2021 total issuance dipped, and so far through the first eight months of 2022 volumes are well behind last year’s pace. The GSE commingle fee set force in June slowed down Fannie and Freddie’s CMO issuance significantly. However, as a share of total issuance, CMOs are holding up quite well.
|
Archives
July 2024
Tags
All
|
RECURSION |
|
Copyright © 2022 Recursion, Co. All rights reserved.

 RSS Feed
