|
As pool issuance reached historical high amid record low mortgage rate with the onset of Covid-19 in 2020, Agency CMO took off correspondingly. Investors apparently looked favorably on the diversification opportunities in structured products, given the heightened uncertainty during that time. In 2021 total issuance dipped, and so far through the first eight months of 2022 volumes are well behind last year’s pace. The GSE commingle fee set force in June slowed down Fannie and Freddie’s CMO issuance significantly. However, as a share of total issuance, CMOs are holding up quite well. 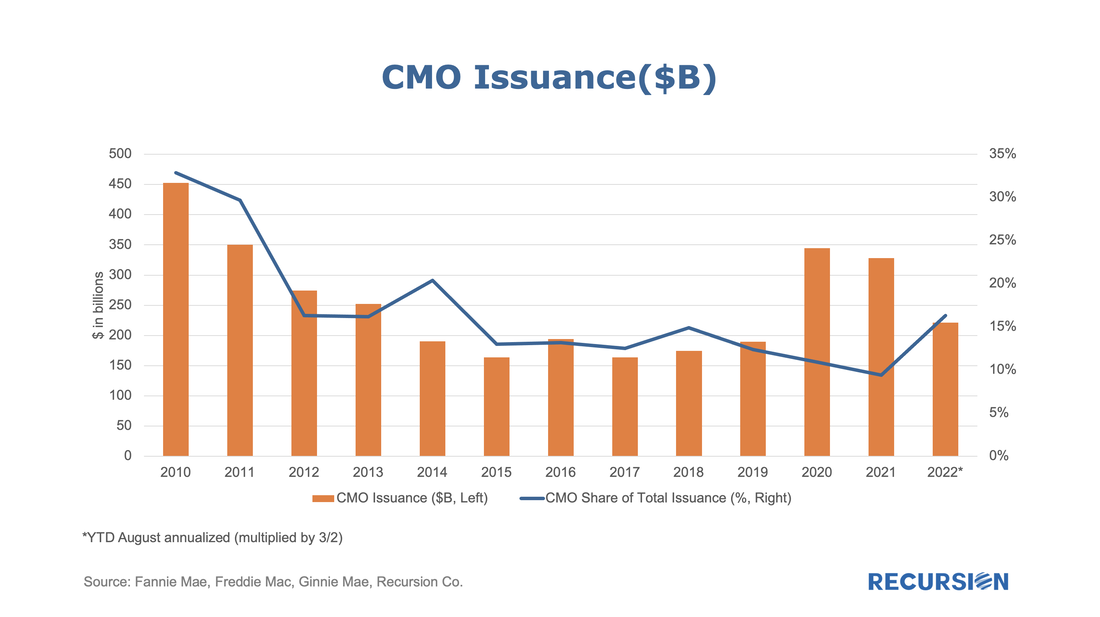 An innovation that we can now provide to the market is the ability to break this down by underwriter. We can do this by aggregating each CMO deal from each issuer’s collateral portfolio. The following table shows total issuance broken down by issuer going back to 2019, a “CMO League Table”: 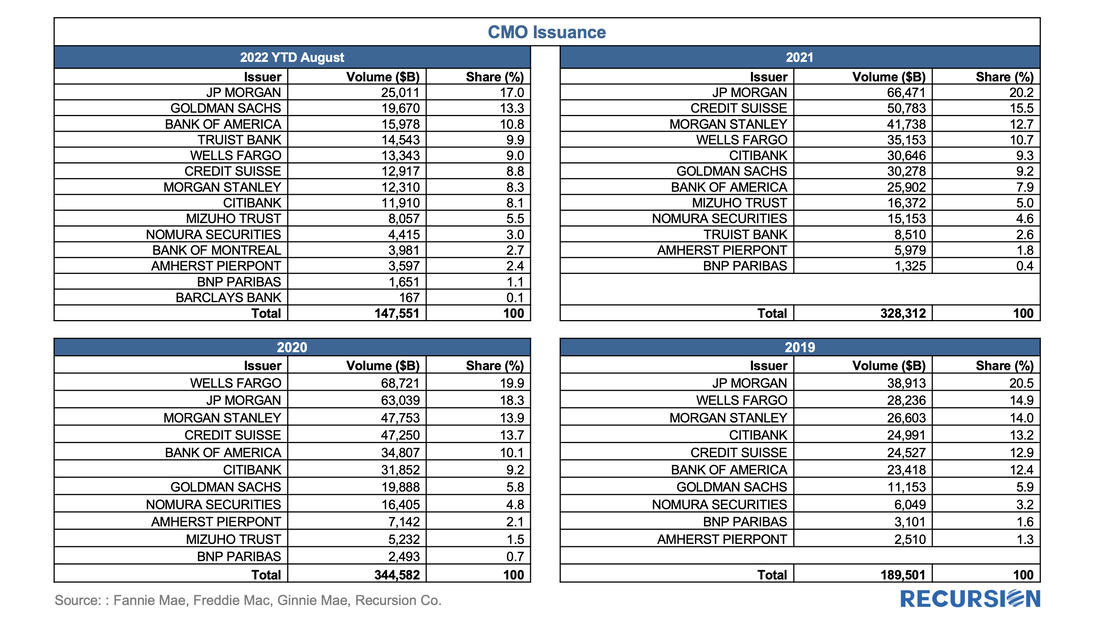 There are several takeaways here. First, the number of issuers has increased modestly from 10 in 2019 to 14 this year. The top-5 share has declined from 75% to 60% over this period. JP Morgan has led issuance three out of the last four years. Wells Fargo fell from number one in 2020 to number five this year with a drop in share from 20% to 9%. Goldman Sachs has steadily risen from number seven in 2019 with a 6% share to number two this year, with a 13% share. Hats off to upstart Truist Bank, which went from nowhere in 2020 to number four and a 10% share so far in 2022.
There is more. On the asset set, by aggregating CMOs from the underlying collateral we can further break down these performance numbers by characteristics such as pool type, vintage, coupon, and many others. This will provide market participants with deep insights into the strategies being undertaken by these firms. On the liability side, we can also break down CMOs by bond characteristics. Spoiler alert! Soon our customers will be able to do this sort of complex analysis in a straightforward manner using the Recursion CMO Analyzer. Watch this space. |
Archives
July 2024
Tags
All
|
 RSS Feed
RECURSION |
|

Copyright © 2022 Recursion, Co. All rights reserved.