|
Usually, when we talk about financial institutions in our posts, we focus on sellers and/or servicers as we have a clear view from the Agency disclosures. An interesting distinction in this regard is to break down originations between those sourced through a retail channel within the lending institutions and those purchased from other lenders, known as third-party originations (TPOs). We are often asked the question in the case of TPO lending, where only sponsors of the mortgages are reported, who are the originators? This information is not reported in the agency loan-level disclosure. We can supplement this information by examining originators in the HMDA data by observing the fact a TPO (correspondent or broker) loan is often reported twice, one record reported by the originator and another reported by the sponsor. At Recursion, we conducted an exercise by matching the pairs together, and we were able to identify the counterparty pairs for about 50% of the mortgages marked as “purchased”, and also made this revealing data point to our HMDA Analyzer users. According to the 2021 HMDA preliminary release, about 2.65 million loans were purchased from other lenders that year, about 18% of all originations. Roughly half of these purchases were made by 10 institutions: 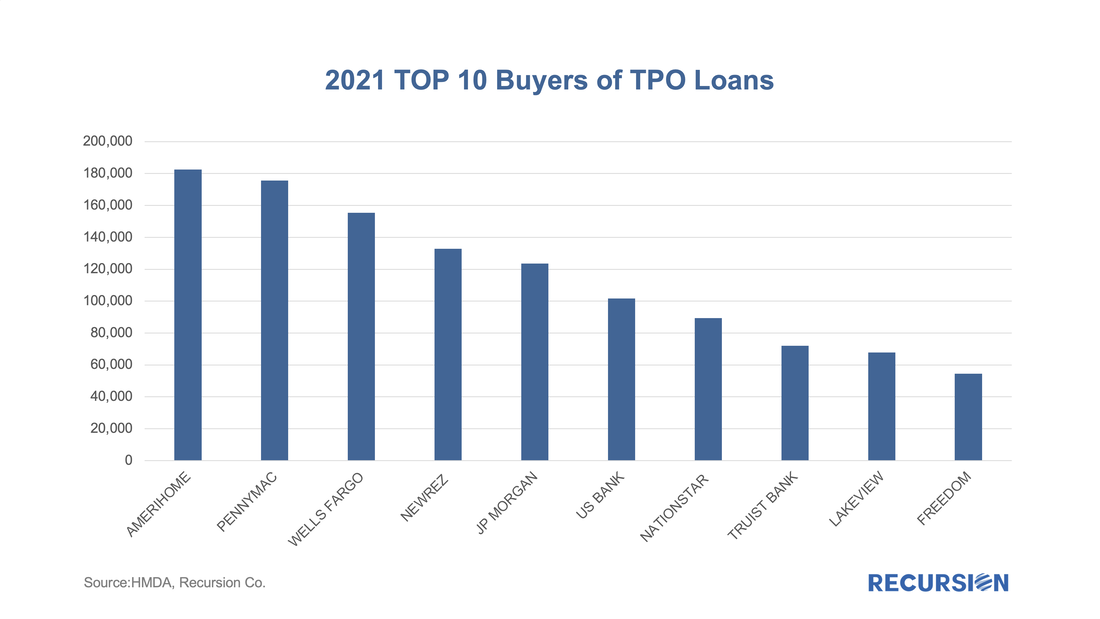 While the Fed has clearly been the dominant player in the MBS market for the last 13 ½ years, the consistent biggest holders of MBS have been the banks. When the Federal Reserve launched its QE program in late 2008, banks held about 16% of the outstanding balance at the time, and that share has more than doubled as of Q1 2022 to stand at about one-third of the total. In a recent blog, we dug into the details behind international investor behavior with an ancillary dataset[1], for the banks, we look for guidance from the Call Reports[2]. The Call Reports provide details on portfolio holdings of individual banks across financial asset categories (e.g., equities and bonds) for both loans and securities. For the purposes of this note, we just look at securities. What makes bank behavior so challenging to assess is that various types of policy actions have profound impacts on their investment decisions. To begin, we look at the share of residential agency MBS out of total bank assets, including both pass-through securities and CMOs: 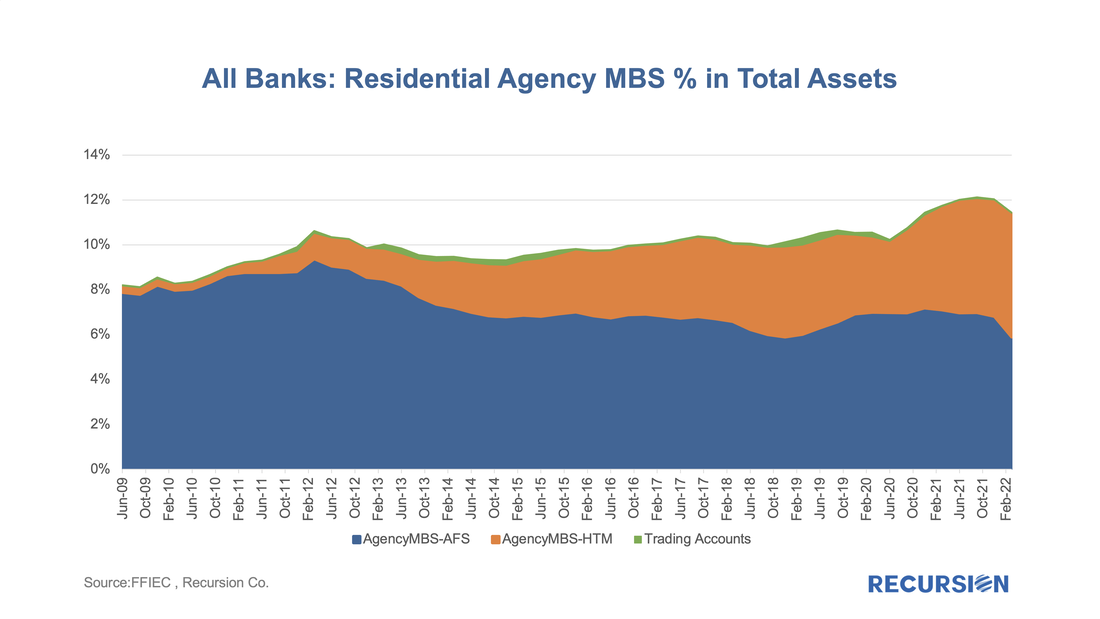 Over the past couple of years, we’ve witnessed some volatility with regards to FHFA’s approach to mortgages on second homes and investor properties (sometimes referred to non-owner occupied housing or NOO). In January 2021, FHFA announced that caps would be imposed to limit the acquisitions of loans backed by second homes and investment properties to 7% of the total on a rolling 52-week basis[1]. These caps were then suspended in September of that year. Then, on January 5, 2022, FHFA announced targeted fee hikes on second home mortgages and jumbo mortgages on loans delivered to Fannie Mae and Freddie Mac, to be implemented on April 1, 2022[2]. These up-front fees are tiered by LTV and for second home mortgages range from 1.125% and 3.875% and for high balance loans range from 0.25% and 0.75%. Borrowers in special affordability programs[3] are excluded from these fees, as are first-time homebuyers in high-cost areas whose incomes fall below 100% of the area median income. To see what if any impact these fee hikes have had on the targeted market segments, we look first at the share of conventional loans broken into second homes, investment homes and others, as measured by loan count. 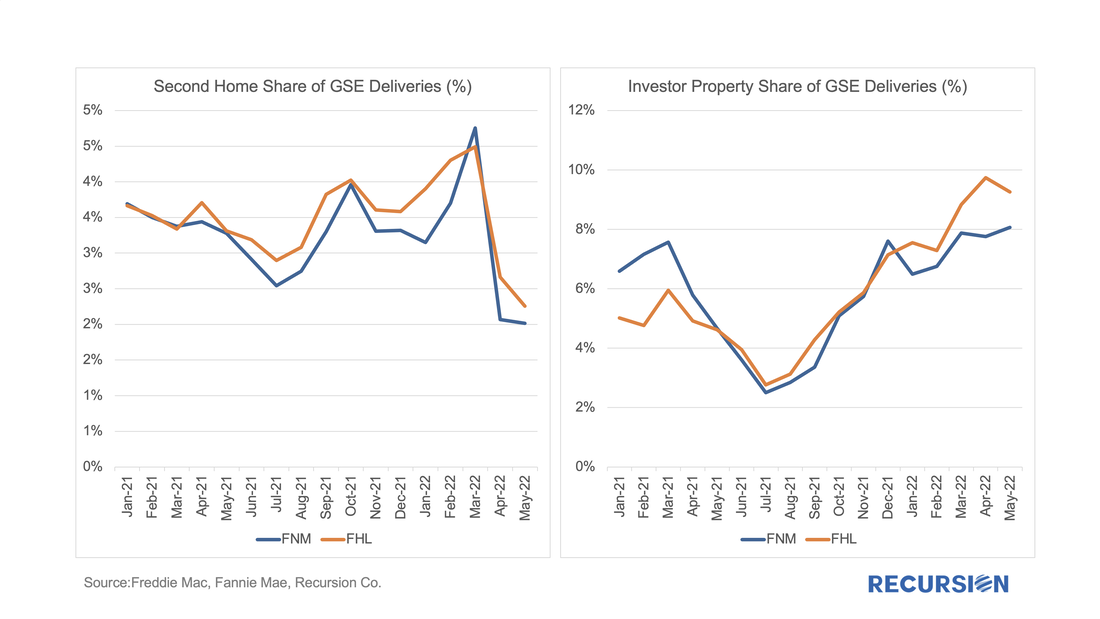 On May 5, 2022, Freddie Mac announced "that certain principal curtailments were previously not passed through on a timely basis to MBS securities holders[1]. The outstanding principal curtailments will be reflected in the May 2022 factors and passed through to the affected MBS securities with the May 2022 payment. The curtailments are associated with approximately 178,000 mortgages distributed across approximately 50,000 pools. As a result of this catch-up pass through of principal curtailments, the May 2022 factors will reflect an approximately 0.7% CPR increase in prepayment speeds for the related pools, in the aggregate." In addition, they attached a list of 1,102 pools where the curtailment amount was equal to or exceeded 5% of the UPB[2].
That's a remarkable statement for a variety of reasons, but at Recursion, our immediate response was to take this as an analytical challenge. Do we have the information and tools needed to reproduce Freddie Mac's estimate of a 0.7% CPR increase from this remediation? How to begin? As the payment was adjusted in May factors, it would have impacted April CPR. But how to back out curtailments? It's clear that this would have to be done at the loan level since there is not enough information at the pool level to compute a shortfall. On May 25, 2022, Ginnie Mae announced that starting on June 8 it would enhance its pool and loan-level multifamily disclosures through the addition of an Affordable Status Field[1]. This field marks every FHA loan in pools with a Ginnie Mae guarantee as:
We received this data on the 6th business evening, and below find some summary descriptions: 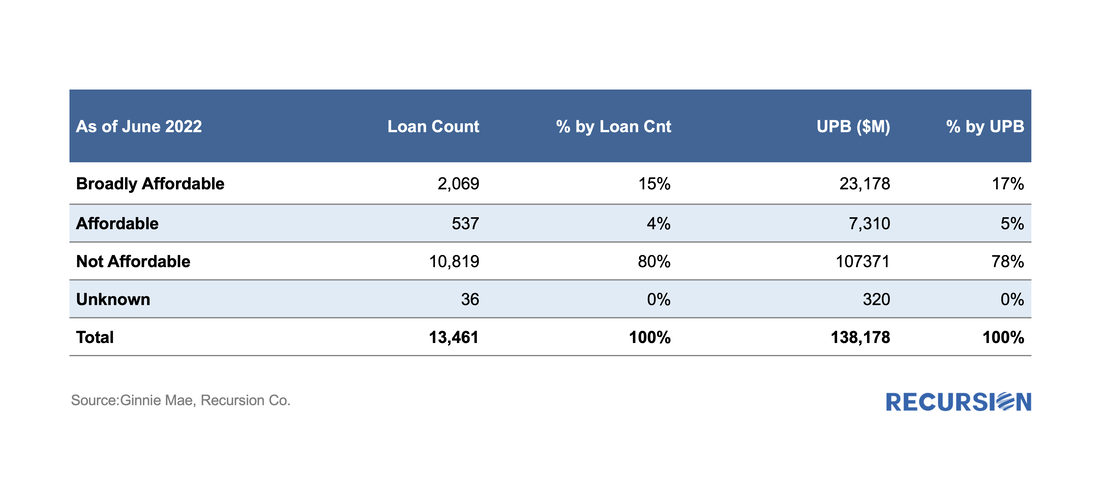 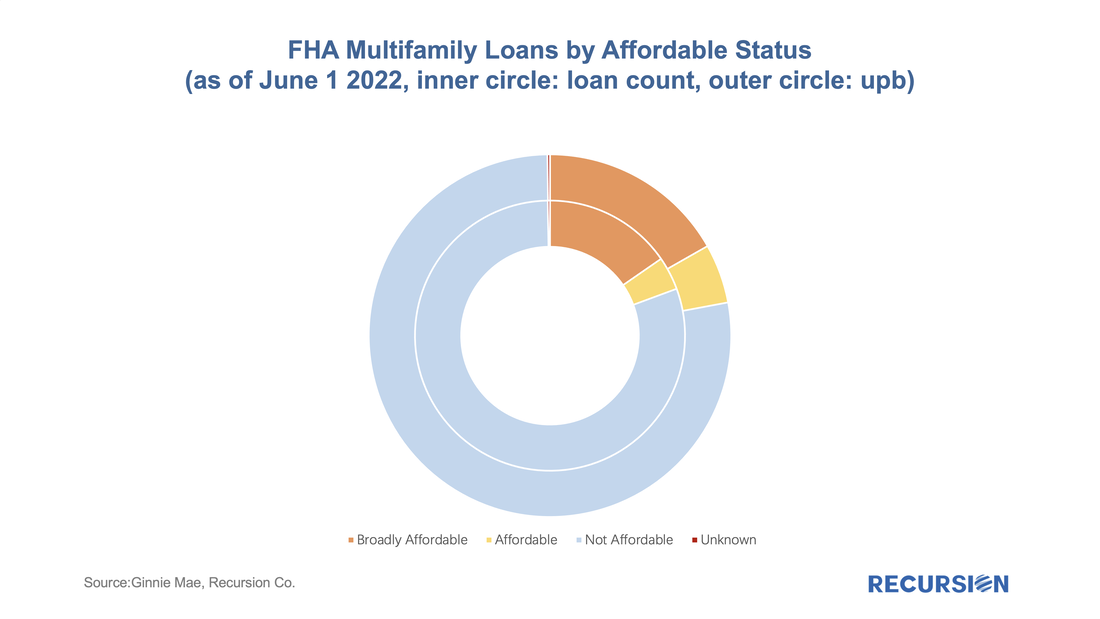 Recently we commented on the potential for various investor market segments to increase their holdings of MBS as the Federal Reserve winds down its portfolio[1]. An interesting category is foreign investors. At the end of 2018, when the Fed initiated its QE program, foreign investors held about 17% of outstanding MBS, and this has fallen to a little less than 12% at present. Most of the decline occurred in the wake of the global financial crisis when mortgage-related securities were revealed to be riskier than generally believed. As noted in that post, there are many considerations facing foreign investors in US securities that do not weigh as heavily on domestic money managers. These include foreign exchange risk, local market conditions, and geopolitical risk. To gain a better understanding of the underlying behavior behind the trends in overseas asset holdings, we turn to another data set, the Treasury International Capital (TIC) data. This data provides balances and transactions of overseas holdings and transactions by country and asset class, including MBS[2]. This note looks at recent developments in this regard for three key Asian economies: China, Japan and Taiwan. The following chart provides a picture of the value of MBS holdings for each of these three countries back to 2012: 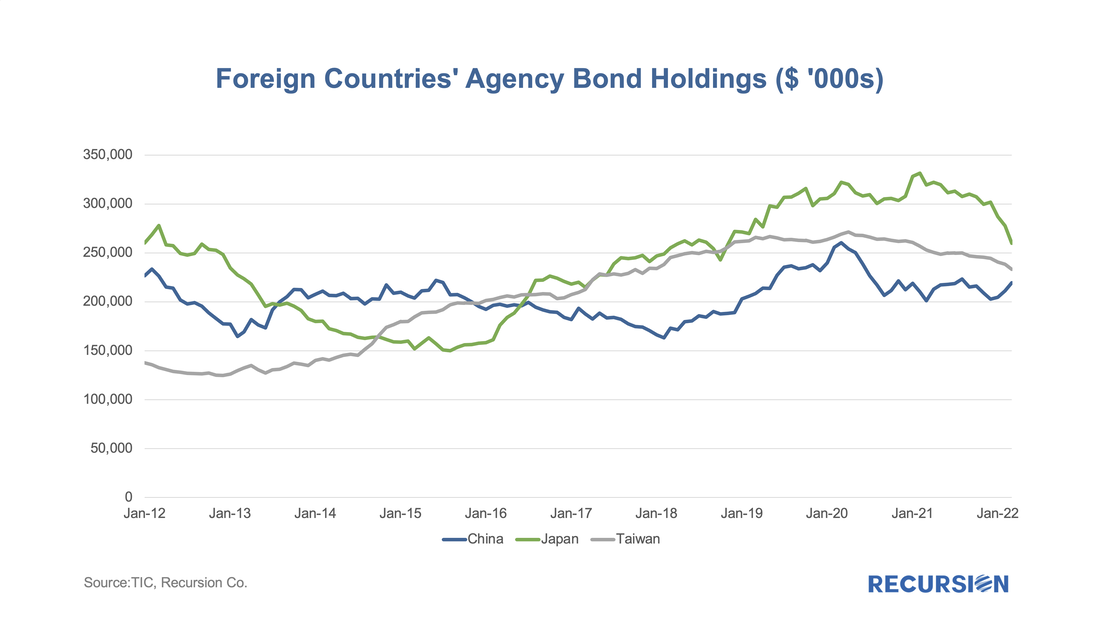 Back in 2021, we wrote a comment on the properties of the GSE Special Eligibility Programs designed to provide lower income households with access to mortgages (HomeReady for Fannie Mae and Home Possible for Freddie Mac)[1]. Given the increasing policy focus on the provision of credit to these households[2], it is appropriate for investors to look at the investment opportunities in this area. In this note, we look at the performance of HomeReady/Home Possible Program loans (referred as Low-Income Program in the following) vs. non-special-eligibility program loans, as measured by one month CPR, controlling coupon and vintage. We focus on just two such cohorts, 1.5% and 2.0% coupon pools of 2021 vintage. By loan count, the share of Low-Income Program loans in these pools by agency for May 2022 is: 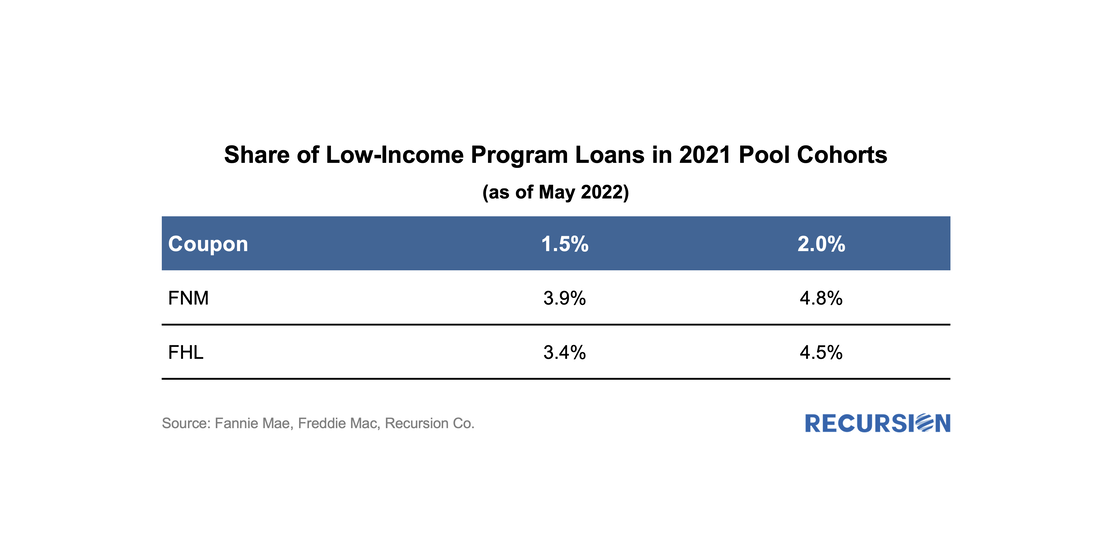 |
Archives
July 2024
Tags
All
|
 RSS Feed
RECURSION |
|

Copyright © 2022 Recursion, Co. All rights reserved.