|
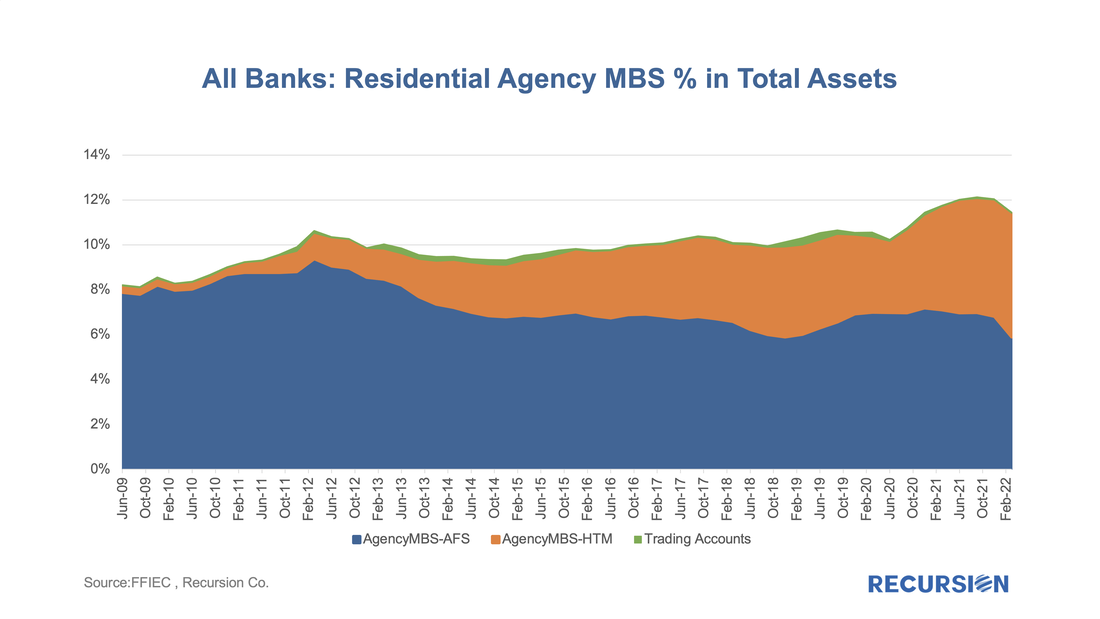
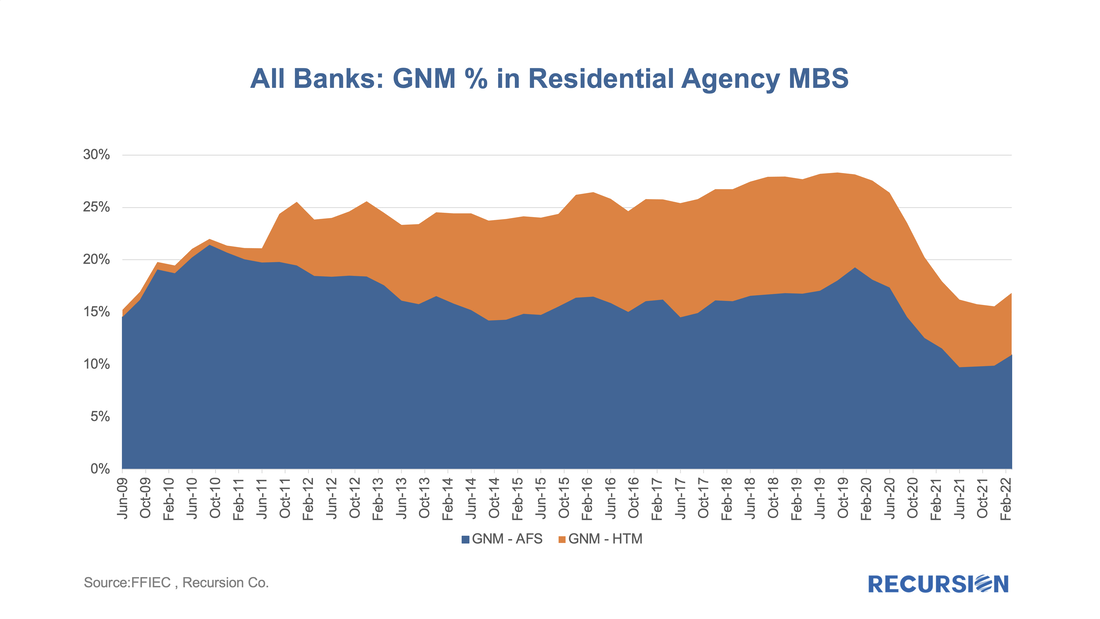
While the Fed has clearly been the dominant player in the MBS market for the last 13 ½ years, the consistent biggest holders of MBS have been the banks. When the Federal Reserve launched its QE program in late 2008, banks held about 16% of the outstanding balance at the time, and that share has more than doubled as of Q1 2022 to stand at about one-third of the total. In a recent blog, we dug into the details behind international investor behavior with an ancillary dataset[1], for the banks, we look for guidance from the Call Reports[2]. The Call Reports provide details on portfolio holdings of individual banks across financial asset categories (e.g., equities and bonds) for both loans and securities. For the purposes of this note, we just look at securities. What makes bank behavior so challenging to assess is that various types of policy actions have profound impacts on their investment decisions. To begin, we look at the share of residential agency MBS out of total bank assets, including both pass-through securities and CMOs: The share had been in a modest uptrend from 2014-2019, but the outbreak of Covid-19 in early 2020 served to launch investments in MBS to above 12% of total assets. It has been documented that some of the increase in this share was attained by a swap of mortgage loans into MBS as banks sought a guarantee for credit risk in uncertain times[3]. There was a modest retracement at the beginning of 2022, however. An interesting distinction in MBS holdings is whether banks classify them as Available for Sale (AFS) or Held to Maturity (HTM). (The small category of “Trading Accounts” is securities held by trading desks to support client transactions.) If a bank’s view about interest rates changes, it is free to swap securities in the AFS bucket for other securities or loans. The downside is that downward changes in the mark-to-market valuations of these securities flow into banks’ capital ratios, leading to pressure on their capacity to lend. By way of contrast, changes in values for securities held in the HTM category do not flow through into book value, but the downside here is that these securities cannot be swapped out without a substantial penalty being incurred. Recently, the share of MBS held in AFS accounts fell while that for HTM has picked up, indicating that some banks may be shifting assets from the first to the second categories to limit the sensitivity of their capital ratios to further increases in interest rates, i.e. to avoid mark-to-market volatility An additional benefit that can be obtained from this data is a breakdown of these holdings between conventional and Government MBS: There is a great deal that can be taken away from this chart, but the most striking development is the declining share of GNM in total MBS holdings in the wake of Covid. Recall that banks swapped loans for MBS during this period. As holdings of Government loans have traditionally been de minimis, this would almost exclusively add GSE MBS volume, and leading to a drop in Ginnie’s MBS share. This trend may be ending, however, as Ginnie’s status as a zero-risk security becomes more valuable as asset values decline and banks become more concerned about the availability of capital to invest. Our macro analyzer has this information down to the individual bank level. For bank analysts, this can be very useful in understanding changes in investment strategy for specific firms, as well as providing useful inputs to performance benchmarking. [1] https://www.recursionco.com/blog/a-note-on-asian-demand-for-mbs [2] https://cdr.ffiec.gov/public/ManageFacsimiles.aspx [3] https://www.recursionco.com/blog/banks-hang-on-to-mortgages-but-reduce-risk Recursion is a preeminent provider of data and analytics in the mortgage industry. Please contact us if you have any questions about the underlying data referenced in this article. |
Archives
July 2024
Tags
All
|
RECURSION |
|
Copyright © 2022 Recursion, Co. All rights reserved.


 RSS Feed
