|
In our third look at 2019 HMDA[1] characteristics we look at mortgage originations by income bracket. Lending to low- and moderate-income households is an important regulatory requirement of banks[2]. The definition of “low” and “moderate” depends on the local area in which the bank operates. HMDA data is well-suited to regulators looking to track the performance of the institutions they oversee and allows banks to benchmark their performance against their competition. If banks need to add low- to moderate-income loans to their portfolio to meet requirements, HMDA can provide direction regarding which institutions might be a source of product that meets needed characteristics. Below we present a quick high-level example. HMDA data operates down to the census tract level, but for our purposes here let’s look at two distinct states: California and Oklahoma. In 2018, median income in the two states was $70,500 and $54,400, respectively[3]. According to Zillow data[4], the median house prices in California and Oklahoma that year were $550,000 and $122,000 respectively. Clearly housing is relatively unaffordable for households at or below median income in California compared to Oklahoma. So it is not surprising that the homeownership rate in Q2 2018 for California, at 54.3%, is substantially below that of Oklahoma, at 69.1%[5]. Confirming this, the following table from 2018 and 2019 HMDA show that there is a substantially greater share of lower- and moderate- income loans available in Oklahoma than in California. Interestingly this share declined in 2019 relative to 2018, particularly for Oklahoma. It is not clear whether this is due to fundamental factors or technical issues related to an increase in the share of “N/A” responses between the two years. 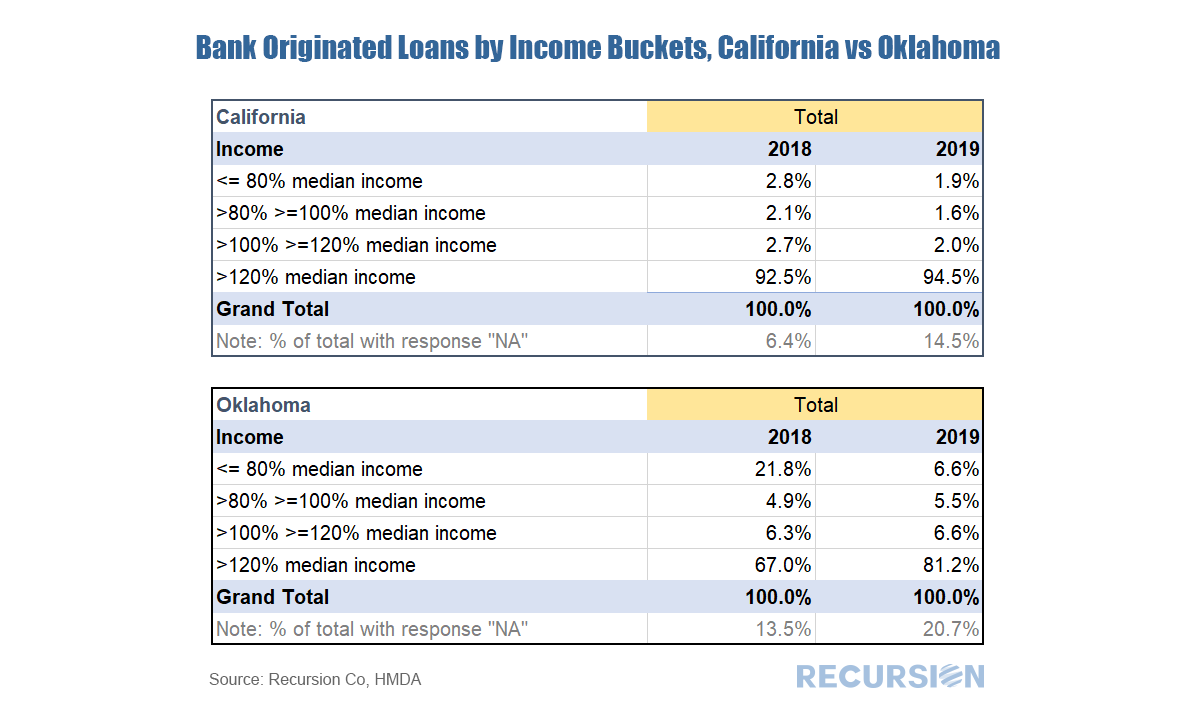 Finally, to be consistent with prior posts we look at the share of conforming loans originated by banks that are sold to the GSEs, broken down by income brackets: 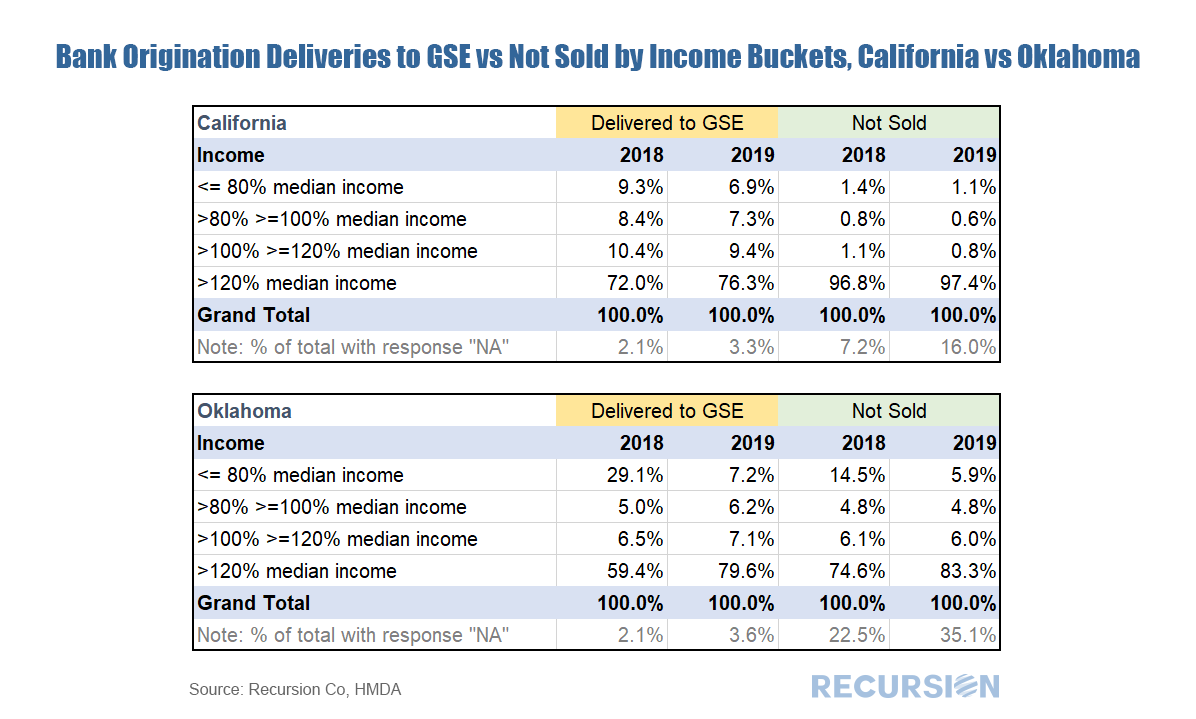 A few interesting observations pop up. First, in California the loans that banks keep on their book are almost entirely made to the highest-income households. For Oklahoma, it’s a mixture of highest income and lowest income. This suggests that policy requirements regarding serving poorer communities plays a relatively greater role in Oklahoma than California. [1] The first two 2019 HMDA blogs are available at
https://www.recursionco.com/blog/what-is-the-credit-quality-of-loans-held-on-book https://www.recursionco.com/blog/credit-quality-held-on-book-2-looking-at-ltv [2] See for example, https://www.fdic.gov/regulations/resources/director/virtual/cra.pdf [3] Data from 1984 – 2018 can be found https://www2.census.gov/programs-surveys/cps/tables/time-series/historical-income-households/h08.xls [4] Taken from June 2018 data at https://www.zillow.com/ok/home-values/ and https://www.zillow.com/ca/home-values/ [5] https://www.census.gov/housing/hvs/data/rates/tab3_state05_2020_hmr.xlsx In a recent post we looked at the differences in bank underwriting characteristics between those conforming loans held on book compared to those delivered to the GSEs using data pulled from Recursion HMDA Analyzer[1]. We now extend this into another dimension via the addition of LTV. Below find the difference in share of such deliveries between sold loans and those held on book: 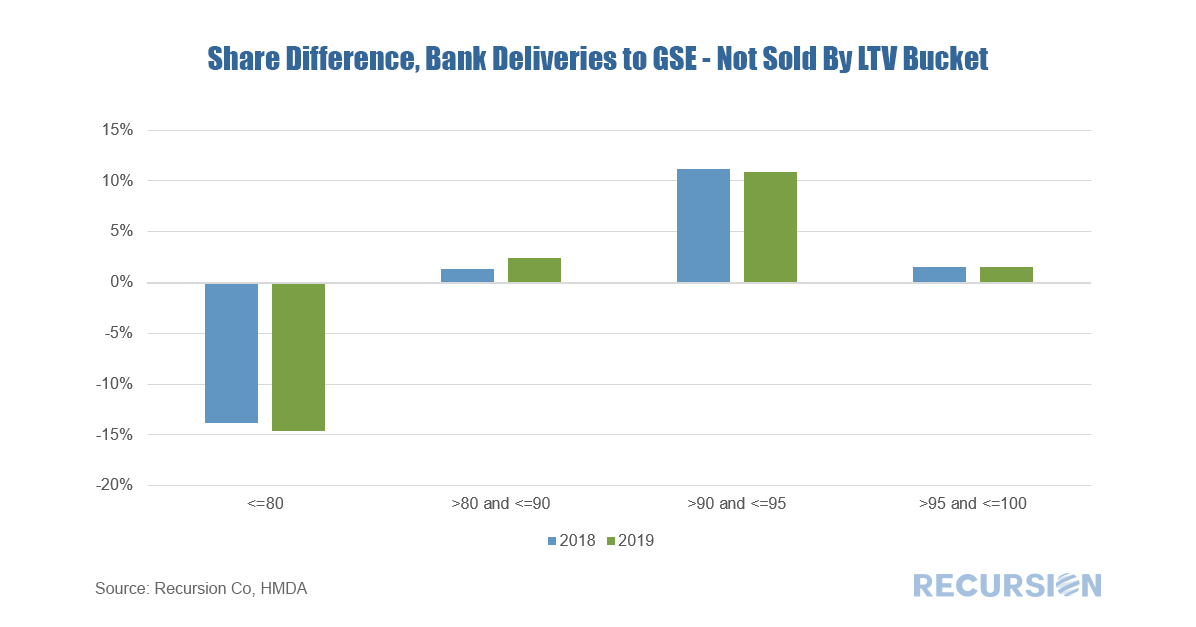 As is the case for residential mortgages, every month Ginnie Mae publishes data on loan-level delinquencies for its commercial real estate programs. The structure is a bit different than for single family, with different categories (the dominant one being FHA multifamily, but also hospitals and nursing homes). In this short post we look at recent performance for FHA multifamily and nursing homes. Traditionally, multifamily DQs for FHA are low because these loans are concentrated in affordable housing, where there is a persistent condition of excess demand. The costs of eviction are low and new tenants are ready to move in. But this is not necessarily the case in the COVID-19 era as the economic impact falls most heavily on the lower income working class, so there are fewer people who can afford affordable housing without support from government income programs such as jobless benefits. 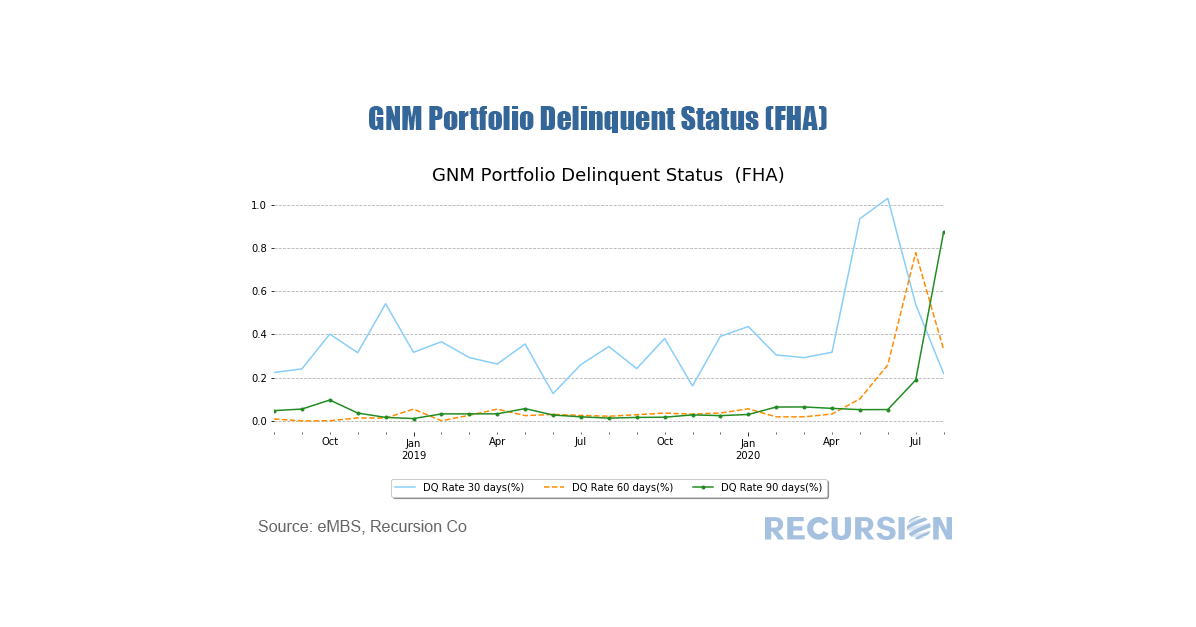 U.S. Treasury yields ticked up last week, prompting speculation about how yields might change going forward.
In the article “Point/Counterpoint: The Case for Low Interest Rates”, Liz Moyer and Peter Nurse from Investing.com take opposite sides of the issue, with Moyer arguing that rates are likely to stay low, and Nurse arguing that the economic recovery and stimulus programs set the stage for rates to rise. In the article, Recursion’s Chief Research Officer, Richard Koss, commented on the implications of secular shifts in the economy caused by the COVID-19 crisis, noting that these shifts don’t support predictions of a big increase in yields. Read the full article at the following link: https://www.investing.com/news/economy/pointcounterpoint-the-case-for-low-interest-rates-2266938 With the release of 2019 HMDA data, we now have two years of loan-level information that contains both demographic and credit characteristics. Demographic information in HMDA includes income, race, and geography down to the census tract level, while credit characteristics include DTI. Our agency loan level databases contain a richer set of information regarding lending characteristics, but limited data on geography and demographics. For institutions looking to benchmark their performance in affordable and minority lending for regulatory purposes, 2019 HMDA, with data on thousands of lenders, is an invaluable tool. If you are interested in finding out more, please reach out. There are of course policy uses for this data as well. A significant difference between HMDA and the agency pool loan-level data is that HMDA contains data for loans held on book, the so-called “Unsold” category. This allows a comparison of loans that banks originate and keep and those they deliver. We can break this down in any number of ways, but let’s look at it for conforming loans broken down by DTI. 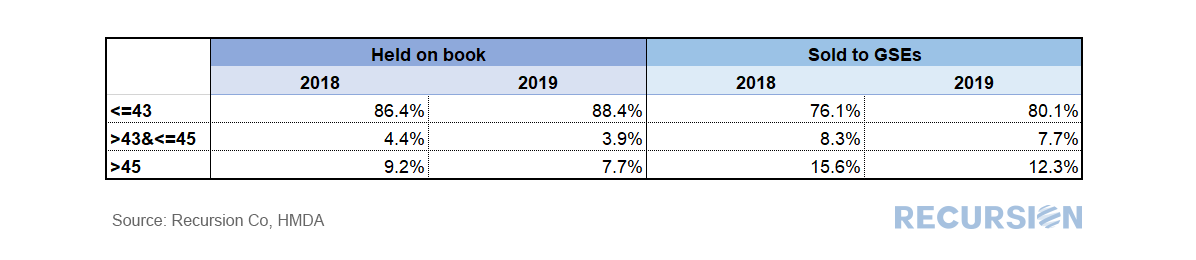 In the table above, we can readily observe that banks tend to keep higher-quality loans (as measured by DTI<=43) compared to those they deliver to the Enterprises. Of course, this is not a complete picture of this issue; there are many other ways to slice the data (credit score, LTV, loan size, geography). Moreover, as there is a correlation between low LTV and desirable loan characteristics for regulatory purposes (minority status, low income), we cannot simply conclude that it’s a matter of keeping the best for themselves. A second interesting question is: did behavior in this regard change between 2018 and 2019? Below you can find a chart of the change in the distribution between unsold and delivered loans between these two years. 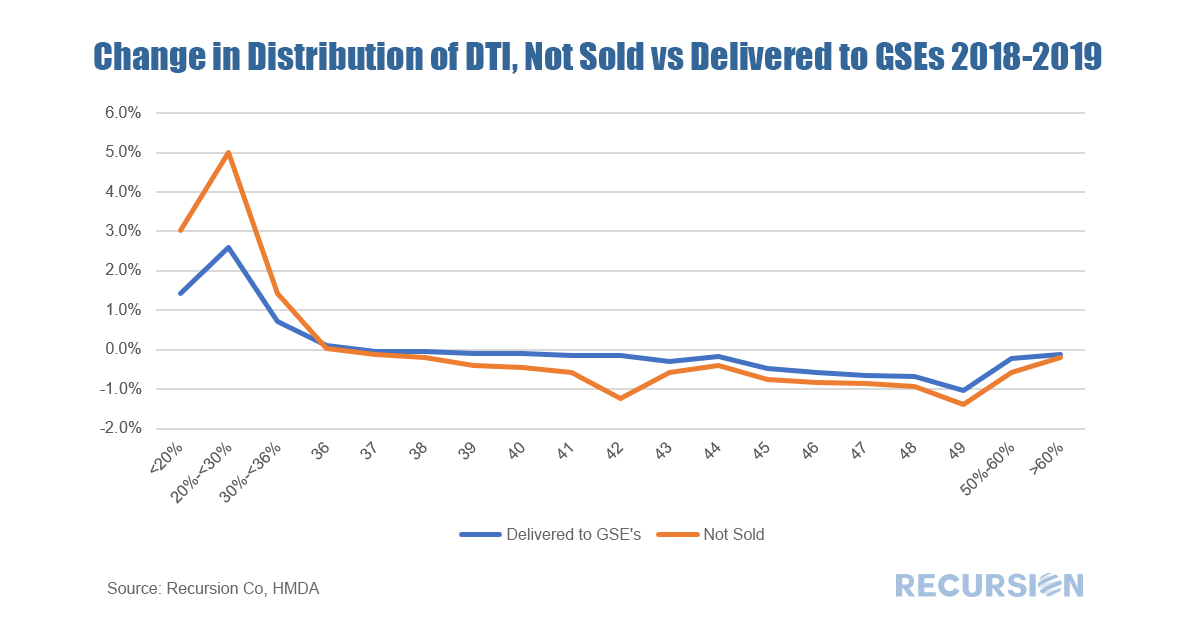 It appears that banks kept more of the loans associated with very low levels of indebtedness (DTI<35) in 2019 compared to 2018, while they distributed a small share of higher-risk loans across the spectrum of DTIs above that level.
Explanations for such behavior are the subject of future research. In a recent post we looked at the agency composition of the recent surge in MBS production[1]. We observed that Ginnie Mae’s market share in the three months to July 2020 is significantly below that experienced in the same period a year ago. The bulk of the decline is due to a drop in the refi share, while the purchase market share experienced less than a 1% decline. There are several drivers of share for purchase market share, including program design, the coupon spread between the government and conforming sectors, and differences in the credit boxes between the two. This note looks at competitiveness through the lens of the latter factor, credit boxes. As noted in the prior post, Ginnie Mae is the securitizer for four different programs, with the two biggest being FHA and VA. VA has a fairly unique set of program requirements, so the main competition in the purchase mortgage space is between FHA and the GSEs. In the three months to July 2020 FHA lost about 2.5% of its share in the purchase mortgage space compared to the GSEs. Let’s dive into credit factors, starting with credit score: 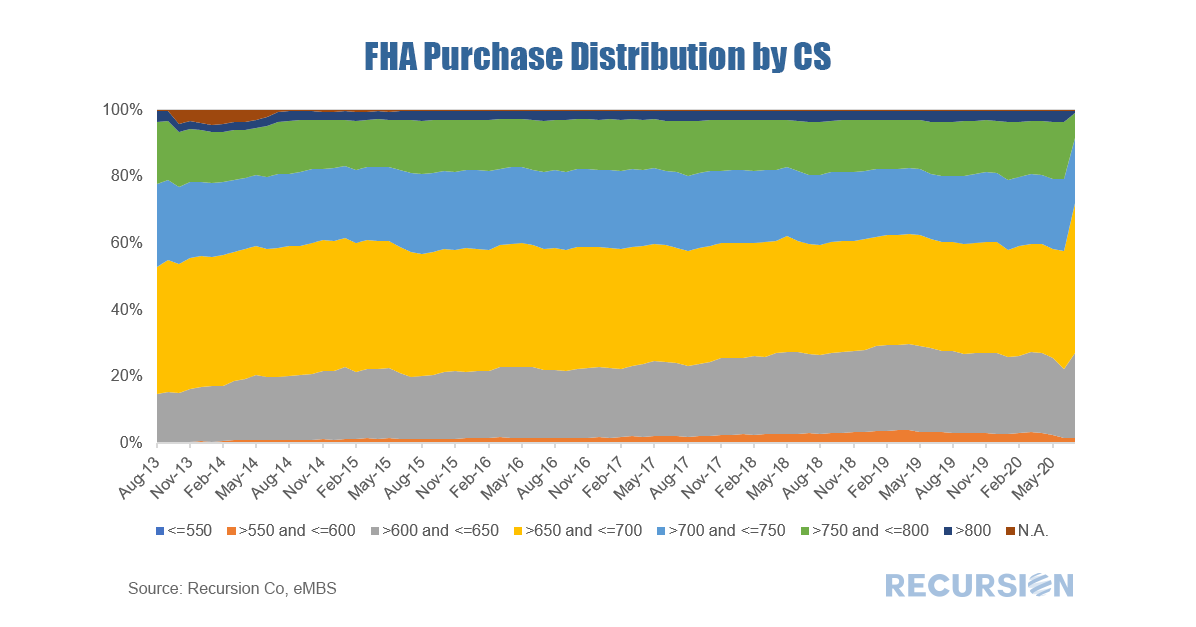 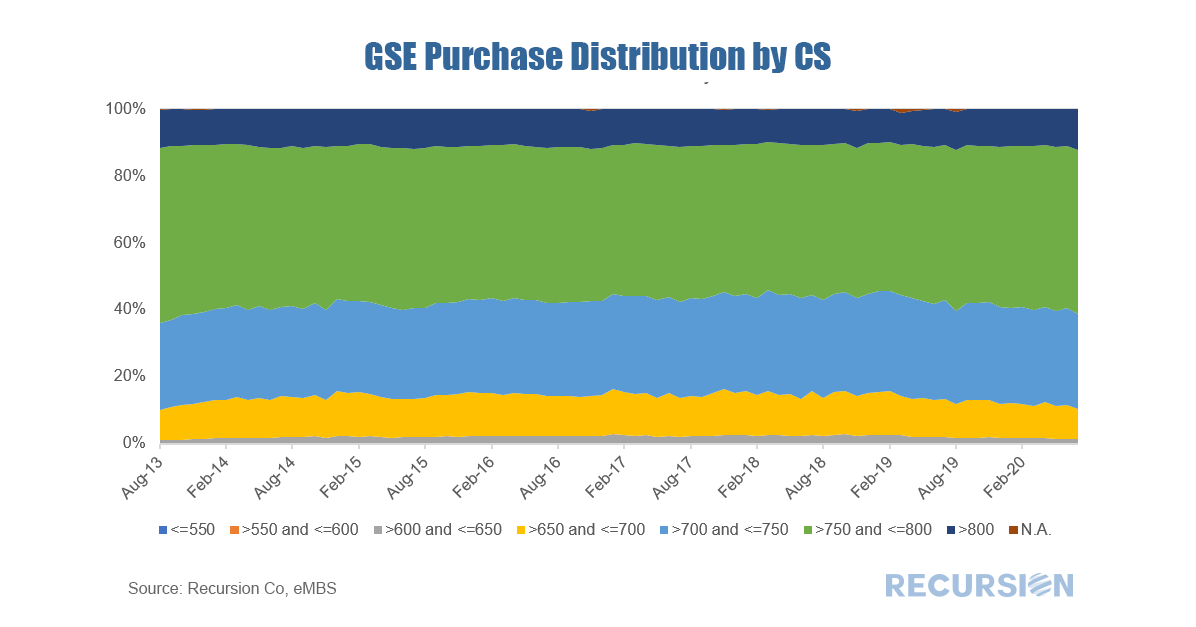 2019 HMDA data has been released and is loaded into Recursion’s HMDA Analyzer so clients can perform consistent queries back to 1990. As always, a vast wealth of information is available. Below are several high-level observations. First, total originations rose by over $700 billion compared to 2018[1], a 13-year high. The bank share fell for the eighth consecutive year, reaching a record low of 37%. This was down 1 percentage point from 2018, the smallest decline posted for 8 years. Nonetheless, banks have suffered a remarkable 30-point drop in market share since 2008. 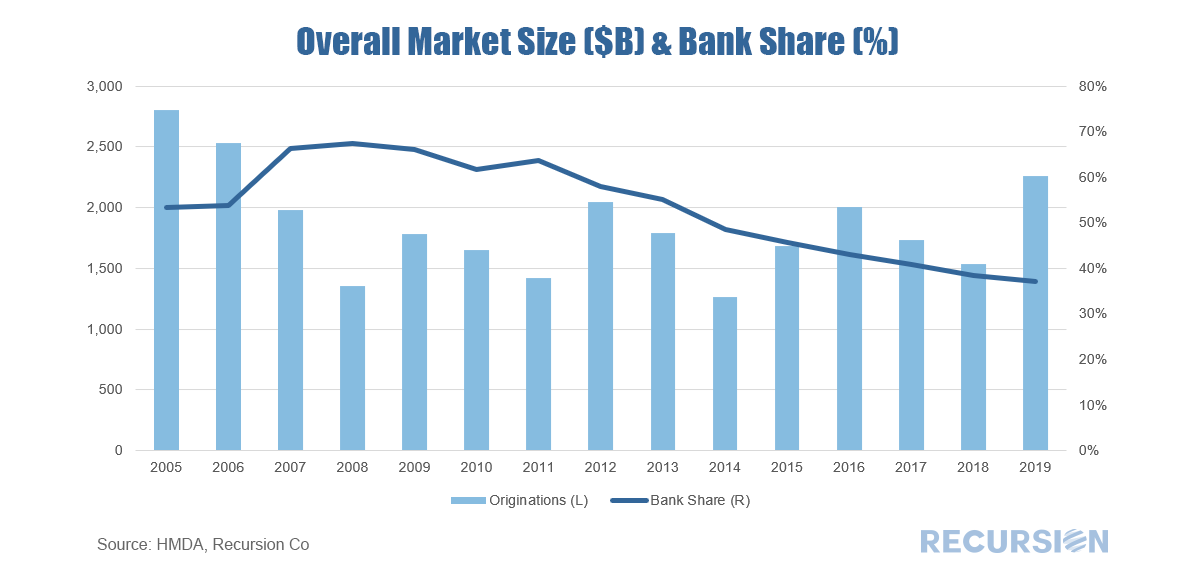 In a recent post[1], we discussed how changes in pool rules at Ginnie Mae resulted in surging prepayments in their securities. Last week, the fine folks at DebtWire picked up this story and discussed innovations being proposed to finance this activity at Credit Suisse[2].
The risks posed in the new age of COVID-19 can only be met by financial and technological innovation. We’re pleased to see DebtWire acknowledge our contribution to formulating an effective response. |
Archives
July 2024
Tags
All
|
 RSS Feed
RECURSION |
|

Copyright © 2022 Recursion, Co. All rights reserved.