|
With affordable housing for Low-Moderate Income (LMI) households at the top of the policy agenda, we take a look at loan data for manufactured housing (MH). In a recent report, the CFPB provided a comprehensive survey of this market based on enhancements to the HMDA data first made available in 2018[1]. These include data on Secured property type:
In their survey, the CFPB looked deeply into the data for 2019. In this note, we update some of their work with 2020 HMDA data. This is important because of the onset of Covid-19 that year. The site-built market performed strongly, but this cannot necessarily be presumed to carry over to MH as Covid is a supply shock, impacting labor markets and supply chains. Another innovation in this note is that rather than looking at this market by state the way the CFPB does, as a policy guide we look at it bifurcated between rural and nonrural MSAs. Below finds a chart of the progression of single-family manufactured housing origination volumes for personal loans (securitized by chattel) and mortgages (securitized by real property) from 2018-2020, along with the share of all single-family manufactured housing loans (personal loans plus mortgages) of the total single-family mortgages including those for site-built homes. 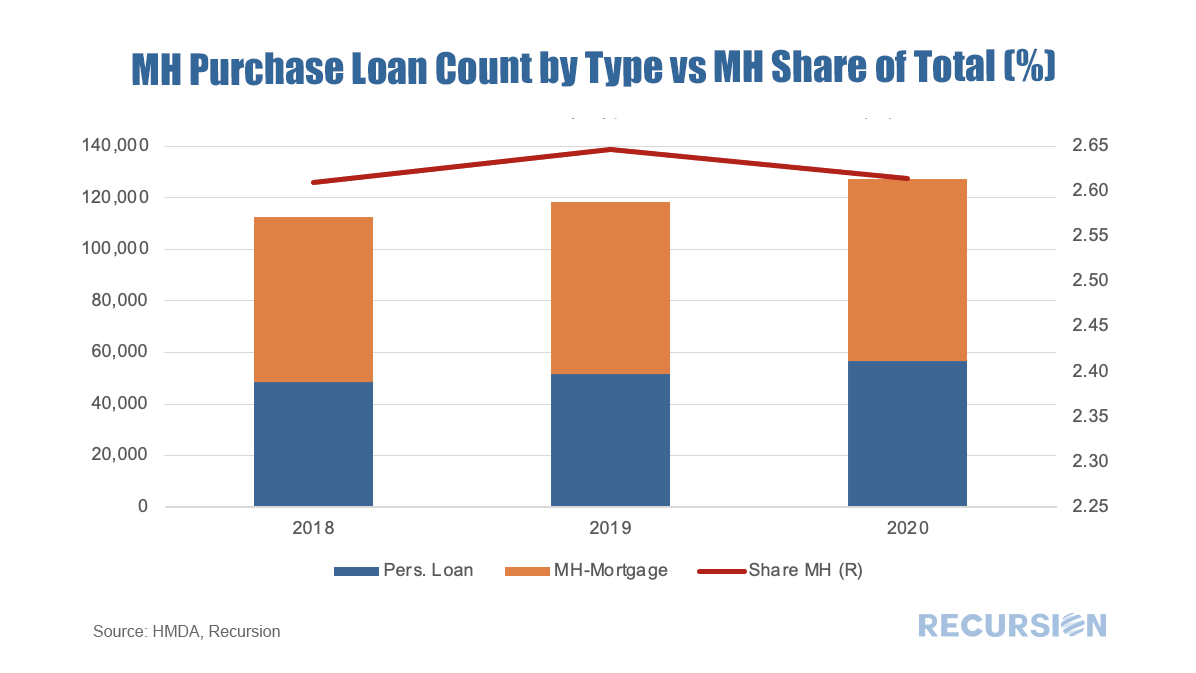 In a recent post[1], we discussed using Recursion’s proprietary tools to unravel the Federal Reserve’s MBS holdings of Fannie Mae and Freddie Mac loans. The Fed’s holdings, however, are part of a bigger picture issue regarding the notion of “float” in the MBS market, that is, the amount of securities outstanding that are available to trade. The holdings of the central bank serve to reduce the float as the Fed is a buy-and-hold investor. These loans are said to be “locked up”. Besides the Fed, loans can be locked up in structured products, notably Collateralized Mortgage Obligations (CMOs). The first CMOs were launched by Freddie Mac as Real Estate Mortgage Investment Conduits (REMICs) in 1988 and allow cash flows to be tranched to meet the needs of different investors[2]. Pools in CMOs’ collateral groups are also locked up. 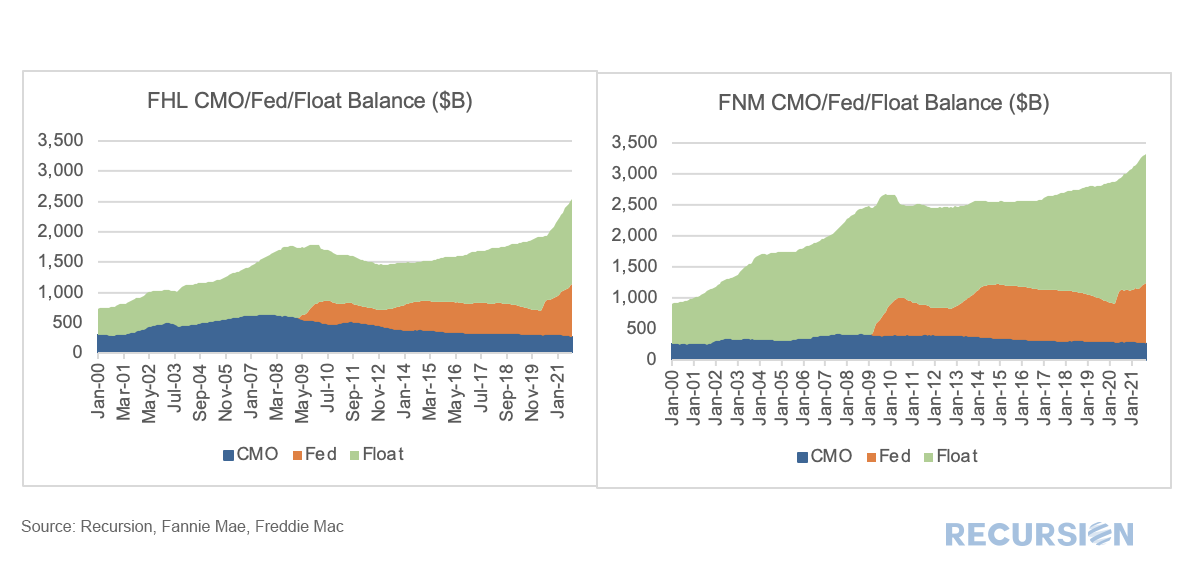 To read the full article, please send an email to [email protected] With talk of taper at the top of the monetary policy discussion, it is worthwhile to dig a bit into the role of the Federal Reserve in the functioning of the MBS market. As is well known, the onset of the Covid-19 pandemic resulted in a resurgence of central bank purchases of Agency mortgage-backed securities (MBS). Chart 1 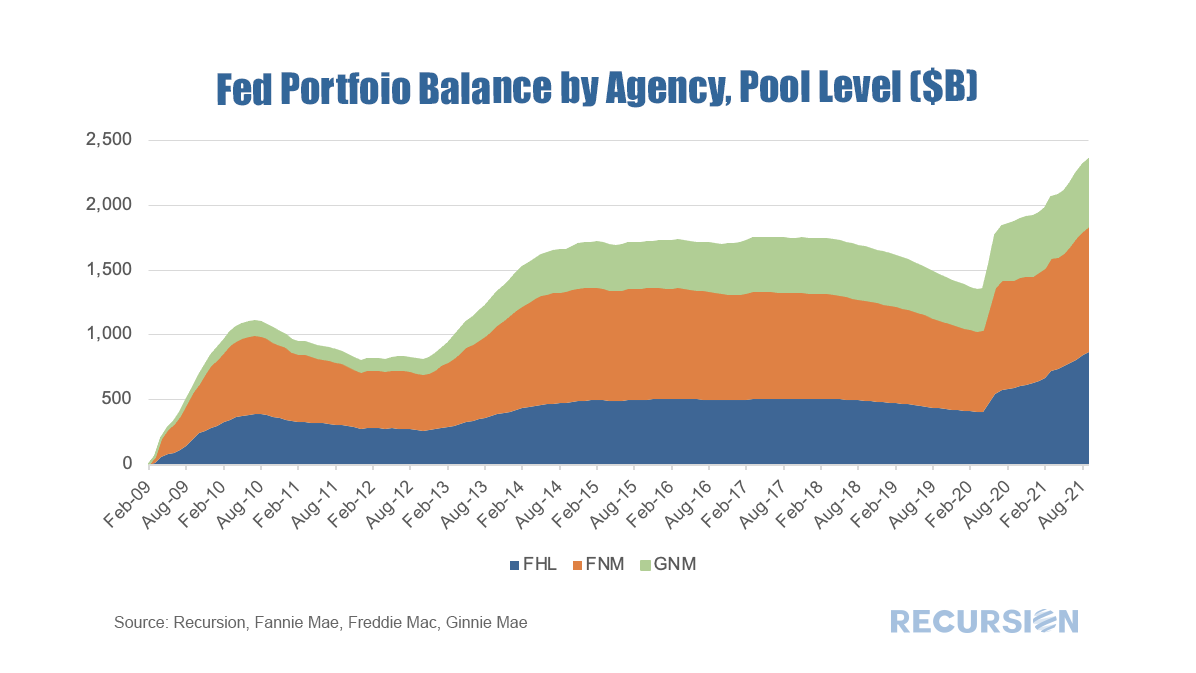 Financial support for rural communities has been a feature of US economic policy since the Farm Credit System was established as the first GSE in 1916[1], sixteen years before the Federal Home Loan Banks were established in 1932[2]. This support continues to this day and has expanded to encompass additional programs. Ginnie Mae Program While the best-known collateral for Ginnie Mae securities is loans underwritten through the FHA and VA programs, another form is loans underwritten by the US Department of Agriculture Rural Development (RD) Program, launched in 1990 as part of the Farm Bill passed that year[3]. The Single-Family Direct Home Loan Program[4] in particular is designed to provide payment assistance to low- and very-low-income households in rural communities. Of course, FHA and VA provide loans in rural areas under the terms of their programs as well. GSE Rural Lending Single-family lending at Fannie Mae and Freddie Mac was handed a mandate to provide liquidity to rural communities through the adoption of the Duty-to-Serve provision of the HERA Act enacted in 2008[5]. This program requires the GSE’s to engage in activities to facilitate liquidity in three underserved markets:
A key feature of this regulation is that FHFA has provided new datasets and tools to enhance the analysis of these markets[6]. In particular, Rural Areas FHFA's Duty to Serve regulation defines "rural area" as: (1) a census tract outside of a metropolitan statistical area, as designated by the Office of Management and Budget; or (2) a census tract in a metropolitan statistical area, as designated by the Office of Management and Budget, that is outside of the metropolitan statistical area's Urbanized Areas as designated by the U.S. Department of Agriculture's Rural-Urban Commuting Area Code #1, and outside of tracts with a housing density of over 64 housing units per square mile for USDA's RUCA Code #2. Below is a link to the specific geographies which meet the Rural Areas definition. Using this segmentation, we are now in a position to load their definition into our databases and look at trends in this market segment. Using HMDA data as a base, we produce the following chart[7]: 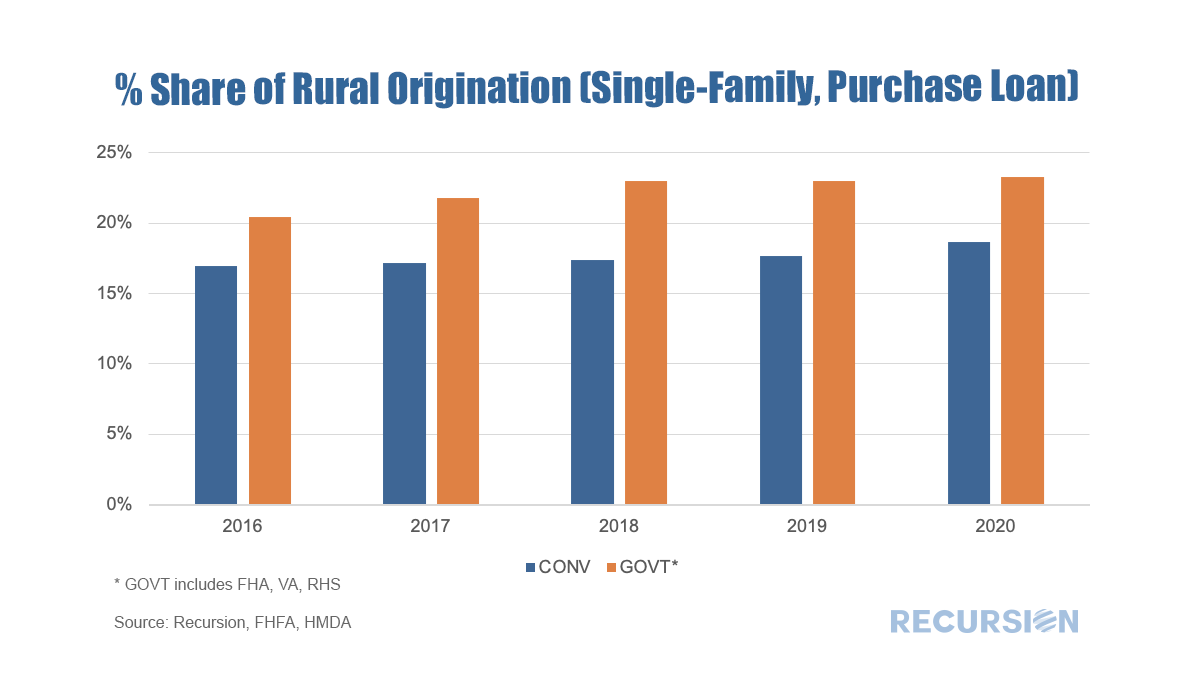 In a recent post[1] we looked at the evolution of the FHA purchase mortgage market share broken down between areas with a high percentage of Low-Moderate Income (LMI) households and those without. While the overall FHA share has generally declined since the onset of the pandemic, its share has held up in areas with a preponderance of LMI households. There are many factors behind these trends, but a natural consideration is underwriting standards. To examine this factor, we use the Recursion Matched Dataset[2], where we create a large sample of loans with characteristics from both HMDA and the Agency disclosure data. A very high share of mortgages can be matched using our proprietary algorithm over the years 2018-2020. The coverage ratio from the Matched Dataset is provided in a previous post[3]. We proceed by looking at three major underwriting characteristics for LMI and non-LMI areas for FHA and the GSE’s: Credit Score (CS), Loan-to-Value (LTV) and Debt-to-Income (DTI), Most interesting is Credit Scores: 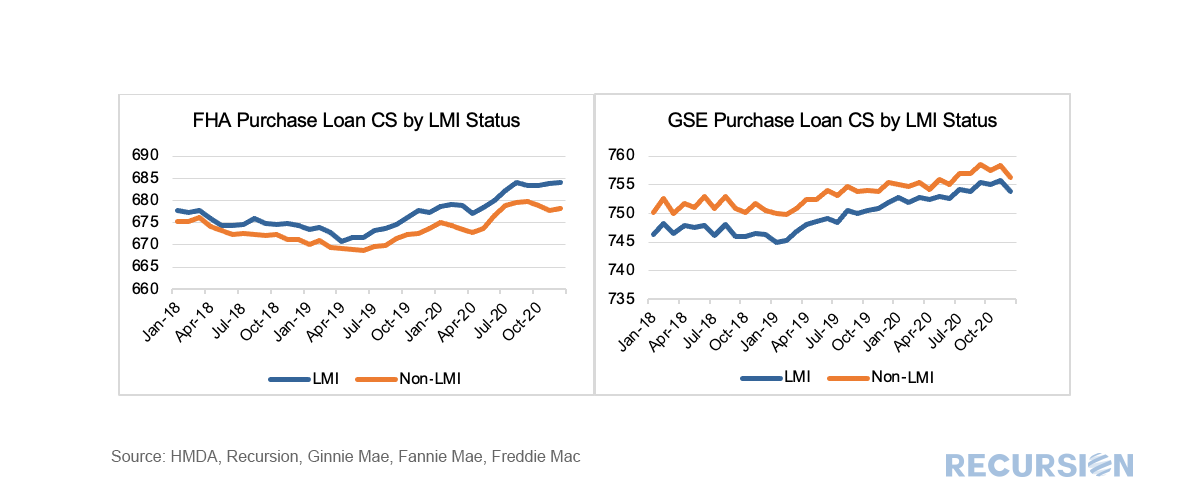 |
Archives
July 2024
Tags
All
|
 RSS Feed
RECURSION |
|

Copyright © 2022 Recursion, Co. All rights reserved.