|
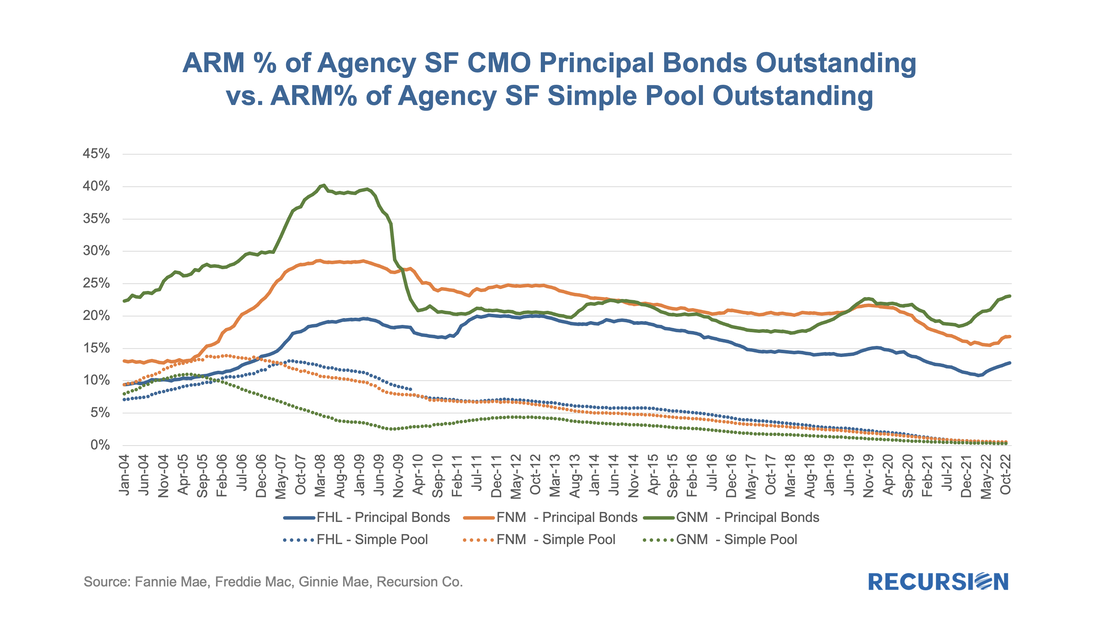
In a previous note, we pointed out that the ARM share of single-family MBS issuance, while on an increasing trajectory, was well below that achieved in prior periods of rising interest rates[1]. There are several possible reasons for this, including bank demand for these types of loans. The new supply (less than 1% of total UPB in recent years) we see in agency pools falls well short of demand for floating rate instruments in the current environment. The solution to this problem comes in the form of financial engineering. Our Recursion CMO Analyzer is a useful tool for examining trends in this market.
Pooling financial collateral brings a number of advantages to fixed income markets, notably liquidity enhancement. But there are other benefits to be had as well. First, a CMO can tranche the cash flows from mortgages based on specific factors such as maturity dates and interest rates. This allows investors to optimize their investments with respect to their views on these underlying factors. ARM bonds are popular in these structures relative to simple fixed-rate pools: With interest rates significantly higher than those in place at the start of the year, it’s natural that potential homebuyers look for ways to reduce borrowing costs. One of these ways is through an adjustable-rate mortgage (ARM). Now that we have complete data for July, it is a timely moment to look at recent trends in ARM issuance. As we approach the topic, it’s important to note a few institutional points. First, the ARM programs available to conventional and Government borrowers are distinct, so we break the issuance down between GSE and Ginnie pools. Second, the market underwent a significant shift with the elimination of LIBOR as a benchmark[1].
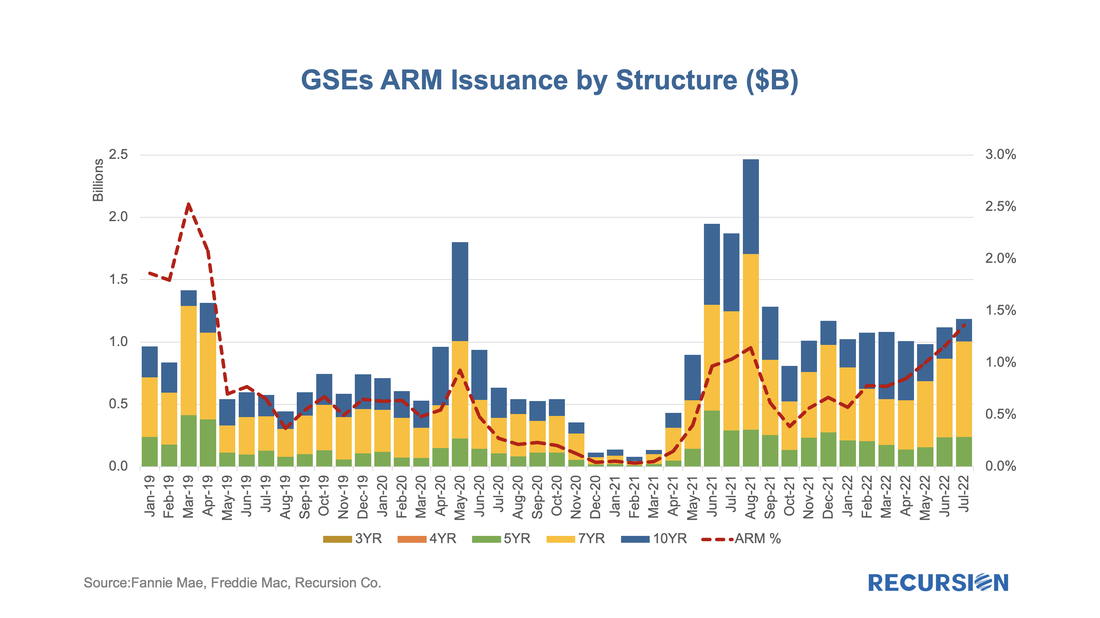
Let’s start with the conforming market. There are several product types, but in July 2022, the largest is 7-year ARMs, followed by 5-year and 10-year ARMs: |
Archives
July 2024
Tags
All
|
RECURSION |
|
Copyright © 2022 Recursion, Co. All rights reserved.


 RSS Feed
