|
In a previous note, we pointed out that the ARM share of single-family MBS issuance, while on an increasing trajectory, was well below that achieved in prior periods of rising interest rates[1]. There are several possible reasons for this, including bank demand for these types of loans. The new supply (less than 1% of total UPB in recent years) we see in agency pools falls well short of demand for floating rate instruments in the current environment. The solution to this problem comes in the form of financial engineering. Our Recursion CMO Analyzer is a useful tool for examining trends in this market. Pooling financial collateral brings a number of advantages to fixed income markets, notably liquidity enhancement. But there are other benefits to be had as well. First, a CMO can tranche the cash flows from mortgages based on specific factors such as maturity dates and interest rates. This allows investors to optimize their investments with respect to their views on these underlying factors. ARM bonds are popular in these structures relative to simple fixed-rate pools: 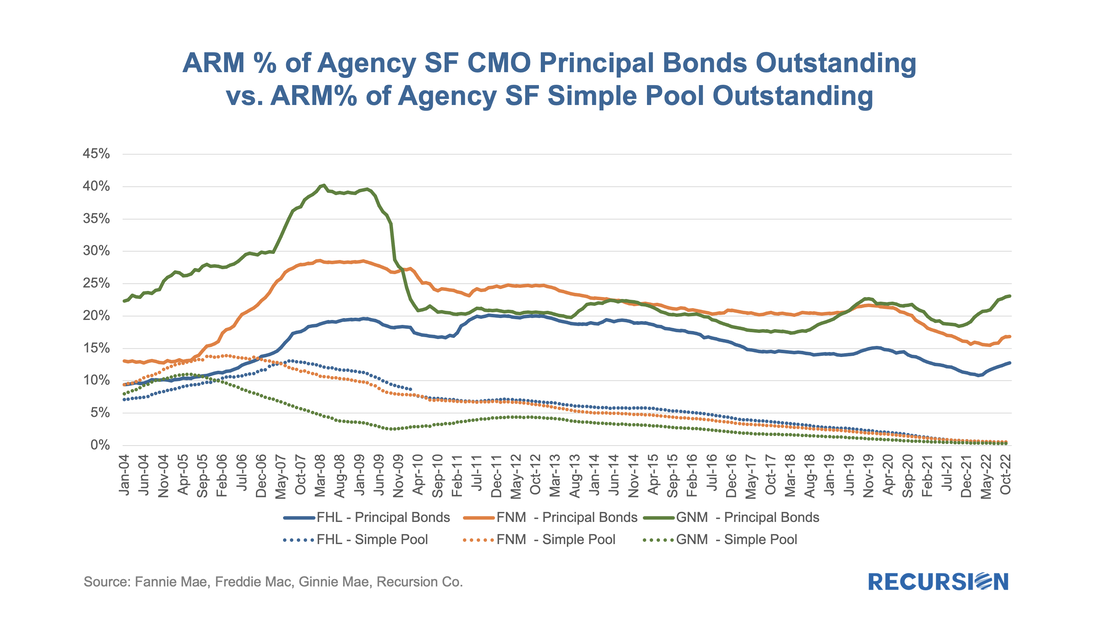 The total volume of SF Principal CMO bonds outstanding as of November 1 is $943 billion (including Re-Remics), about 11% of $8,560 billion of simple pools. So CMO Principal Bonds appear to be the preferred way for investors to obtain ARM exposures in this asset class. An interesting note can be obtained by looking at the floater shares of new issuance in this space[2]: 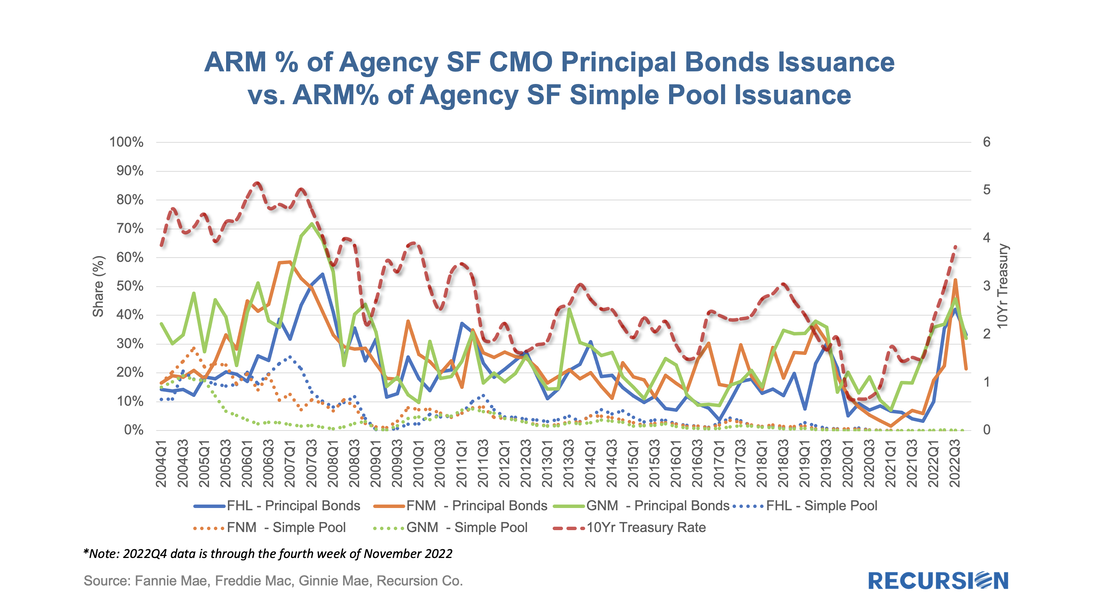 There is a distinct correlation between the ARM shares and the 10-yr Treasury rate. There are many takeaways here but of note is that the ARM share may have peaked in Q3 2022, indicating that the market view towards higher bond yields may be abating. To created floaters out of fixed collateral, interest only bonds with an interest rate that moves inversely to market rates, known as an Inverse Interest Only (IIO) security must be created[3]. Hedge funds are the main investors for this type of investment vehicle due to the requirement of analytical sophistication and highly leveraged prepayment risk. The following is the ARM % of IO/IIO. 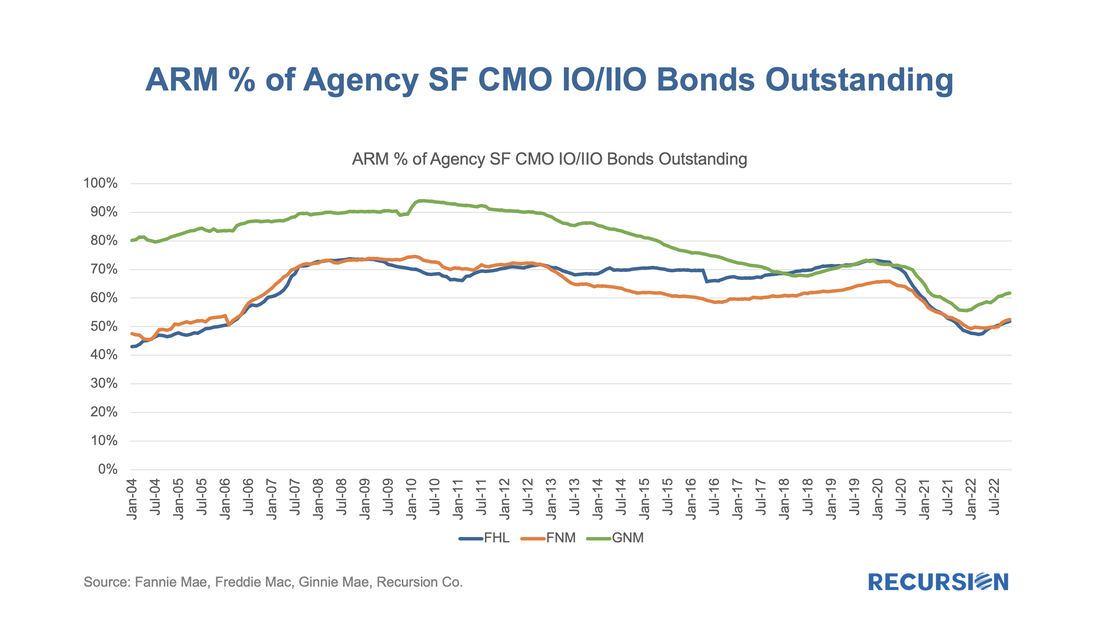 This chart is similar in shape to the first chart for Principal Bonds, but as IIOs are intrinsically floaters, the ARM % of IO is understandably much higher than principal bonds. The denominator for the shares given in the chart is the notional amount of all IO bonds ($153 billion) and IIO bonds (187 billion), so we obtain close to 55%/45% shares of IOs vs. IIOs. This is considerably smaller than the outstanding volumes of the Principal bonds but enough for the formation of a liquid market. It is estimated that over 95% of the collateral supporting the IIO pools is fixed-rate collateral, with an IIO overlay. Developments in financial markets are useful indicators of shifts in market demand. The fast development of new products in response to these shifts is a key feature of Wall Street firms. Often this takes the form of complex structures such as CMOs. In turn, these products can provide actionable information to a broad swath of market participants. Obtaining these signals requires the use of powerful cloud-based tools that Recursion is in a unique position to provide. [1] https://www.recursionco.com/blog/floating-on-higher-rates [2] Note that the data in this chart are provided quarterly as issuance is very lumpy so some smoothing is needed to discern the underlying trend. [3] The payment is based on a formula that is something like payment = benchmark rate minus market rate. Slightly more complex formulations would like benchmark rate – 3x(market rate). Recursion is a preeminent provider of data and analytics in the mortgage industry. Please contact us if you have any questions about the underlying data referenced in this article. |
Archives
July 2024
Tags
All
|
 RSS Feed
RECURSION |
|

Copyright © 2022 Recursion, Co. All rights reserved.