|
This is the third and (for now) final entry in our series of posts regarding appraisal modernization. The first describes the framework of data disclosures provided by the GSEs[1], while the second looks at differences in usage of the various programs between Fannie Mae and Freddie Mac and between banks and nonbanks[2]. In this note, we look at loan prepayment performance and the drivers behind it. Here we see 1-month CPRs and loan rates for purchase loans issued in 2023 with waivers and those eligible for waivers but did not obtain one: 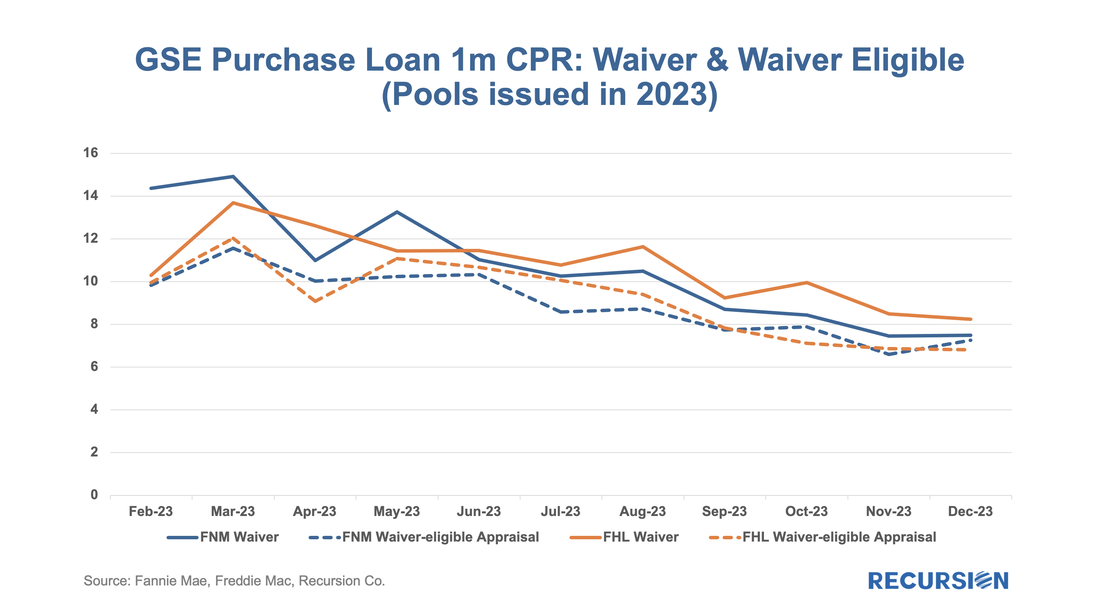 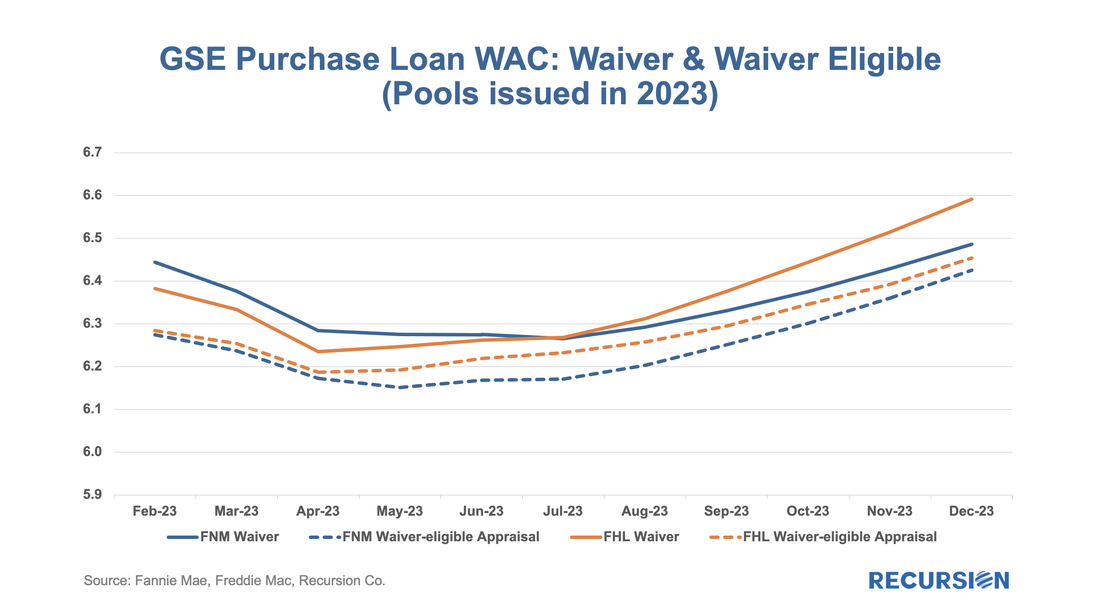 Those loans eligible for waivers but that obtain appraisals have lower loan rates and prepayment rates than loans with waivers, likely due to relatively reduced uncertainty surrounding valuation. Another key result that can be obtained from the chart is the more recent development whereby loans delivered to Freddie Mac with waivers have displayed persistently higher speeds than those delivered to Fannie Mae over the last six-month period. This corresponds with an increase in the pace of growth in FHL coupons compared to those of FNM over this period. It’s natural to ask if there are differences in loan characteristics that account for this gap. Below find the corresponding data for average credit scores across these categories: 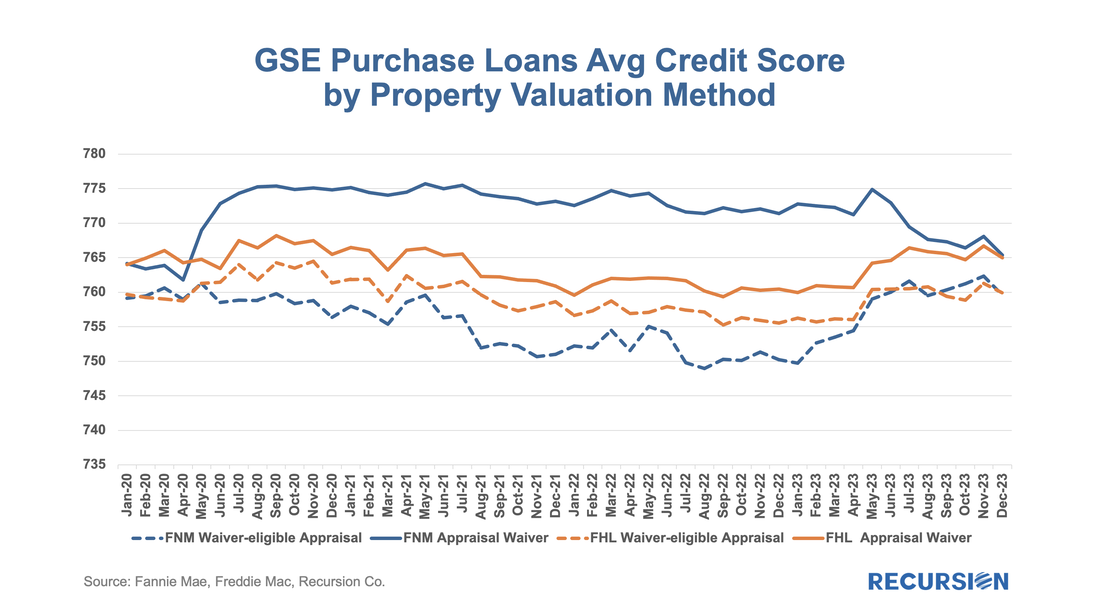 Over the past six months, FNM has loosened its credit standards for waivers as measured by credit scores relative to Freddie Mac. As this would tend to boost FNM coupons vs FHL, another explanation would seem to be required. We can speculate that FHL is discouraging waivers for its own risk-management purposes, but there is no verifiable support for this view. We can, however, see if this pattern persists in the newer appraisal types. 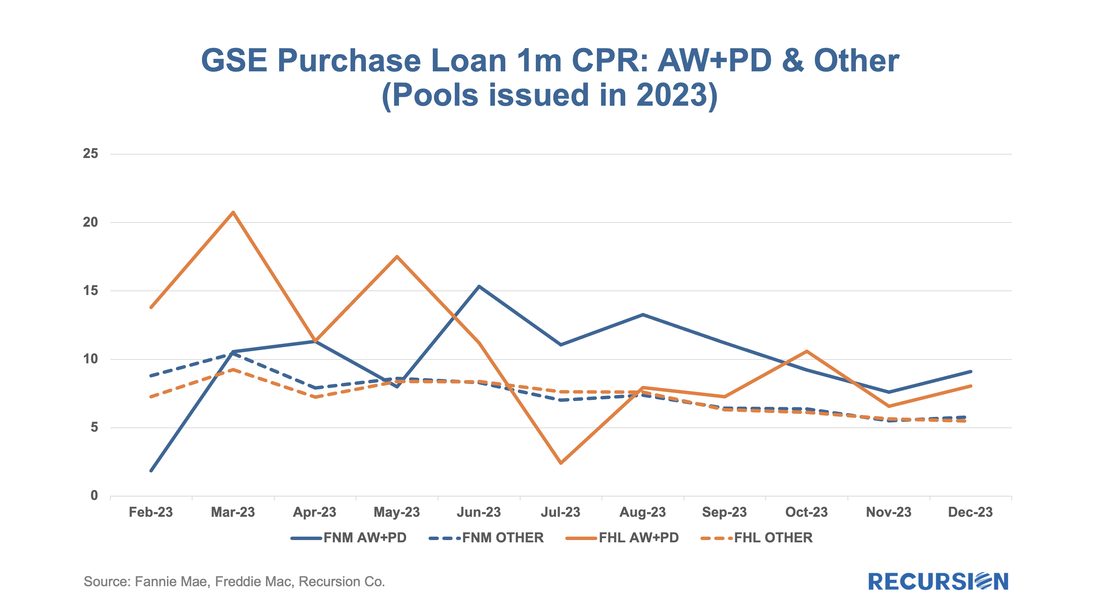 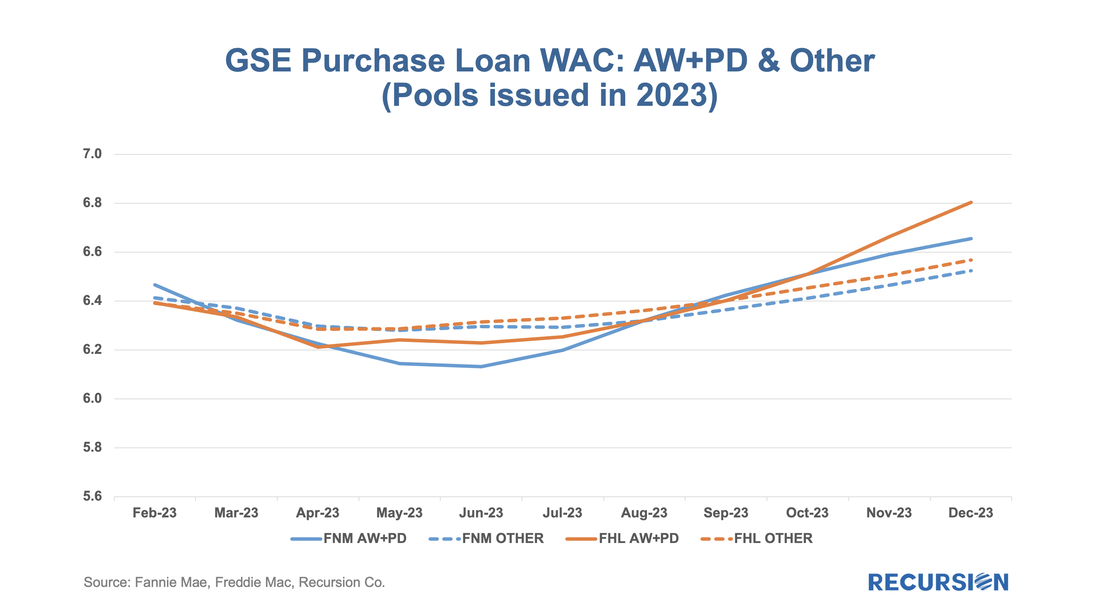 The loan counts here are quite small, so it is not surprising to see a noisy CPR chart for these categories. On the other hand, the trend increase in FHL AW+PD loans relative to those of Fannie Mae can be seen, although it is a more recent development in this case. Our conclusion is there is enough distinction here to say that modelers and traders ought to keep an eye on collateral risk as an independent factor in their decisions. As daily April Agency mortgage loan delivery data completed, we found convincing evidence that the freeze in market activities we have witnessed since the fourth quarter of 2022 is continuing, although there are some new twists. Here is the chart for the loan counts of purchase market deliveries to the GSEs back to 2019. Rather than do this as a time series, we stack the years over an annual monthly x-axis to better correct for the seasonality in the time series: 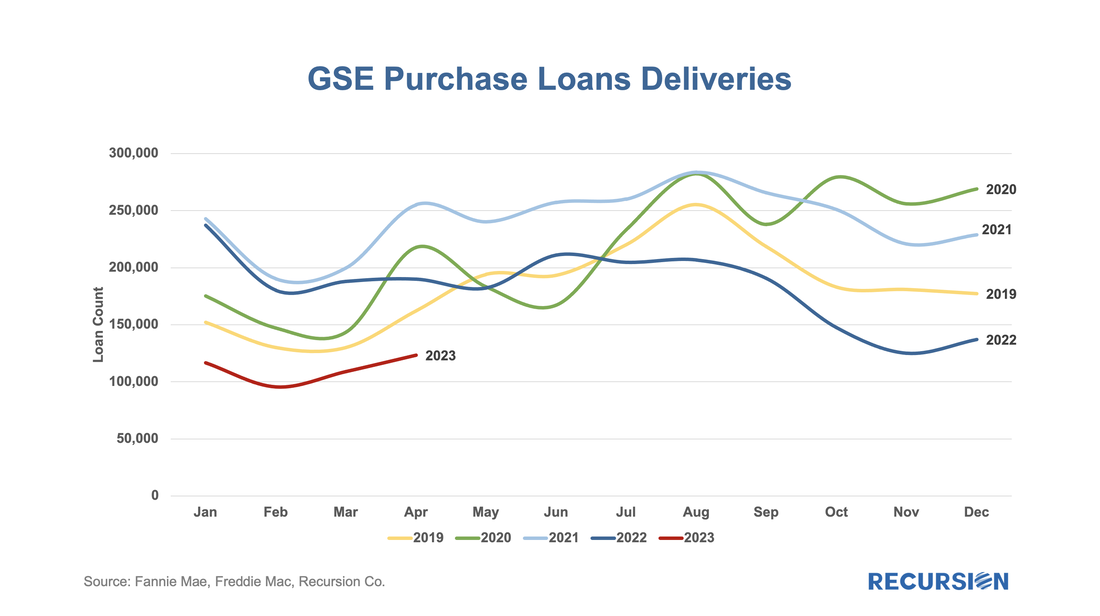 Recursion analysis of trends in short-term delinquencies of Ginnie Mae programs was highlighted in a recent article in National Mortgage News entitled "High-risk defaults could be 'canary in the coal mine' for mortgage market". "The rate of early payment defaults — defined as at least two missed payments within the first six months of a mortgage — has doubled during the past year for borrowers of Federal Housing Administration-backed loans, according to data from the mortgage-analytics firm Recursion." The article goes on to quote our analysis that this trend is notable for lower credit score articles in the FHA program. This has occurred in a period of robust job market, raising the issue that delinquencies may rise further if the recent hike in interest rates by the Federal Reserve results in stalled growth or a recession. Again, more market participants are turning to Recursion to obtain the most up-to-date insights into mortgage market trends. 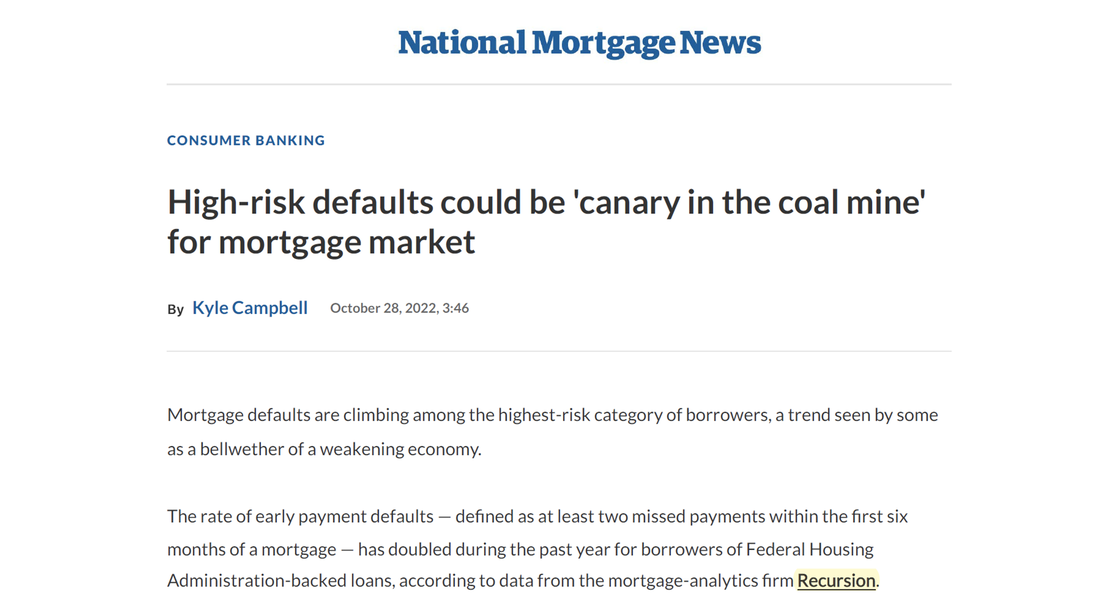 The article can be found here. (Subscription may be required)
For more information, please reach out to [email protected]. With data in hand for the first half of 2022, it seems a good time to revisit the topic of the share of issuance between the two GSEs. This is also, at least implicitly, a hot topic in policy circles following the announcement on the part of the GSEs that they will be imposing a 50 bp fee on commingled Super and CMO pools starting on July 1[1]. Regular readers of our blog will recall how we pointed out that the Fed purchases of Super pools created an imbalance in favor of Freddie Mac loans that may have been a contributing factor to their rise in market share in 2020 and 2021[2]. Interestingly, the Freddie Mac share of GSE purchase loans has fallen back. As shown in this chart, the FHL share of delivery peaked in August 2021 at 56%, while most recently it stood at 42%. 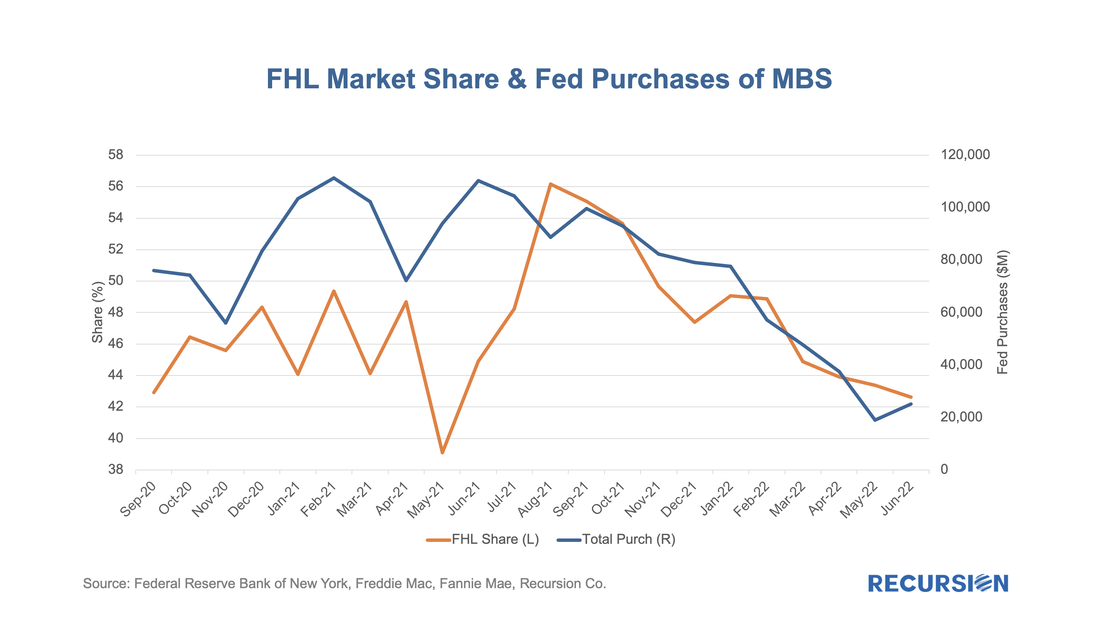 Over the past couple of years, we’ve witnessed some volatility with regards to FHFA’s approach to mortgages on second homes and investor properties (sometimes referred to non-owner occupied housing or NOO). In January 2021, FHFA announced that caps would be imposed to limit the acquisitions of loans backed by second homes and investment properties to 7% of the total on a rolling 52-week basis[1]. These caps were then suspended in September of that year. Then, on January 5, 2022, FHFA announced targeted fee hikes on second home mortgages and jumbo mortgages on loans delivered to Fannie Mae and Freddie Mac, to be implemented on April 1, 2022[2]. These up-front fees are tiered by LTV and for second home mortgages range from 1.125% and 3.875% and for high balance loans range from 0.25% and 0.75%. Borrowers in special affordability programs[3] are excluded from these fees, as are first-time homebuyers in high-cost areas whose incomes fall below 100% of the area median income. To see what if any impact these fee hikes have had on the targeted market segments, we look first at the share of conventional loans broken into second homes, investment homes and others, as measured by loan count. 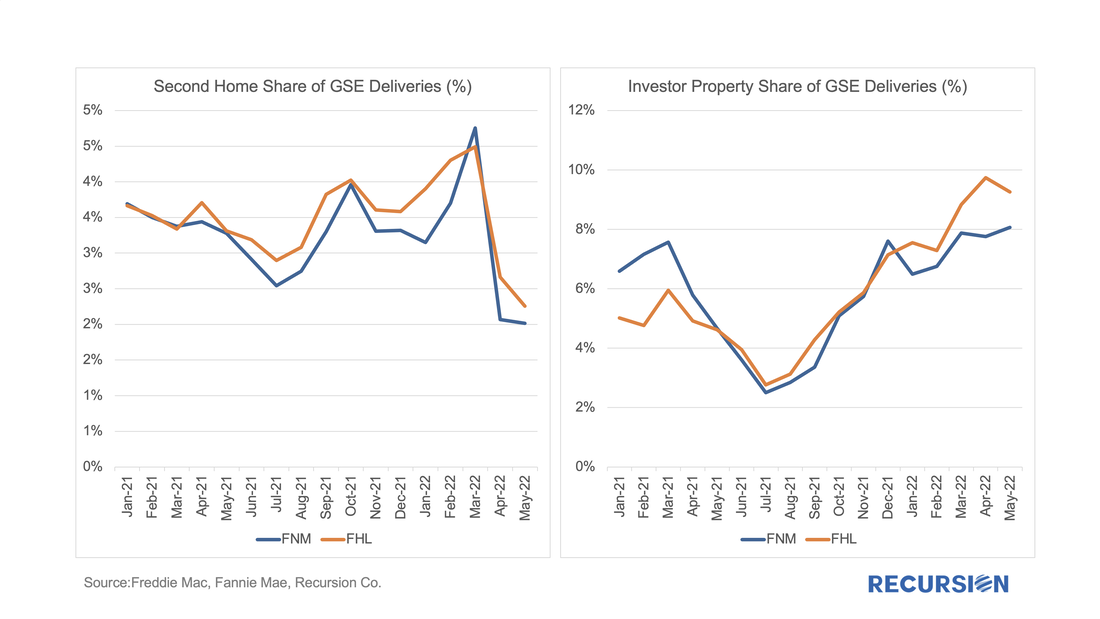 We’ve noticed that the prevalence of appraisal waivers for purchase mortgages within the eligible population peaked in Q4 last year, and recently has gone into steep decline. Our working thesis as to what is behind this trend is that lenders are getting concerned about the rapid pace of home price increases and want the additional security associated with an on-site appraisal. If this is indeed the case, we should see a greater decline in this share for larger mortgages than for smaller ones. So we break up the universe by GSE, and by loans above and below 2021’s conforming loan limit of $548,250: 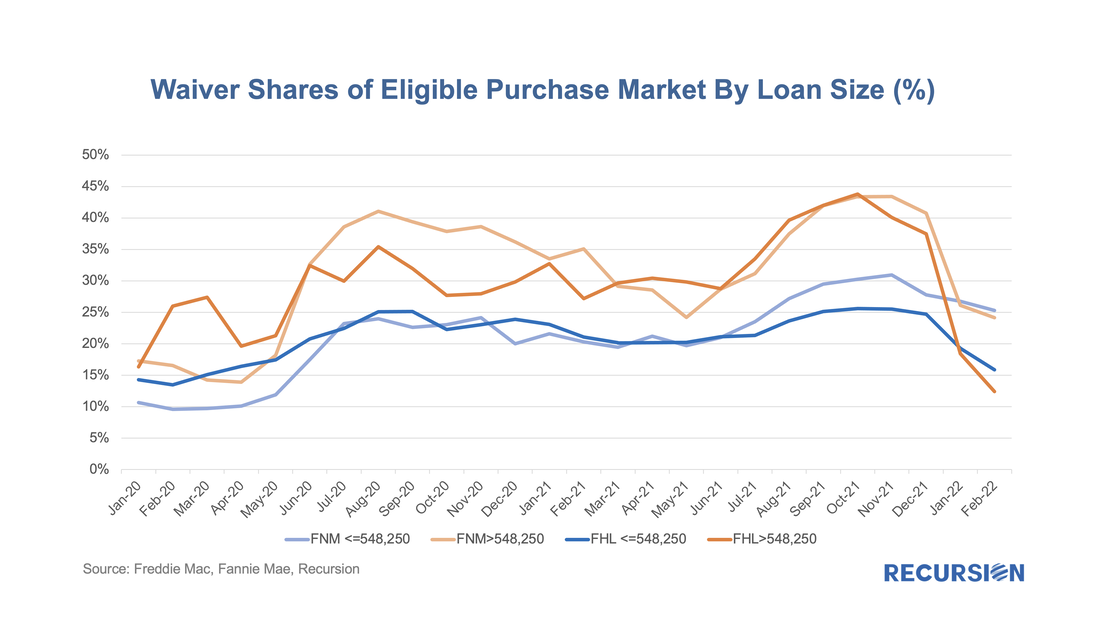 As mortgage rates have moved up recently, we have observed some changing trends in underwriting characteristics associated with GSE new issuance. According to Freddie Mac, the US weekly average 30-year fixed mortgage rate stood at 3.89% as of Feb 24, 2022, which is about a 1.3% increase since the record low level of 2.65% was reached on Jan 7, 2021. 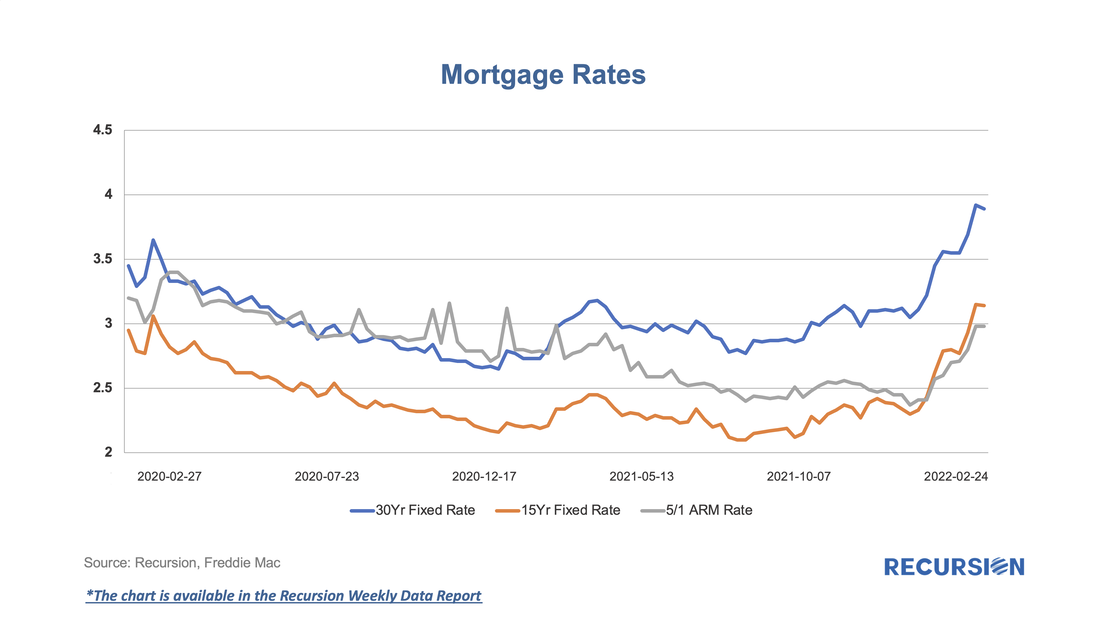 As mortgage rates decline, originators become capacity constrained and allocate credit to the highest-quality borrowers. Similarly, to keep lending pipelines full, originators are likely to loosen up their underwriting standards when rates rise. After declining in recent years when interest rates were low, GSE new issuance purchase loans with DTI over 45 started to increase again in the second half of 2021, especially for Fannie Mae, as mortgage rates began to rise. Nonbanks have historically been more active in lending to higher DTI borrowers, but recently the gap between banks and nonbanks has narrowed. 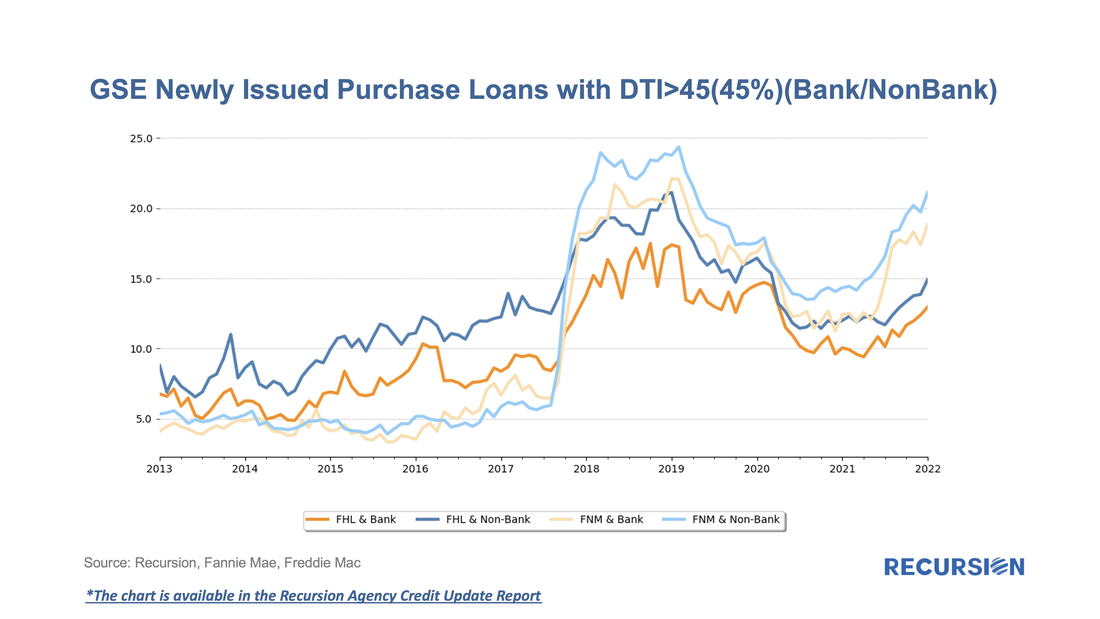 We have observed similar trends in credit scores. After the decline in the shares of low credit score borrowers in 2019 and 2020, sellers have recently been delivering an increasing share of loans with credit score less than 680 to the GSEs. 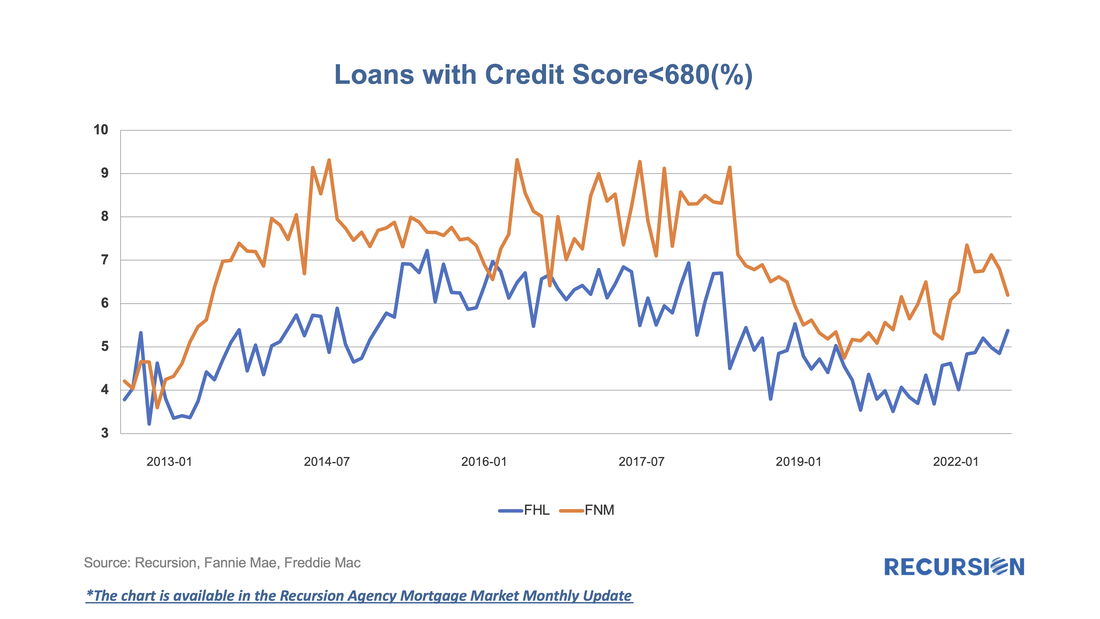 We observe these trends by tracking our monthly data reports. If you are interested in the outlook for mortgage market developments, reach out to [email protected] and subscribe to Recursion Reports!
Mortgage market analysis in 2022 is setting up to be very much focused on the impact of expiring forbearance programs. In this post, we look at the FHA program from this perspective. With the onset of the pandemic, FHA began to apply “Partial Claim”s, a seldom-used loss mitigation method to help its mortgage borrowers cope with financial difficulties stemming from the pandemic.[1] A Partial Claim is a no-interest junior claim consisting of missed P&I payments secured by the property that comes due when the first lien is extinguished. Ginnie Mae created a new pool type, the RG pool, mainly to take delivery of the loans received via a partial claim, after they successfully made six6 consecutive payments. Another FHA innovation is the availability of an automatic modification that allows borrowers exiting forbearance to have access to a program that reduces monthly payments by up to 25%[2] without impacting their credit. The result has been a sharp change in the composition of FHA loans delivered to Ginnie Mae program over the past year. 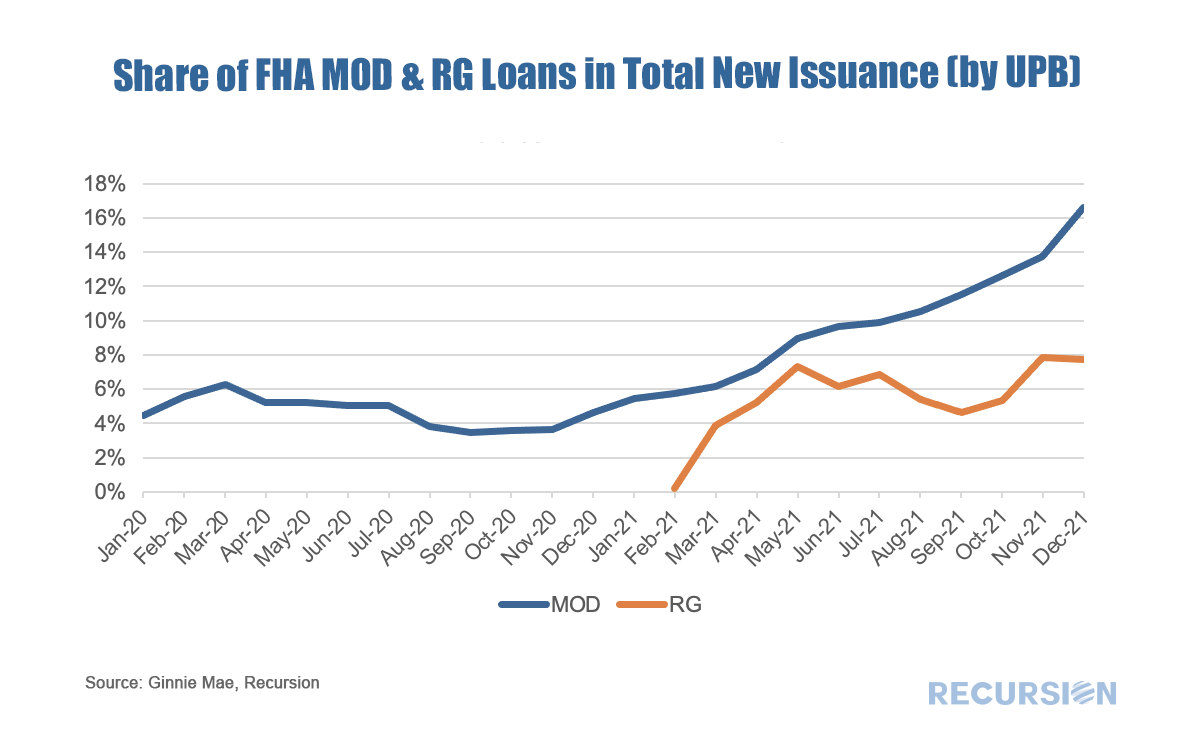 This changing composition will likely have a measurable impact on pool performance. In this regard, it’s interesting to look at the credit scores of borrowers across loan types. 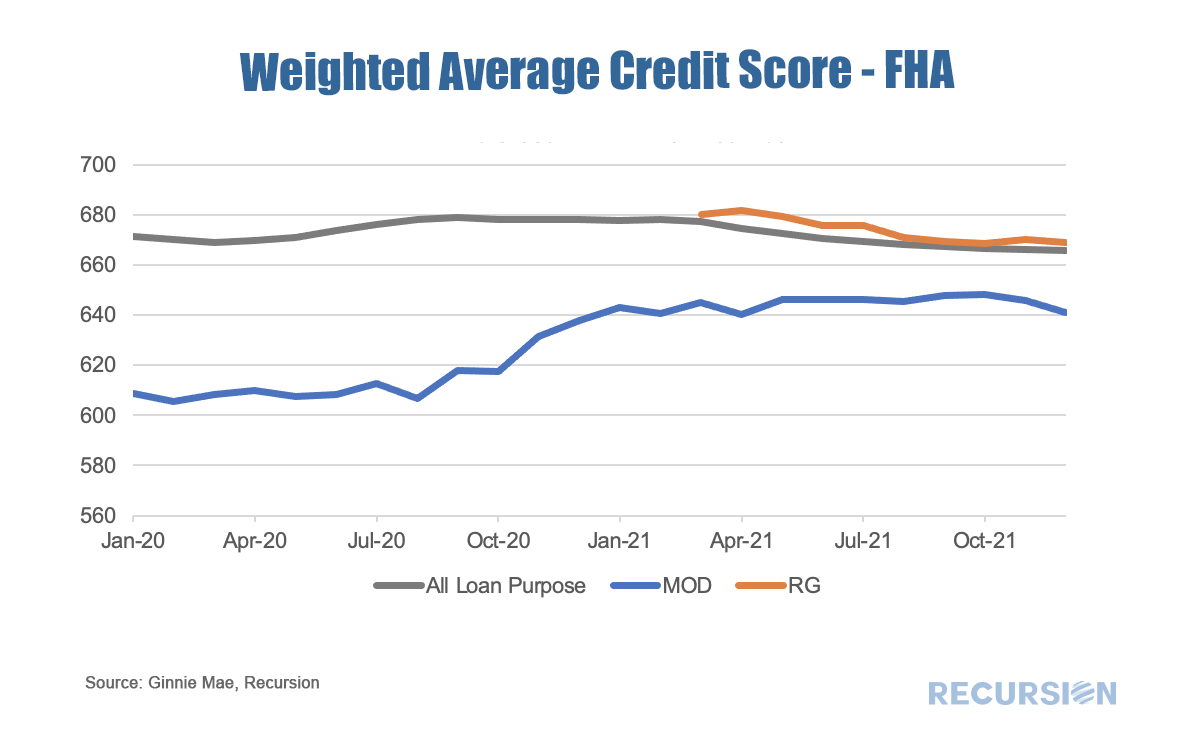 Original Credit scores for RG loans look very much like those in the overall pool. And while credit scores for modified loans remain below those overall, the gap has narrowed since the new waterfall was made available. As a result, we are once again in the situation where we can’t confidently extrapolate historical trends about the relationship of loan performance and economic factors like interest rates and unemployment as a basis for decision-making. Instead, it is the details in the policy changes designed to keep borrowers in their homes that provide the clearest view on market performance. |
Archives
July 2024
Tags
All
|
 RSS Feed
RECURSION |
|

Copyright © 2022 Recursion, Co. All rights reserved.