|
The loan-level data releases we receive early each month contain delinquency data for Government programs such as FHA and VA, but no such information is provided by the GSE’s. However, late in the month data is provided for the reference loans in the Credit Risk Sharing (CRT) programs. However, data for the most recent month is only provided by the Freddie Mac Structured Agency Credit Risk (STACR) program as the comparable Fannie Mae data is released with a 1-month lag. The latest STACR data shows the 30day delinquency rate for Freddie CRT pools went up from 0.76% in April to 4.20% this month. The states with the highest delinquency rates are: 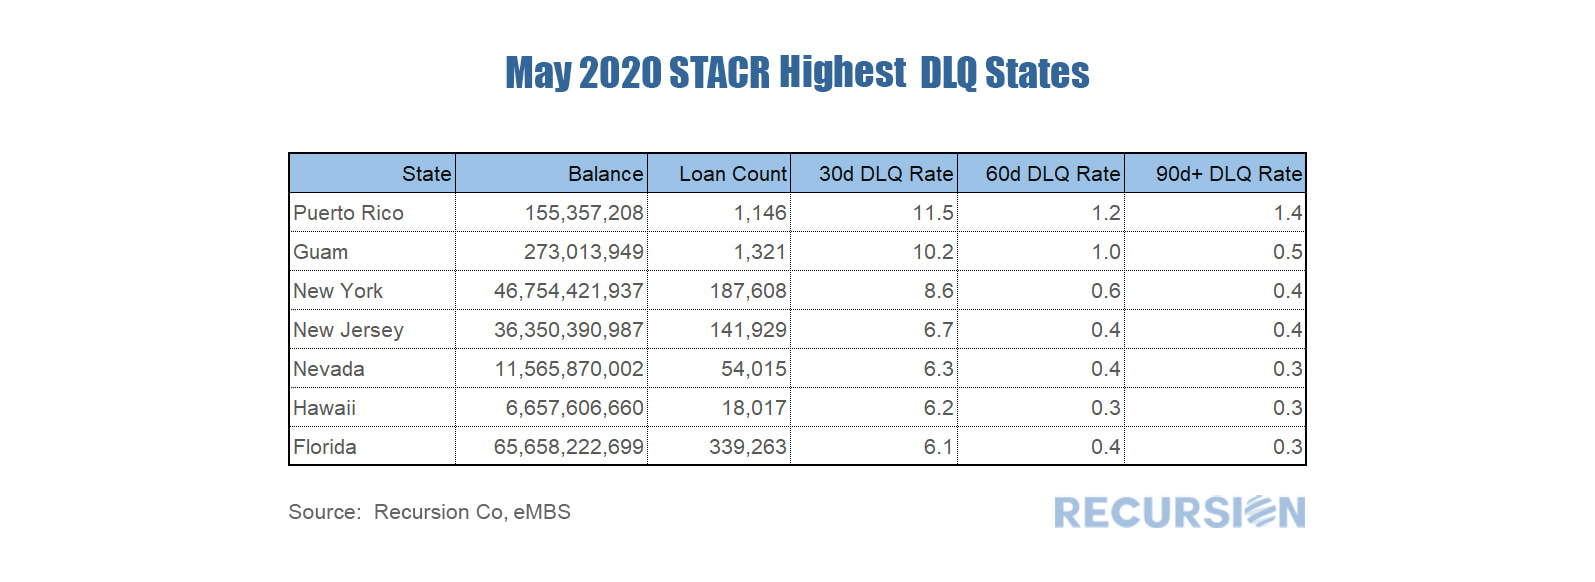 And the states with the lowest delinquency rates are: 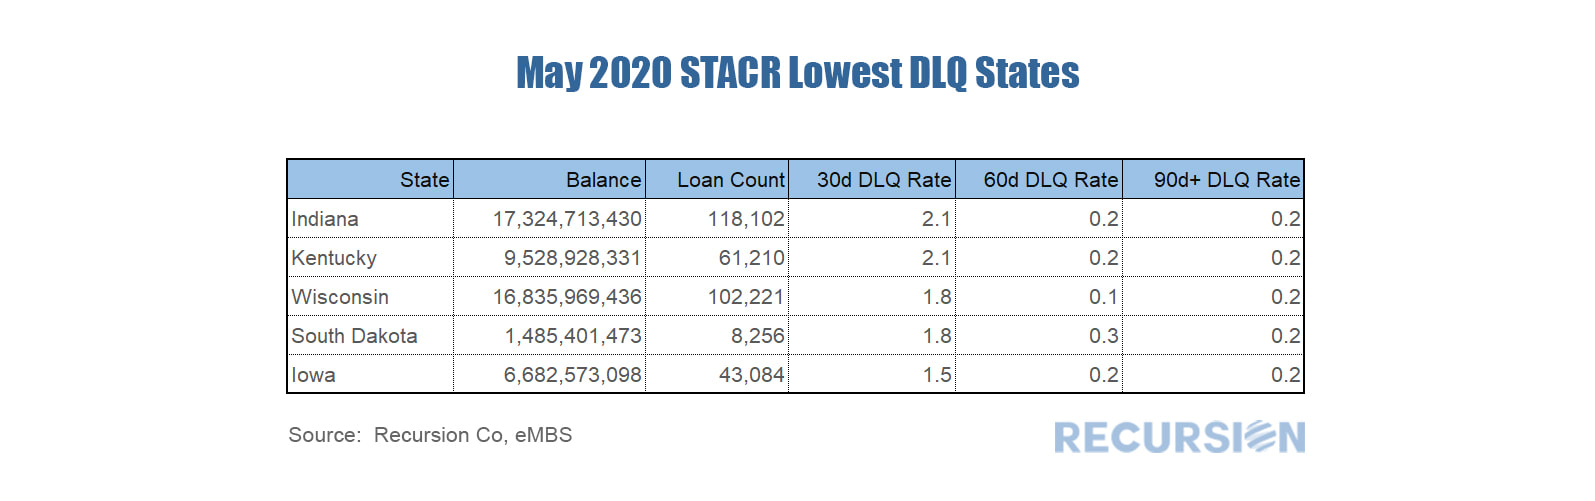 The state rankings are broadly in line with those observed in the Government data. For example, the top three states in terms of 30-day dq’s for the FHA program are New York (14.4%), NJ (13.9%) and Puerto Rico (13.2%). In general, DQ’s for FHA are higher than those for the GSE’s due to the broader credit criteria available in Government programs.
Delinquencies are important in the CRT program because they have the potential to turn into losses shared with private investors. The forbearance programs will delay but not completely prevent this transmission. The ultimate extent of investor losses depends on the duration of the Covid-19 crisis, and ensuing policy actions. As stay-at-home orders commenced in most of states during the Covid-19 pandemic, home sales have been heavily impacted. A good timely indicator of home sales is Redfin pending sales. Monthly average seven-days total pending sales, which measure the number of total homes that went under contract in the prior seven days[1], show normal home sales seasonal patterns from Jan 2019 to Feb 2020. However, the number suddenly declined about 14% from 42,978 in Mar 2020 to 36,794 in Apr 2020[2], reflecting the big hit caused by the pandemic. What will MBS issuance look like in the near future? Using our powerful data analytics tool Cohort Analyzer, we easily summarized the Agency (GNM, FNM, FHL) MBS Issuance for home purchases from Jan. 2019 to May 2020(month to date as of the 15th business day of the month). The chart below shows the clear leading relationship between pending sales and over MBS purchase issurance. Thus, we can expect that the decline we observed in pending sales in April is likely to show somewhat softer MBS purchase issurance in the early summer. Continued record-low interest rates, perhaps combined with gradual reopening in some states, should we help to support purchase issuance as the summer progresses. However, given the uncertainty surrounding the reopening process, it is still to early to be confident that the impact of the Covid-19 virus on the housing market and purchase mortgage production has formed a bottom. 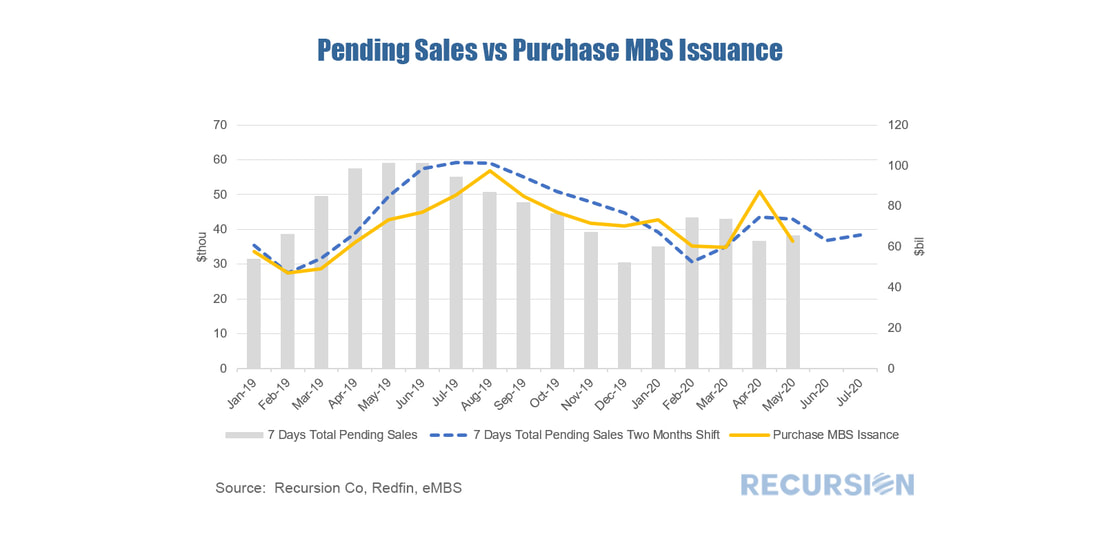 [1] The number excludes homes that were on the market longer than 90 days.
[2] Data provided by Redfin, a national real estate brokerage. Previously we have noted the connection between aggregate unemployment and delinquencies in the mortgage market[1]. With the release of state-wide delinquencies for FHA loans earlier this month, we can dig deeper into the connection between mortgage distress and the Covid-19 crisis. Based on data released by the Covid Tracking Project[2], and the Census Bureau on population, we can correlate infection rates with mortgage delinquency rates. 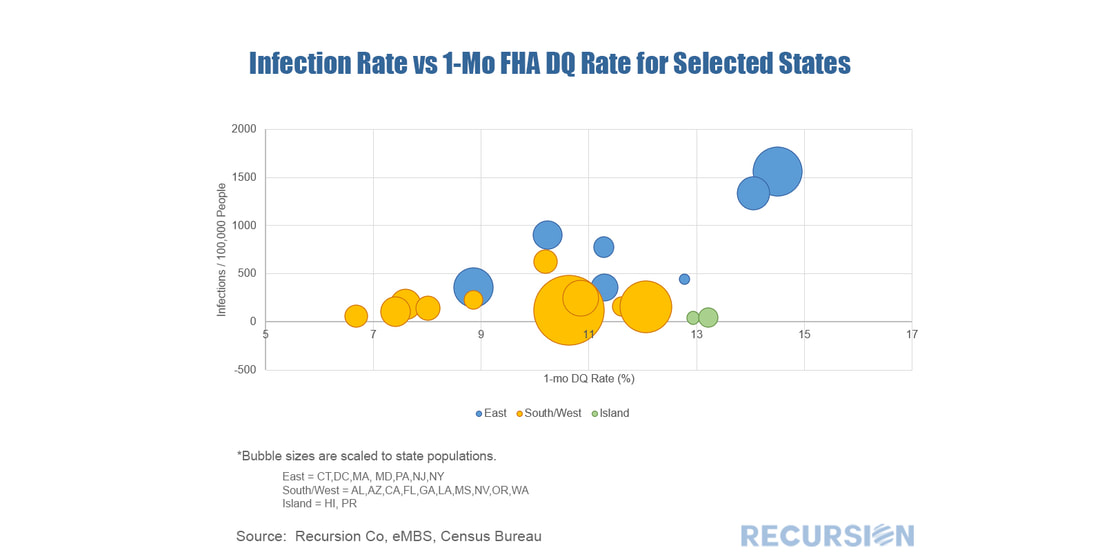 There is a lot of confusion in the market regarding the interpretation of new data released by the two GSE’s, the delinquency distribution and forbearance distribution for some new pools. The data available so far are very limited, but we can draw some tentative conclusions from what we have. As of this morning we found 11 pools with both a delinquency distribution and a forbearance distribution from the eMBS data feed. For 6 of them, forbearance numbers are the same as 30d delinquency numbers. For 5 of them, forbearance numbers are bigger than the delinquency numbers, and often by a significant margin. 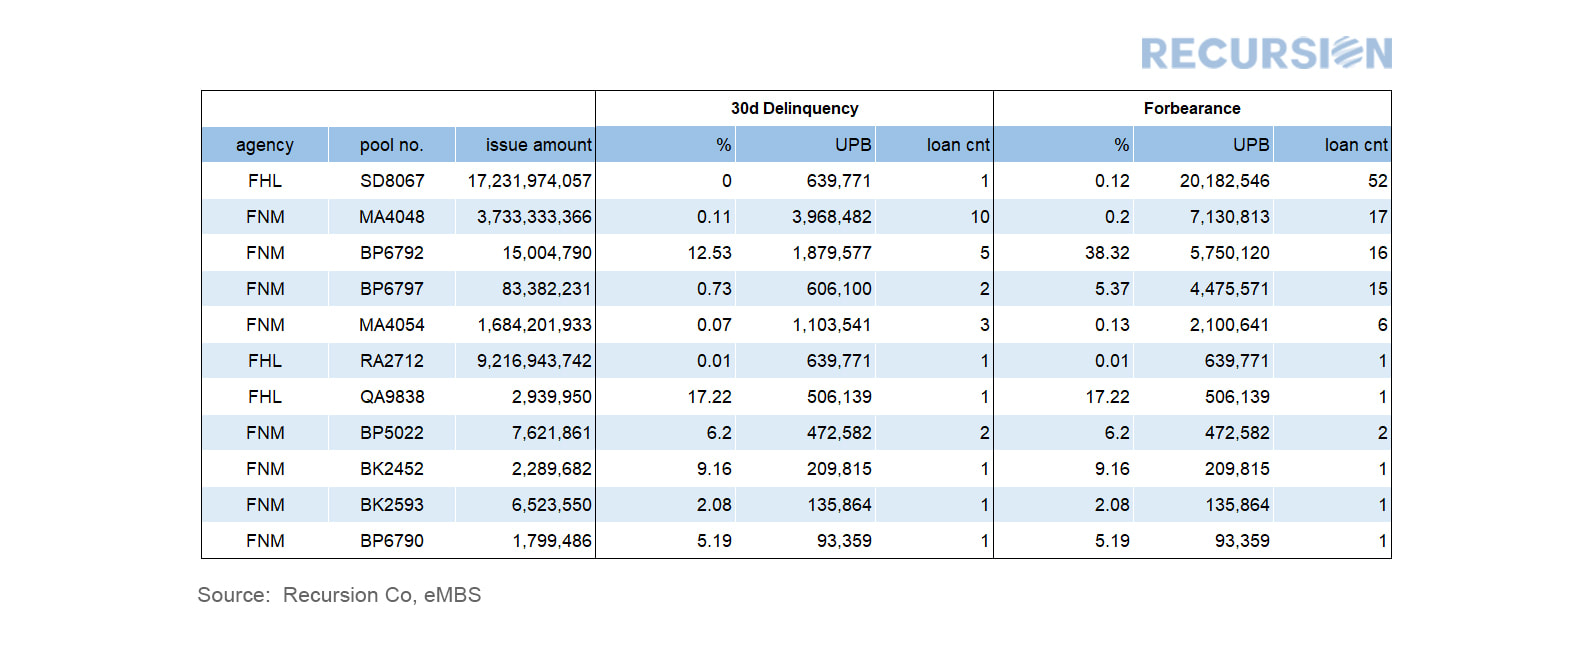 We previously noted that the recent surge in bank deposits, that is related to rising risk aversion associated with the onset of the Covid-19 crisis, serves to support bank investment in agency Mortgage Backed Securities (MBS)[1]. A look at recent Federal Reserve Board data reveals that growing MBS demand is not just the result of greater deposits, but also is due to a desire on the part of depository institutions to reduce risk in the mortgage space. 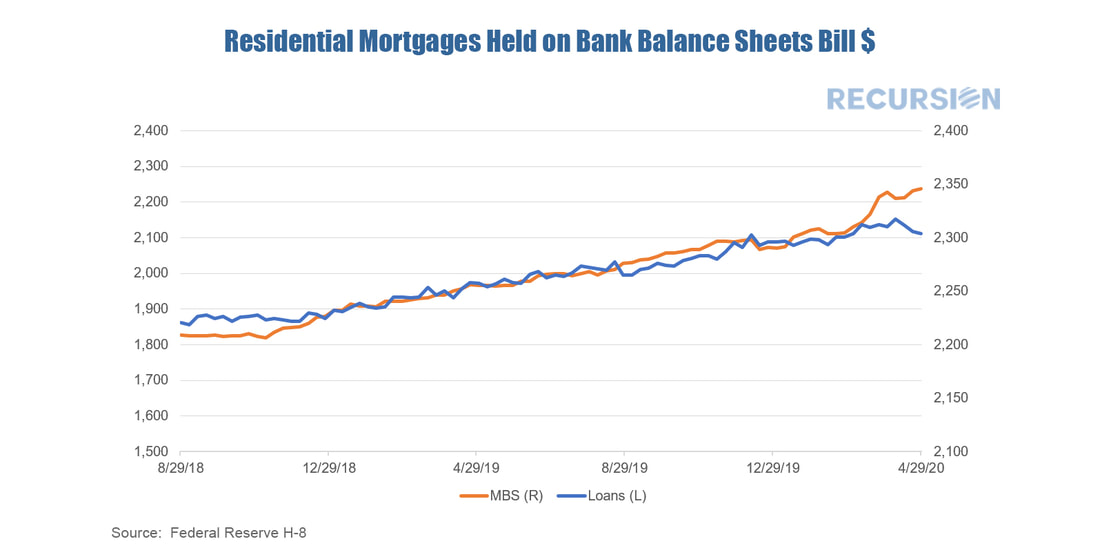 April mortgage deliveries by the agencies Fannie Mae, Freddie Mac and Ginnie Mae showed a rise in deliveries of mortgages to the two agencies for both home purchases and refinances. Purchase mortgage volumes reflect a normal seasonal pattern, while refinances experienced a sharp spike upwards in response to low levels of interest rates. Given normal (and possibly growing) lags related to closing times, many of these contracts were signed in March when rates had already dropped sharply but the full impact of the Covid-19 virus on stay-at-home policies was not yet fully felt. 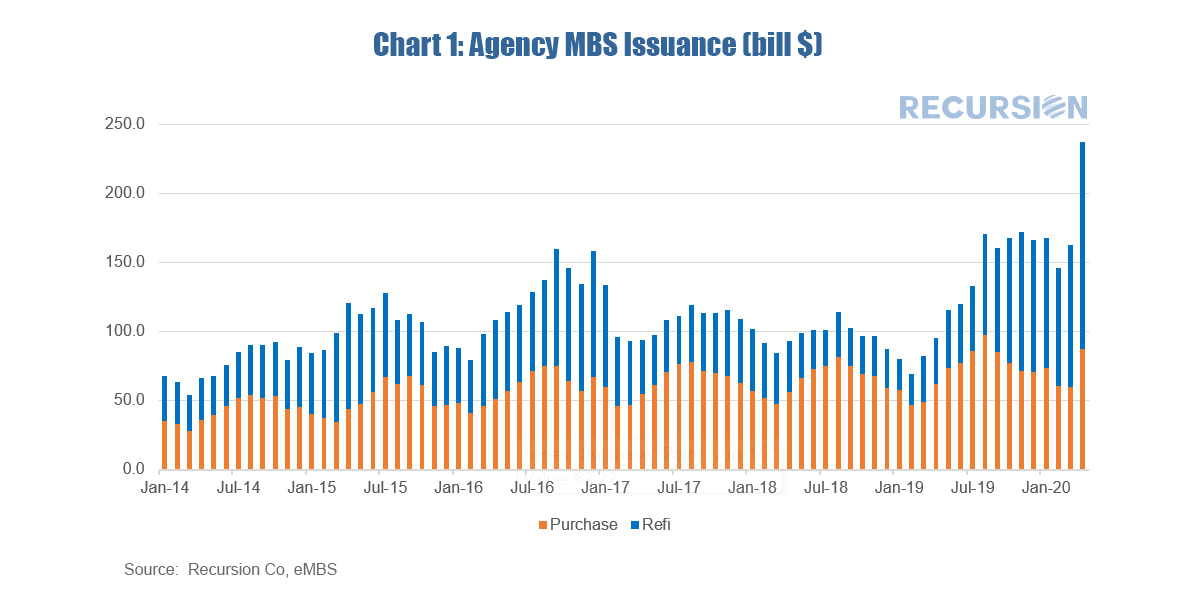 Fannie Mae and Freddie Mac each announced their plans for disclosing forbearance data at the pool level last week. Although it is a little disappointing that the disclosure is on the pool level, the speed of action is still much appreciated. 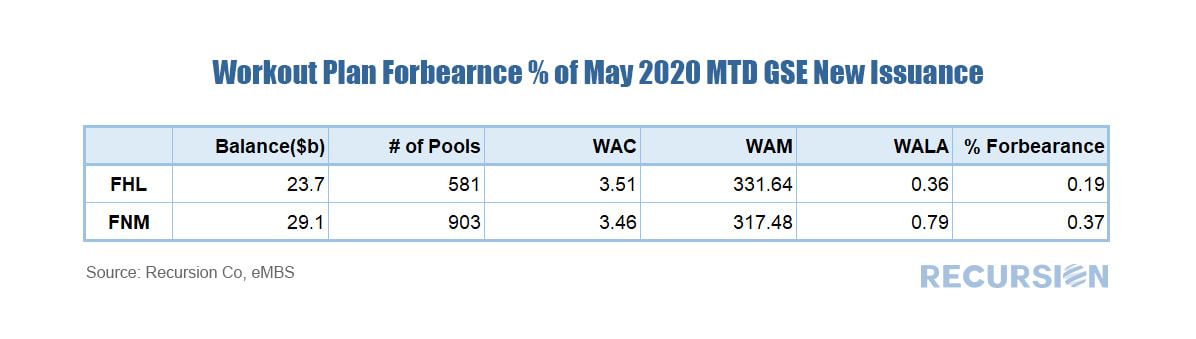 Just-released data from Freddie Mac is the first clear signal of distress in the conforming mortgage market. Data at the pool level for April 2020 showed a record high share of 30-day delinquencies (dq’s) of 3.735% for pools backed by 30 year mortgages. This data set goes back only to January 2011, so to get a reference to the Global Financial Crisis (GFC) we calculated the 1-month dq for 30 year mortgages from the Freddie Mac Loan Performance data set which goes back to 1999, although the most recent observation is June 2019. This dataset consists of a large sample of Freddie Mac loans but is not the whole universe. During the period of overlap there is a clear correlation between the two series. Finally, we overlay the insured unemployment rate to obtain a clear connection between the shock to the labor market from the Covid-19 virus and borrowers who have missed their mortgage payment. 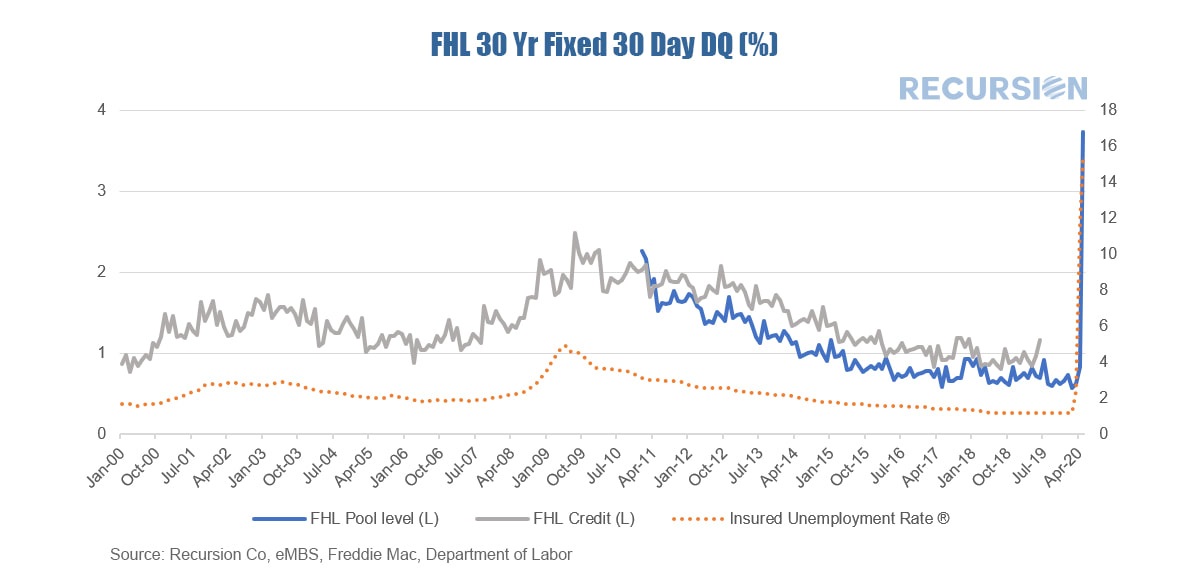 |
Archives
July 2024
Tags
All
|
 RSS Feed
RECURSION |
|

Copyright © 2022 Recursion, Co. All rights reserved.