|
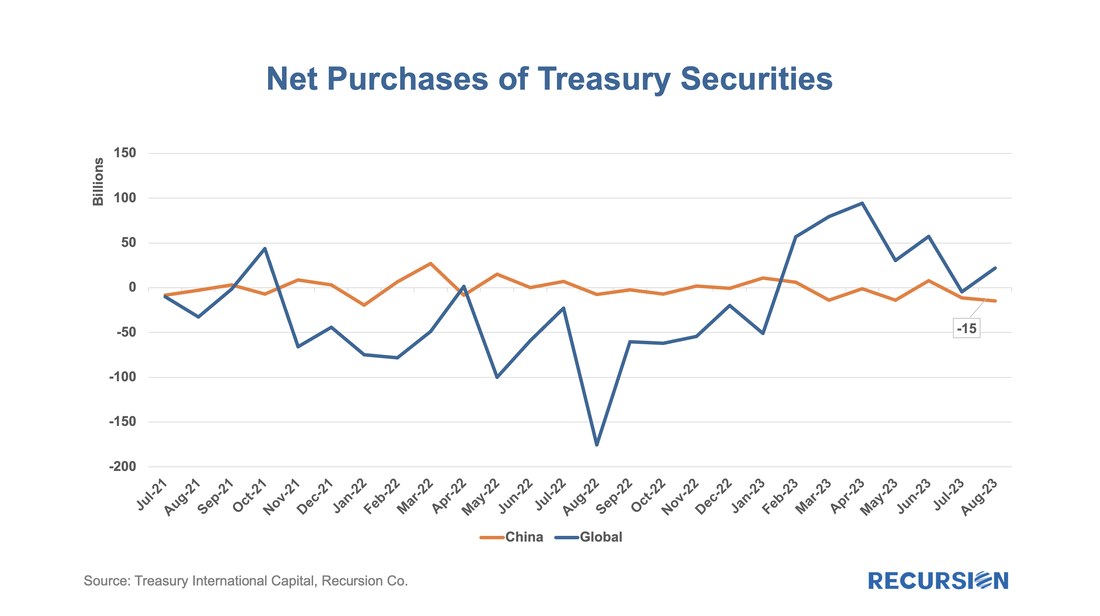
One of the key changes that has been underway in the policy environment over the last decade or so is the linking of economic and foreign policies. Trade policies in the form of tariffs or product bans have increasingly become part of the foreign policy toolkit. The most extreme case, of course, is the sanctions placed on Russia’s dollar assets by the US government following the invasion of Ukraine[1]. It’s natural to wonder if these developments could lead to changes in the foreign appetite for US financial assets. Recently, these concerns rose following reports of three consecutive months of declines in US Treasuries[2].
These are complex issues that matter to investors in US assets, so it’s worth looking into. Our Macro Analyzer provides a view into the main source of international financial flows, the Treasury International Capital (TIC) System[3]. Indeed, the data show sales of Treasury securities of almost $15 billion out of China in August, the biggest such figure since January 2022: Recently we commented on the potential for various investor market segments to increase their holdings of MBS as the Federal Reserve winds down its portfolio[1]. An interesting category is foreign investors. At the end of 2018, when the Fed initiated its QE program, foreign investors held about 17% of outstanding MBS, and this has fallen to a little less than 12% at present. Most of the decline occurred in the wake of the global financial crisis when mortgage-related securities were revealed to be riskier than generally believed.
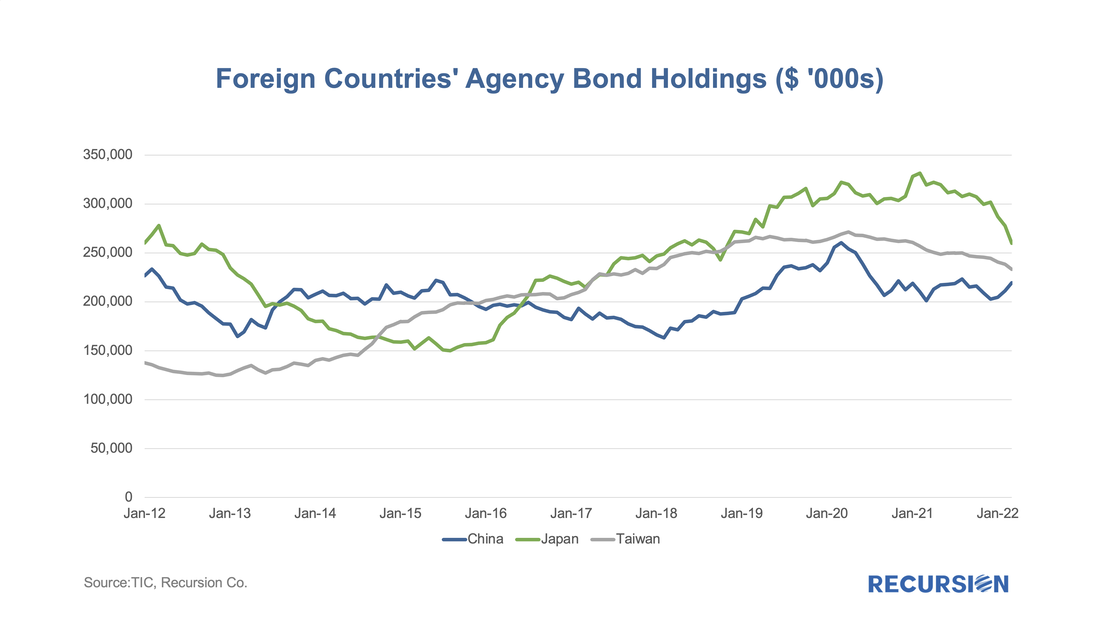
As noted in that post, there are many considerations facing foreign investors in US securities that do not weigh as heavily on domestic money managers. These include foreign exchange risk, local market conditions, and geopolitical risk. To gain a better understanding of the underlying behavior behind the trends in overseas asset holdings, we turn to another data set, the Treasury International Capital (TIC) data. This data provides balances and transactions of overseas holdings and transactions by country and asset class, including MBS[2]. This note looks at recent developments in this regard for three key Asian economies: China, Japan and Taiwan. The following chart provides a picture of the value of MBS holdings for each of these three countries back to 2012: Recursion and New View Advisors February 2021 expanded HECM reverse mortgage prepayment indices can be found here: New View Advisors Recursion Cohort Speeds 02_2021. The indices are derived from underlying HECM data in HMBS made public by Ginnie Mae, as well as private sources. This new expanded set of prepayment data is calculated using dollar principal balance, not unit count.
The enhanced data set shows current trends in prepayment activity by product type and Principal Limit Factors (PLFs), and for current 12-month LIBOR PLFs by Expected Rate. HECM loans with higher Expected Rates originated in the year or so prior to the precipitous fall in interest rates brought on by the pandemic are experiencing higher prepayment rates. Therefore, we segregate indices for recent production 12-month LIBOR PLFs into Expected Rates greater than 4% and Expected Rates less than or equal to 4%. Prepayment speeds are expressed as annualized percentages in three categories: Total Payoffs, Payoffs Other Than Assignments, and Payoffs from Assignment. For each category, we calculate the 1-month, 3-month, 6-month and 12-month CPR, or annual rate of prepayment. For HMBS pools backed by adjustable rate HECMs using the Constant Maturity Treasury (CMT) index, prepayment speeds will begin to populate as more of these HMBS are issued. Just under $300 million of CMT HMBS are currently outstanding: other than some highly seasoned tail pools, none have been outstanding more than one month. Please contact us if you’re interested in customized stratification of HECM prepayment speeds by vintage, Expected Rate, Weighted Average Loan Age, or other tailored output. New research by Yihai Yu at MSCI shows that historically high mortgage paydowns and price premia related to the Covid-19 crisis creates a situation where MBS securities could exhibit negative durations.
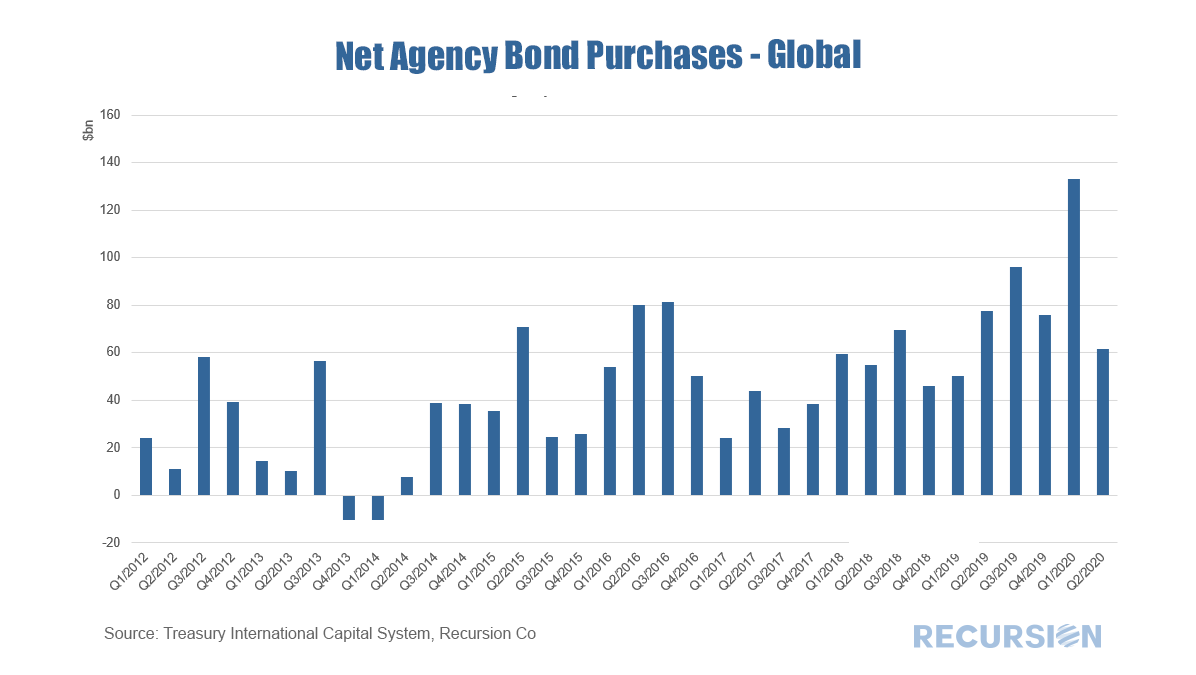
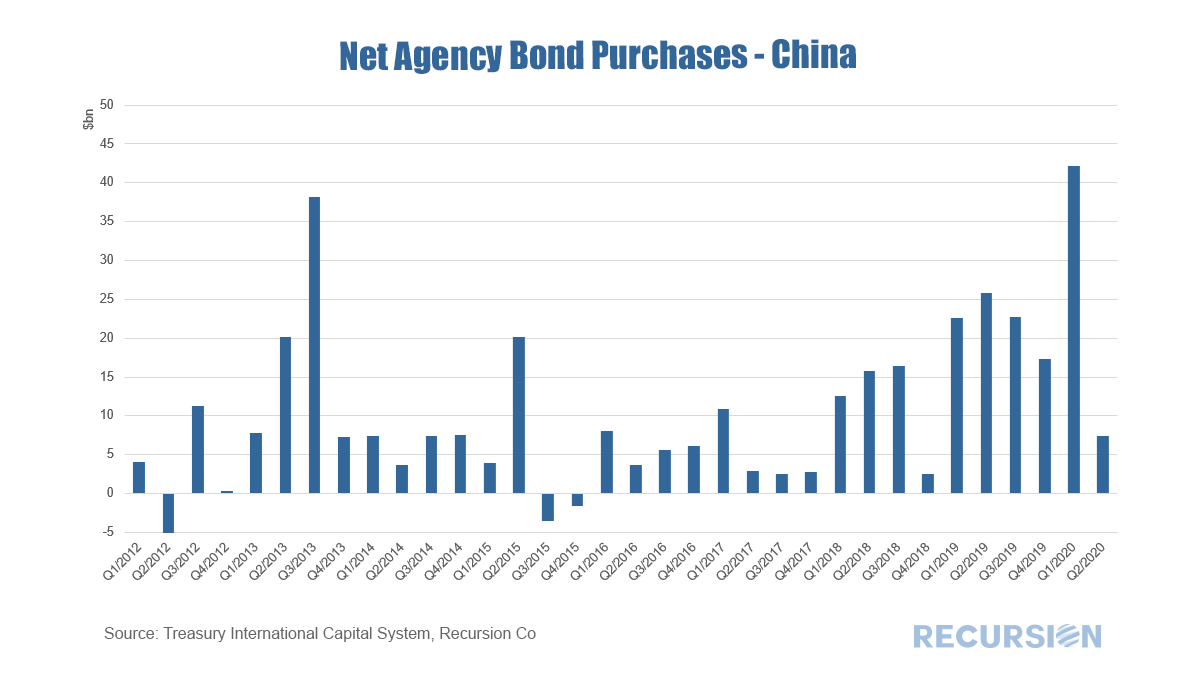
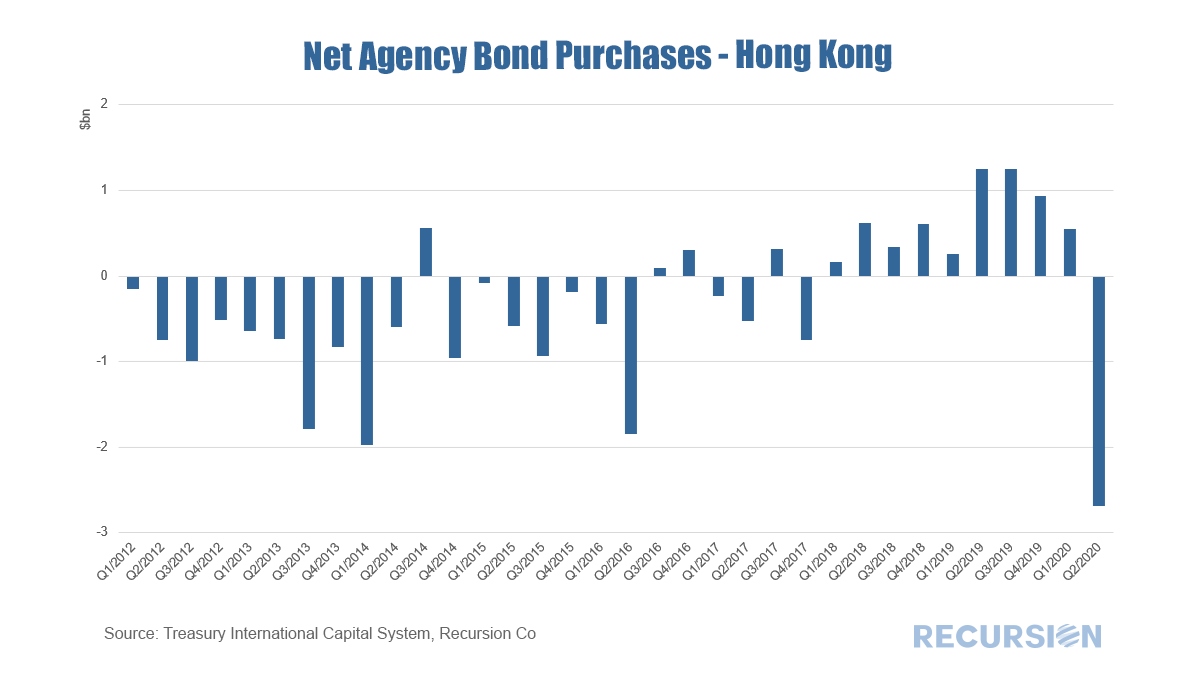
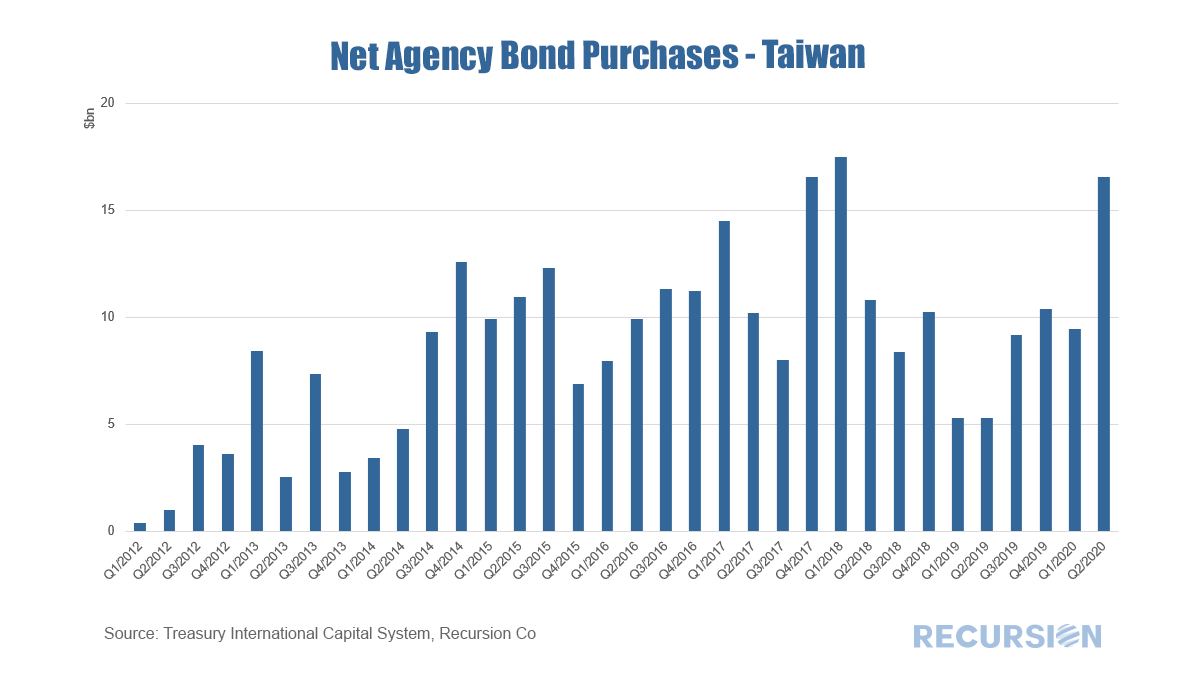
https://www.msci.com/www/blog-posts/can-mbs-duration-turn-negative/02108224451 This unusual situation arises because the extremely fast prepayment speeds can exceed the price impact of lower yields. This nuanced observation relies on careful calculations of the dollar amount of paydowns derived from Recursion data. In a previous blog, we pointed out the importance of overseas investors to the mortgage market.[1] We looked at the share of holdings from this sector, as well as on the country breakdown within the sector. These shares tend to move somewhat smoothly over time as they represent very large portfolios of assets. There is, however, a second data set released in the TIC system every month, namely net capital flows. These data are purchases (or sales) and can be quite volatile in the short term. But they may provide a picture of emerging trends that will not show up in the holdings data for some time. The same important caveat that applies to the holdings data applies as well to the flow data: the data on purchases and sales of assets reported for a country may be on behalf of agents domiciled in a different location, even the US. We also noted in that post the many motivations behind foreign holdings of stocks of long-term agency assets and these apply to the flow data as well. There is another caveat for the flow data, however. A key characteristic of MBS is prepayment. That is, homeowners have the right at any time to prepay their mortgage if rates fall. Also, if a homeowner sells the home the mortgage is typically prepaid and a new mortgage obtained if a new home is purchased. So if an investor faces prepayments, but wants to hold their stock of MBS steady, they may purchase new securities. Such purchases are not based on any assessment of near-term returns in various asset classes, but is rather an automatic flow based on longer-term considerations. This phenomenon is particularly notable in an environment of falling interest rates, as prepayments would be expected to rise. An interesting group of countries to look at in this regard is Asia ex-Japan. The bulk of these holdings are maintained by official entities looking to maintain portfolio liquidity and generate favorable long-term returns. The issue of country of the beneficial owner is less important here. Yet, they are not immune to conditions in the current investment environment. The charts below show net purchases in total and for three Asian entities: China, Hong Kong and Taiwan. As we have been in a declining rate environment since the start of 2019, it is not surprising that purchases of long-term agency securities have been generally strong from the point of view of asset replacement over that time. But Q2 2020 marked a break in the pattern with the onset of the Covid-19 crisis. Flows were smaller than in Q1, notably so for China, but markedly so for Hong Kong which engaged in outright sales of assets. Interestingly, Taiwan bucked the trend and added substantially to its holdings in Q2 compared to the prior quarter. In the background, the economic and financial environment remains highly uncertain. Added to that is the increasing factor of rising geopolitical uncertainty as we head into the US election. Following these flows may provide useful insights into how different agents assess these considerations. The MBS market is the second-most liquid market in the US after the Treasury market. The collateral for these securities is completely domestic but a significant share of the ownership is held by offshore entities. As such, investors need to be cognizant of the attitudes of overseas investors towards this market, particularly in the current highly charged geopolitical climate.
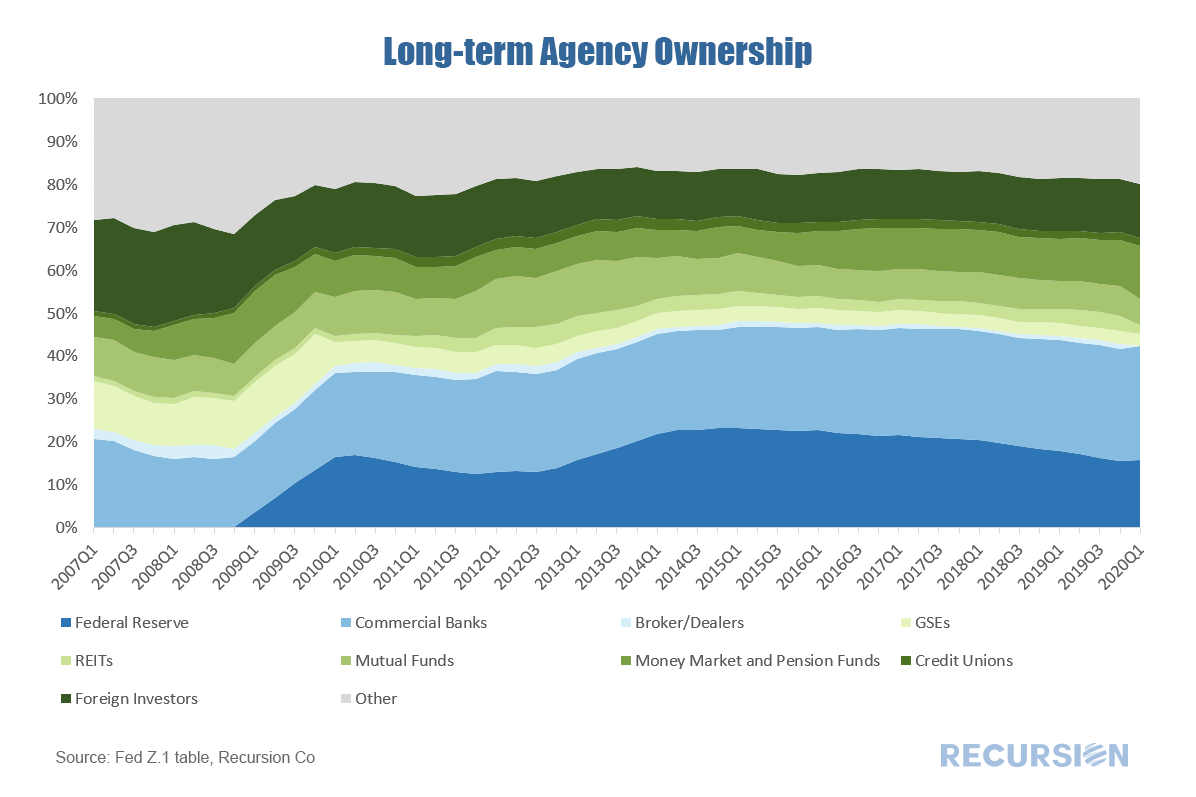
The following chart shows total holdings of Agency and GSE-backed securities over time broken down by a broad category of investors. The most recent figure is as of Q1 2020; Q2 data will be released later in September. |
Archives
July 2024
Tags
All
|
RECURSION |
|
Copyright © 2022 Recursion, Co. All rights reserved.


 RSS Feed
