|
The fourth quarter of 2021 marked the 13th anniversary of the introduction of the Federal Reserve’s Quantitative Easing (QE) policy, whereby the central bank worked to push longer-term rates lower once short-term rates hit the zero lower bound. This activity largely took place via purchases of longer-dated Treasury securities and mortgage-backed securities. There were many nuances as the central bank bought securities in different proportions over time and occasionally let their balance sheet shrink as the securities they held paid off or matured.
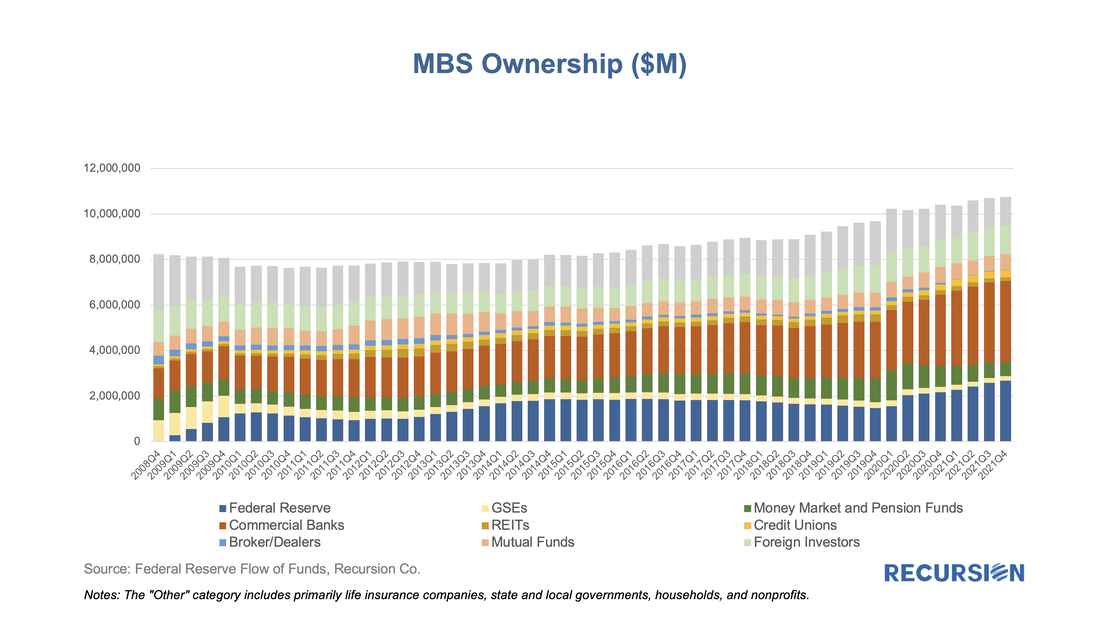
The purpose of this note is to take a big-picture view of the MBS market impact of a likely decline in Federal Reserve holdings in the Agency space as the central bank has recently indicated its intention to begin letting these securities run off its balance sheet. In particular, the FOMC statement of March 16 stated, “In addition, the Committee expects to begin reducing its holdings of Treasury securities and agency debt and agency mortgage-backed securities at a coming meeting.[1]” Which we guess will be in May. What does this mean to valuations in the MBS market? Our analysis is based on the data collected on Agency MBS ownership broken down by major investor class by the Federal Reserve in the Financial Accounts of the United States[2]. This data is produced quarterly and is a broad measure of Agency securities, including not just single family Agency MBS but also Multifamily MBS and Agency Debt. Below find a chart of the progress of the Agency MBS market from Q4:2008, when the Fed launched QE, through Q4:2021. The chart nicely shows the ebb and flow of activity in this market on the part of the major players. The holdings controlled by the central bank is one example, starting at near-zero in Q4:2008 and cycling up and down, reaching a record high of almost 25% at the end of 2021. The role of the Federal Reserve in the mortgage market is an ongoing theme in this blog, dating back to the early days of the Covid-19 crisis[1]. Besides the level of short-term rates, when we think about the Fed, we consider its direct intervention through the outright purchases of MBS. A common view of this “QE” policy can be seen in charts such as:
New research by Yihai Yu at MSCI shows that historically high mortgage paydowns and price premia related to the Covid-19 crisis creates a situation where MBS securities could exhibit negative durations.
https://www.msci.com/www/blog-posts/can-mbs-duration-turn-negative/02108224451 This unusual situation arises because the extremely fast prepayment speeds can exceed the price impact of lower yields. This nuanced observation relies on careful calculations of the dollar amount of paydowns derived from Recursion data. The MBS market is the second-most liquid market in the US after the Treasury market. The collateral for these securities is completely domestic but a significant share of the ownership is held by offshore entities. As such, investors need to be cognizant of the attitudes of overseas investors towards this market, particularly in the current highly charged geopolitical climate.
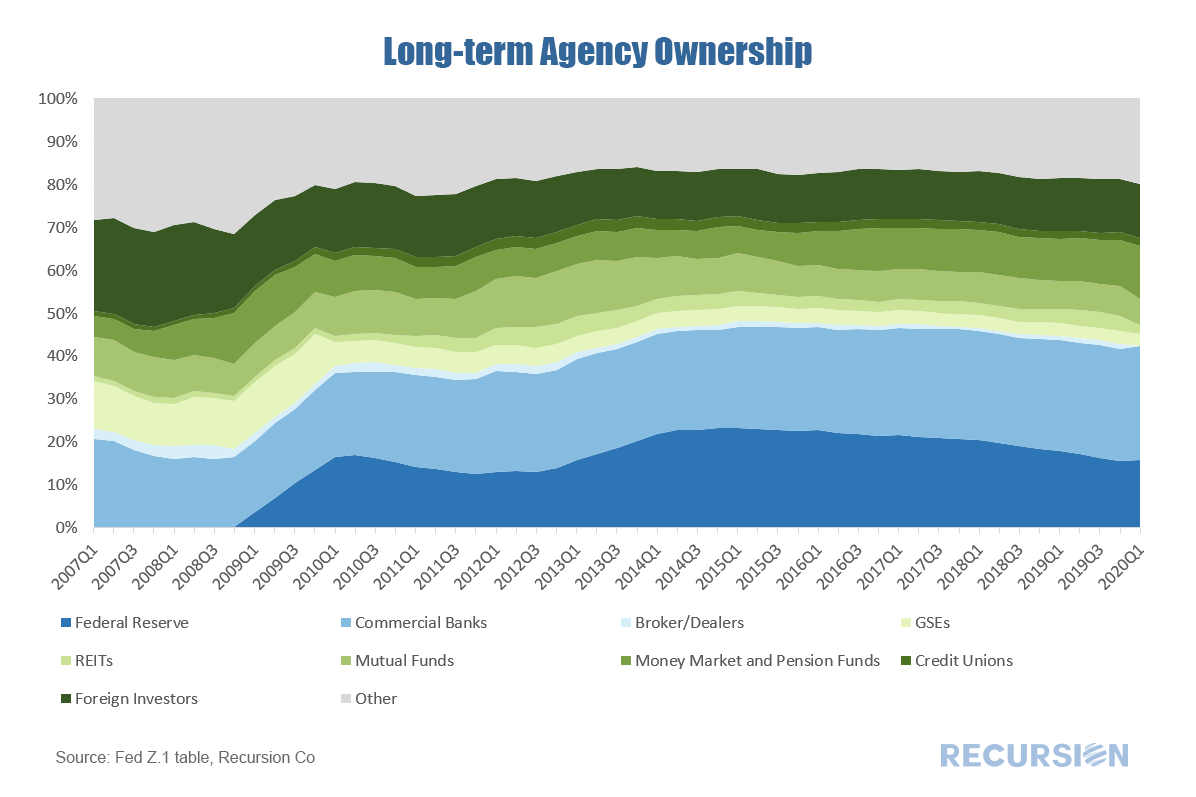
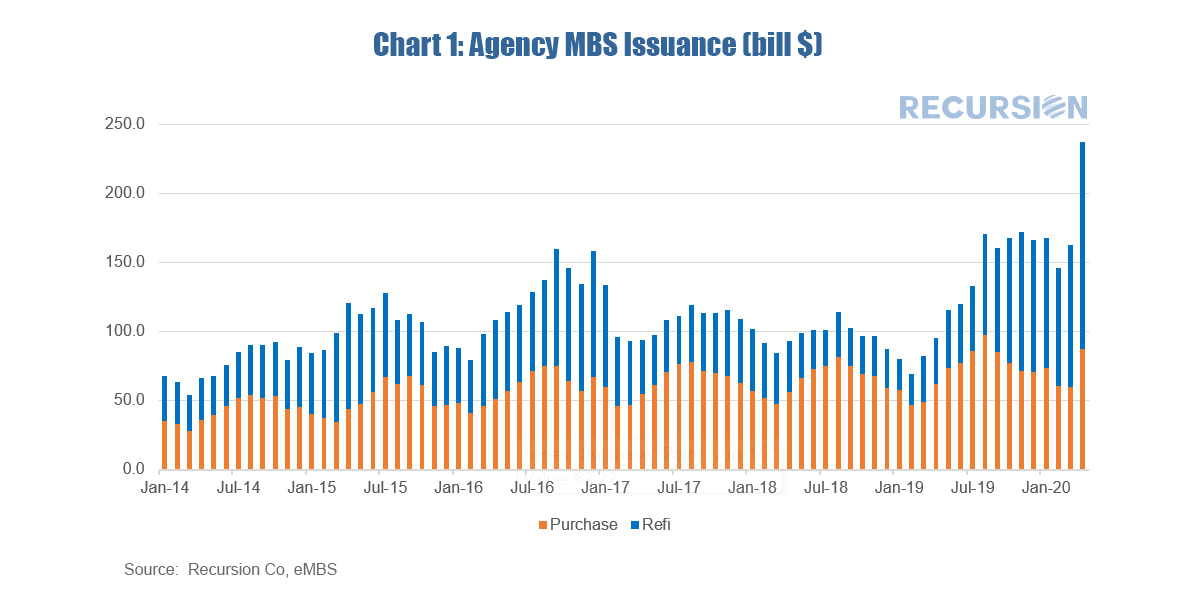
The following chart shows total holdings of Agency and GSE-backed securities over time broken down by a broad category of investors. The most recent figure is as of Q1 2020; Q2 data will be released later in September. April mortgage deliveries by the agencies Fannie Mae, Freddie Mac and Ginnie Mae showed a rise in deliveries of mortgages to the two agencies for both home purchases and refinances. Purchase mortgage volumes reflect a normal seasonal pattern, while refinances experienced a sharp spike upwards in response to low levels of interest rates. Given normal (and possibly growing) lags related to closing times, many of these contracts were signed in March when rates had already dropped sharply but the full impact of the Covid-19 virus on stay-at-home policies was not yet fully felt.
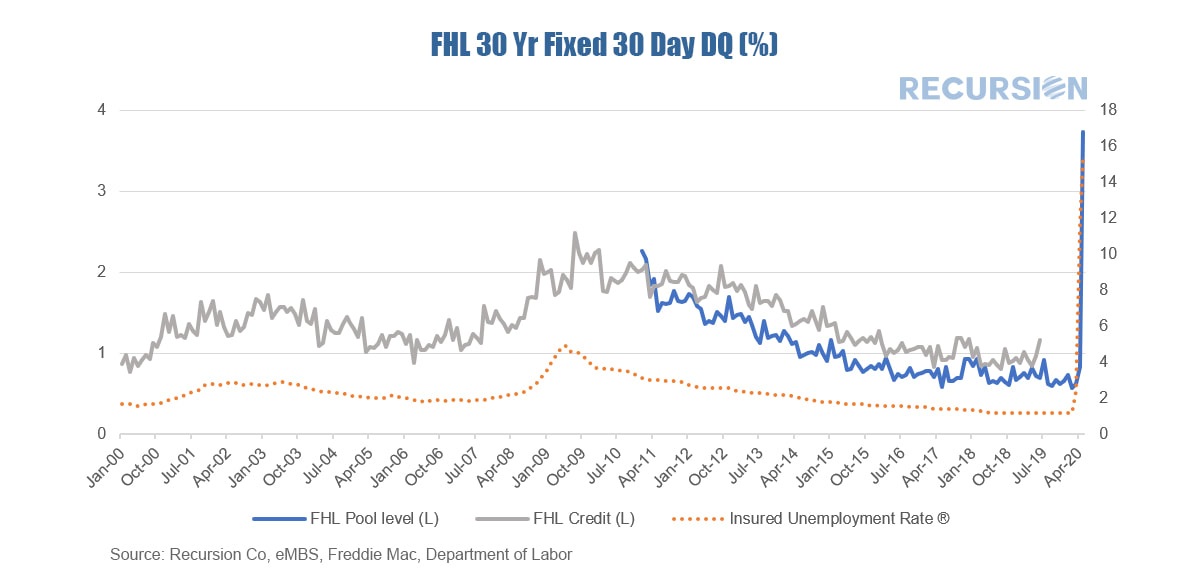
Just-released data from Freddie Mac is the first clear signal of distress in the conforming mortgage market. Data at the pool level for April 2020 showed a record high share of 30-day delinquencies (dq’s) of 3.735% for pools backed by 30 year mortgages. This data set goes back only to January 2011, so to get a reference to the Global Financial Crisis (GFC) we calculated the 1-month dq for 30 year mortgages from the Freddie Mac Loan Performance data set which goes back to 1999, although the most recent observation is June 2019. This dataset consists of a large sample of Freddie Mac loans but is not the whole universe. During the period of overlap there is a clear correlation between the two series. Finally, we overlay the insured unemployment rate to obtain a clear connection between the shock to the labor market from the Covid-19 virus and borrowers who have missed their mortgage payment.
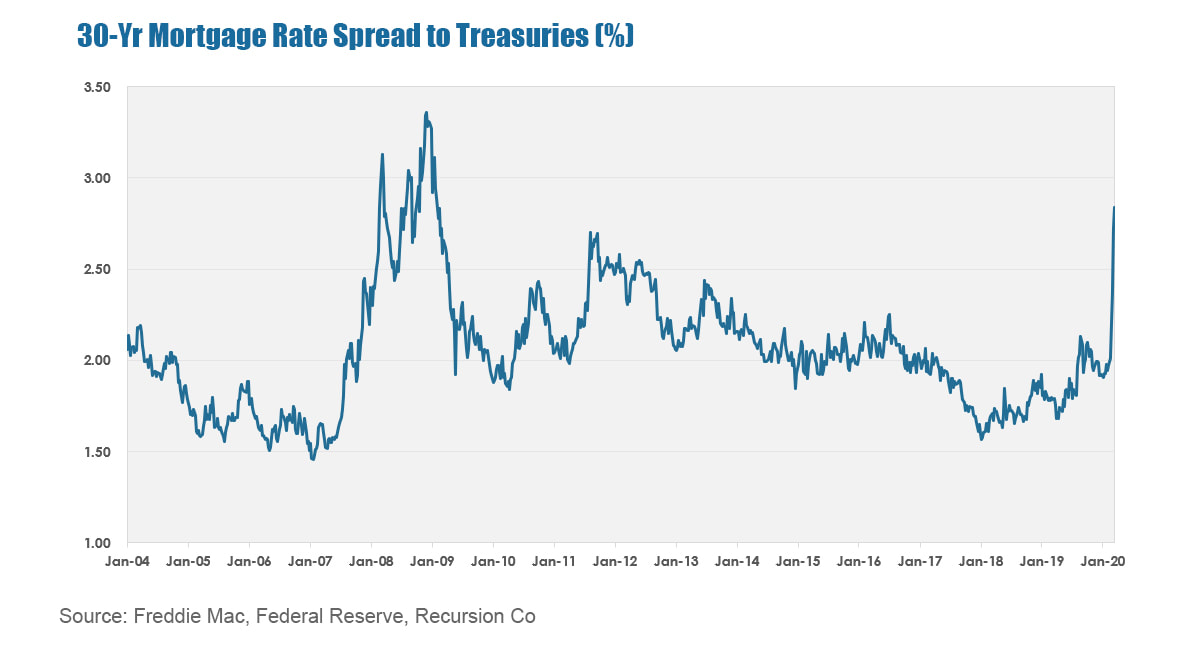
The onset of the COVID-19 virus has resulted in tremendous volatility in financial markets. The 10-year Treasury yield plunged from 1.9% at the beginning of 2020 to a record low near 0.5% in early March but has since rebounded to near 1.1% at present. The drop in Treasury yields has not been matched by a similar decline in mortgage rates. The 30-year fixed mortgage rate released by Freddie Mac on March 19 came in at 3.65%, just 0.07% below the level attained at the beginning of the year.
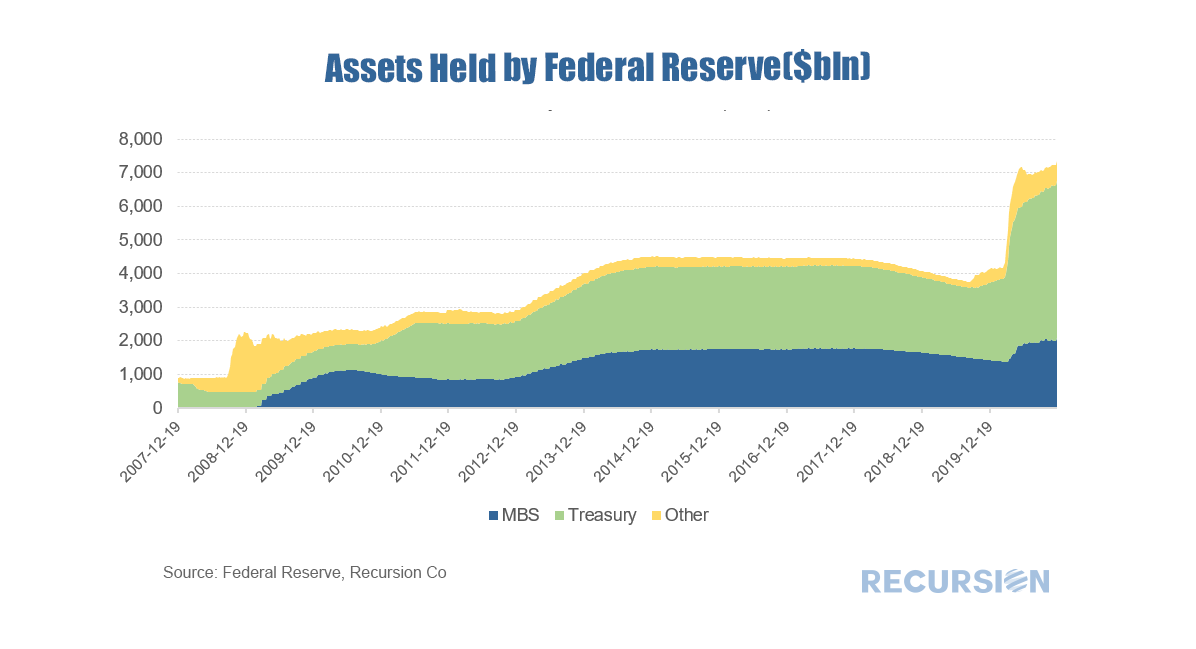
Chart 1* In the wake of the economic dislocation that occurred with the onset of the Global Financial Crisis, (GFC), central banks responded with a variety of policy innovations, including Large-Scale Asset Purchases (LSAP’s), also known as Quantitative Easing (QE). Different central banks have implemented these programs in distinct ways, but the Federal Reserve purchased massive amounts of Treasuries and mortgage-backed securities (MBS) to place downward pressure on long-term interest rates[1]. (Chart 1)
|
Archives
July 2024
Tags
All
|
RECURSION |
|
Copyright © 2022 Recursion, Co. All rights reserved.

 RSS Feed
