|
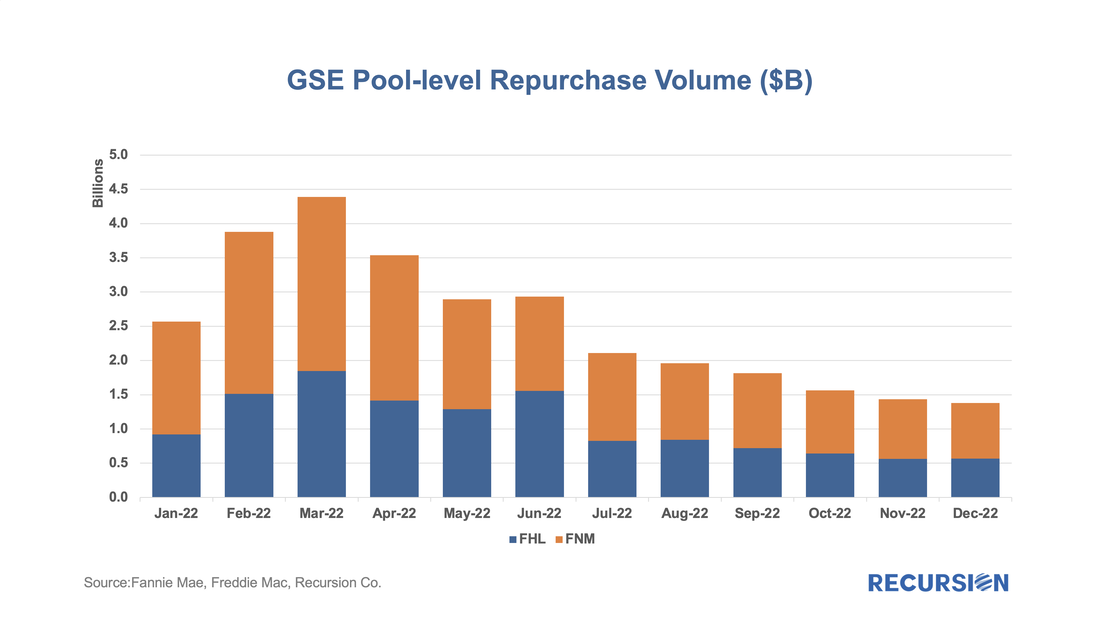
Growing concerns about a looming recession combined with increasing signs of distress in Government mortgage programs, particularly FHA, are leading many market participants to step up their focus on GSE buyouts. These found a recent peak last winter as forbearance programs unwound and have been in a generally declining trend since that time.
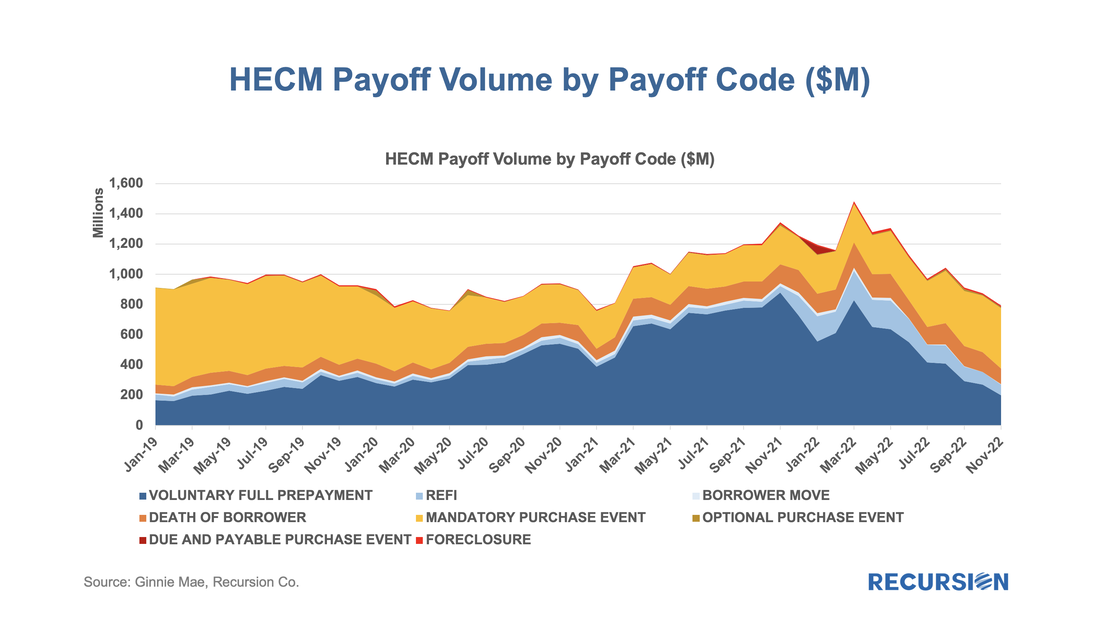
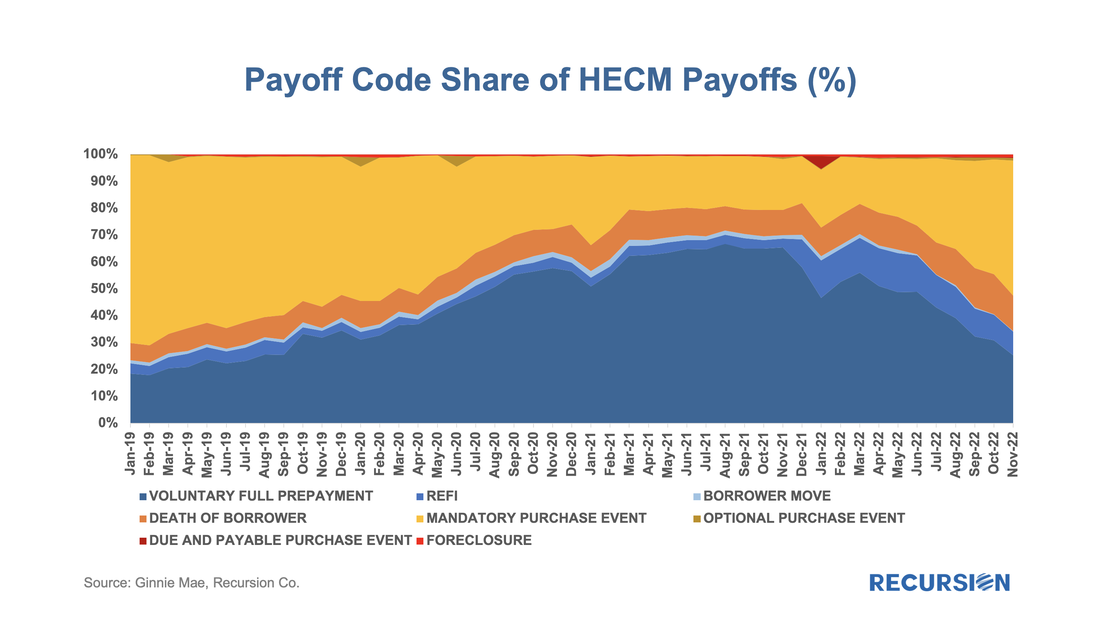
As the economy slows and the impact of inflation weighs on many households, we have noted signs of distress in mortgage performance in parts of the market despite the resilience observed in the labor market[1]. Another corner of the market that is drawing attention is reverse mortgages. The metric used to assess performance in this space is the number of mandatory purchase events. Unlike the situation in the forward mortgage market, these occur not when the borrower faces financial distress[2], but when the servicer is compelled to purchase a loan out of a pool once the balance reaches 98% of a pre-set amount -- the “Maximum Claim Amount (MCA)”[3]. This amount is capped so as to reduce the risk of the loan amount surpassing the valuation of the collateral. The fundamental factor driving this event is interest rates as HECMs are floating-rate loans, and a higher rate brings the loan balance up faster.
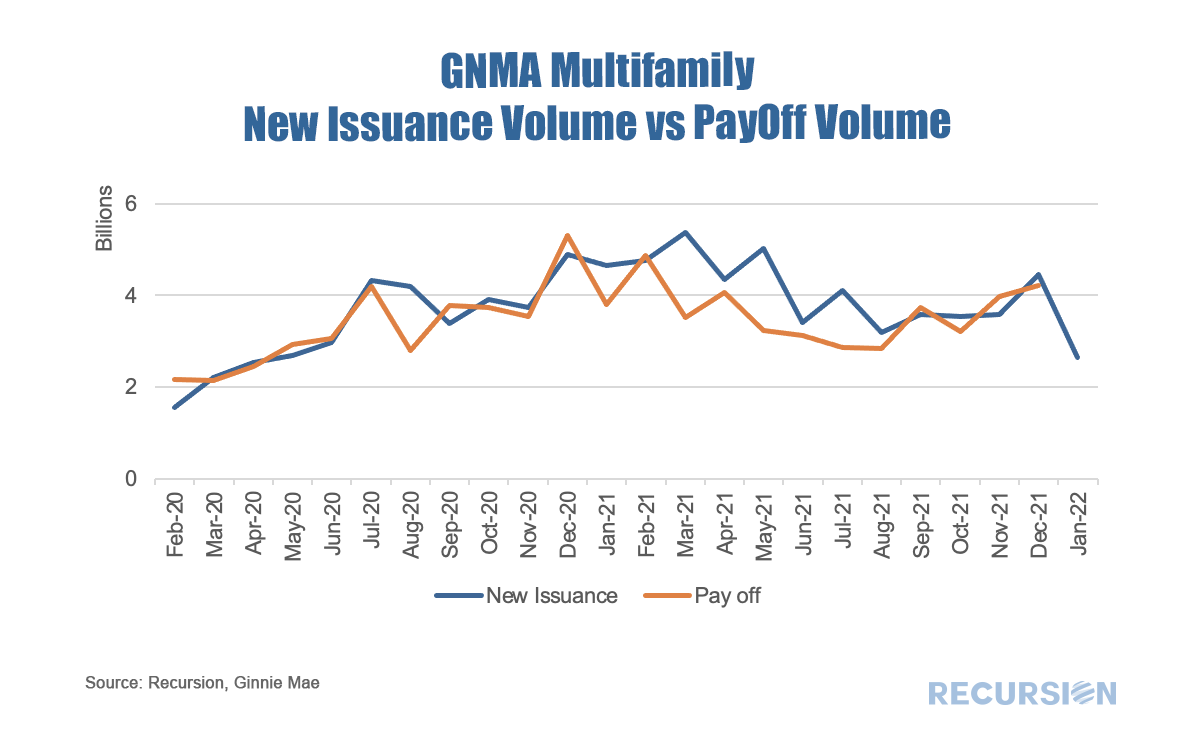
Recursion’s HECM Analyzer tool allows us to quantify the number of prepayments that are due to this factor, both in absolute dollar amount and as a share of total prepayments. With home prices and interest rates on the rise, policy focus becomes more clearly fixed on the subject of affordability. This is particularly true for renter households, which tend to have lower incomes than is the case for homeowning households. As a result, Recursion is in the process of upgrading its capabilities in this area, through its Multifamily Analyzer. A recent upgrade is the addition of payoff volumes for GNM multifamily programs, in addition to the new issuance volumes already in place. This provides a sense of how much of the total volume is due to expiring loans, and how much to new activity.
Recursion and New View Advisors February 2021 expanded HECM reverse mortgage prepayment indices can be found here: New View Advisors Recursion Cohort Speeds 02_2021. The indices are derived from underlying HECM data in HMBS made public by Ginnie Mae, as well as private sources. This new expanded set of prepayment data is calculated using dollar principal balance, not unit count.
The enhanced data set shows current trends in prepayment activity by product type and Principal Limit Factors (PLFs), and for current 12-month LIBOR PLFs by Expected Rate. HECM loans with higher Expected Rates originated in the year or so prior to the precipitous fall in interest rates brought on by the pandemic are experiencing higher prepayment rates. Therefore, we segregate indices for recent production 12-month LIBOR PLFs into Expected Rates greater than 4% and Expected Rates less than or equal to 4%. Prepayment speeds are expressed as annualized percentages in three categories: Total Payoffs, Payoffs Other Than Assignments, and Payoffs from Assignment. For each category, we calculate the 1-month, 3-month, 6-month and 12-month CPR, or annual rate of prepayment. For HMBS pools backed by adjustable rate HECMs using the Constant Maturity Treasury (CMT) index, prepayment speeds will begin to populate as more of these HMBS are issued. Just under $300 million of CMT HMBS are currently outstanding: other than some highly seasoned tail pools, none have been outstanding more than one month. Please contact us if you’re interested in customized stratification of HECM prepayment speeds by vintage, Expected Rate, Weighted Average Loan Age, or other tailored output. New View Advisors and Recursion are introducing a set of expanded HECM reverse mortgage prepayment indices, which can be found here: New View Advisors Recursion Cohort Speeds 01_2021. The indices are derived from underlying HECM data in HMBS made public by Ginnie Mae, as well as private sources. This new expanded set of prepayment data is calculated using dollar principal balance, not unit count. Data presented are for HECMs outstanding as of January 31, 2021, representing 311,364 loans totaling $56.5 billion. Future updates of the indices will be available after the 6th business day of each month.
We’ve written previously that the multifamily market will be of growing interest during the course of 2021[1]. During the Global Financial Crisis, the single-family market was ravaged by foreclosures resulting from the popping of the housing bubble. The large number of households losing their homes became renters to a large degree. This time is different. Renters are fleeing congested urban areas and are buying homes in areas with more space, serving to push up house prices while rents are under downward pressure. According to the Elliman Report, the rental vacancy rate for Manhattan in November 2020 was 6.1%, compared to 1.8% a year earlier.[2] This figure will of course vary considerably from place to place. The potential for more vacancies remains once the various Federal and Local Covid-19 bans on evictions are allowed to expire. According to Trepp, the national 30+ day delinquency rate for multifamily loans in December 2020 was 2.75%, up modestly from 2.00% a year earlier[3].
The role of the Agencies in the multifamily debt market is significant, but less than the overwhelming presence seen in the single-family market[4]. Data disclosed by the agencies provides a wealth of information about the rental market but did not receive widespread attention until recently. In this post, we discuss trends in multifamily loan maturity schedule and prepayment penalty schedule. This data is of interest because unlike the single-family market, there are fewer apartment loans, but they are generally quite large. Maturities can clump, leading to periods of time when capital demands can push borrowing costs higher. On the other hand, opportunities for lenders arise when loans mature or exit the prepayment penalty window. |
Archives
July 2024
Tags
All
|
RECURSION |
|
Copyright © 2022 Recursion, Co. All rights reserved.


 RSS Feed
