• HOME
  • solutions
    • RECURSION ANALYZERS
    • Mortgage Company Data
    • Recursion DataCloud
    • Customized Solutions
  • BLOG
  • CLIENT LOGIN
    • Recursion Analyzers
  • ABOUT US
    • OVERVIEW
    • OUR TEAM
    • News & Events >
      • Recursion In News
      • Recursion Data Citations
  • CONTACT
RECURSION CO
  • HOME
  • solutions
    • RECURSION ANALYZERS
    • Mortgage Company Data
    • Recursion DataCloud
    • Customized Solutions
  • BLOG
  • CLIENT LOGIN
    • Recursion Analyzers
  • ABOUT US
    • OVERVIEW
    • OUR TEAM
    • News & Events >
      • Recursion In News
      • Recursion Data Citations
  • CONTACT
BLOG

Digging into GSE Buyouts

1/24/2023

 
​Growing concerns about a looming recession combined with increasing signs of distress in Government mortgage programs, particularly FHA, are leading many market participants to step up their focus on GSE buyouts. These found a recent peak last winter as forbearance programs unwound and have been in a generally declining trend since that time.
Picture
run underlying query
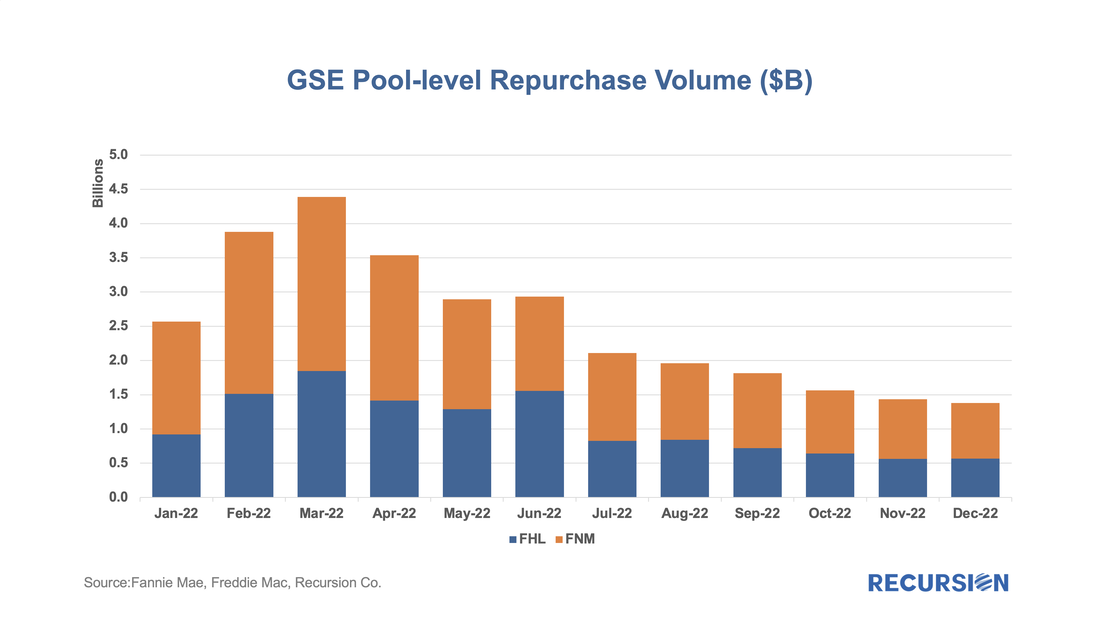
​To assess these trends, it would be advantageous to look into the makeup of the loans being purchased. To do so requires access to loan-level data. Within the loan-level data set, we can see which loans left the pool in a given month. However, loans leave pools for all kinds of reasons, and the question remains which of these are the result of the direction of Fannie Mae or Freddie Mac. While we don't see this directly, we can try to estimate this through a simple rule: we assume that any loan that disappears from a pool that is 60 days or more delinquent is an involuntary buyout. To test this rule, we computed this number and compared it to the pool-level metric. Here is the result for 2022:
Picture
run underlying query 1
run underlying query 2
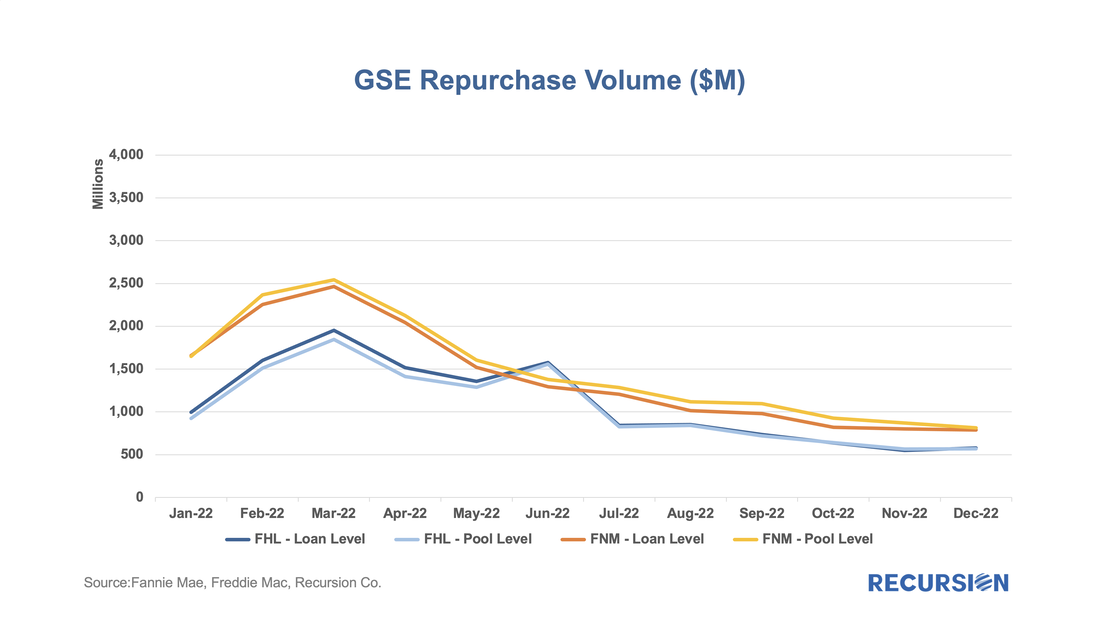
​We have confidence that looking at a breakdown of the loan-level data gives us a reasonable picture of the GSE buydown landscape. To start, let's look at banks vs. nonbanks:
Picture
run underlying query
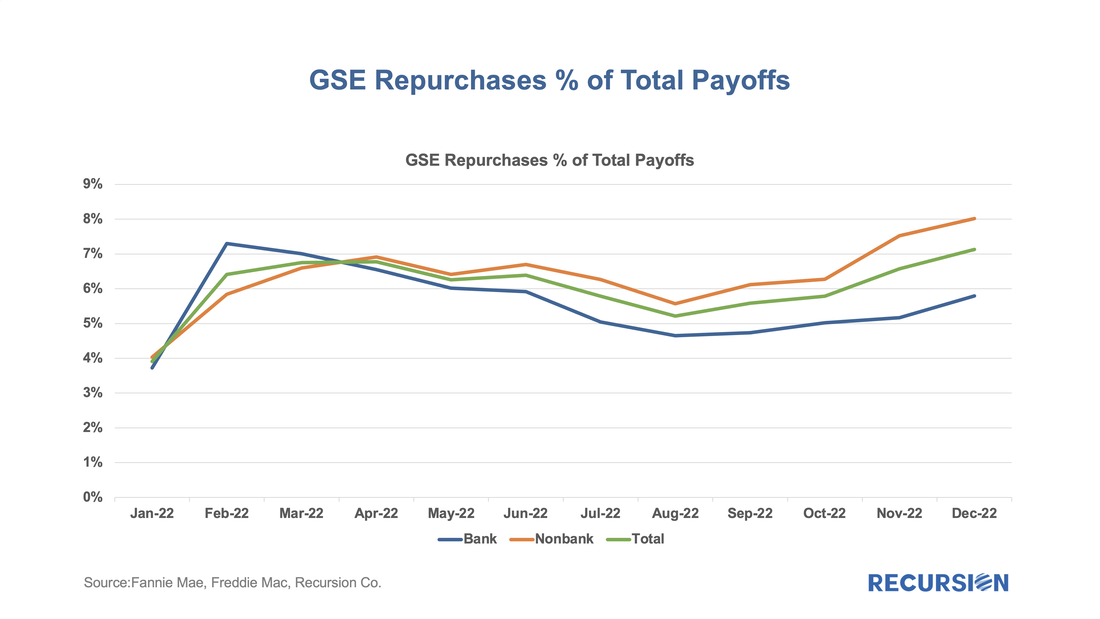
While repurchase volumes have fallen, as a share of all payoffs, they have been rising. Since August 2022, the total share has risen about 2%, with the bank share rising by about 1.2% and the nonbank share by about 2.5%.
​
It's then interesting to look at the dispersion among large lenders in each category. For banks:
Picture
run underlying query
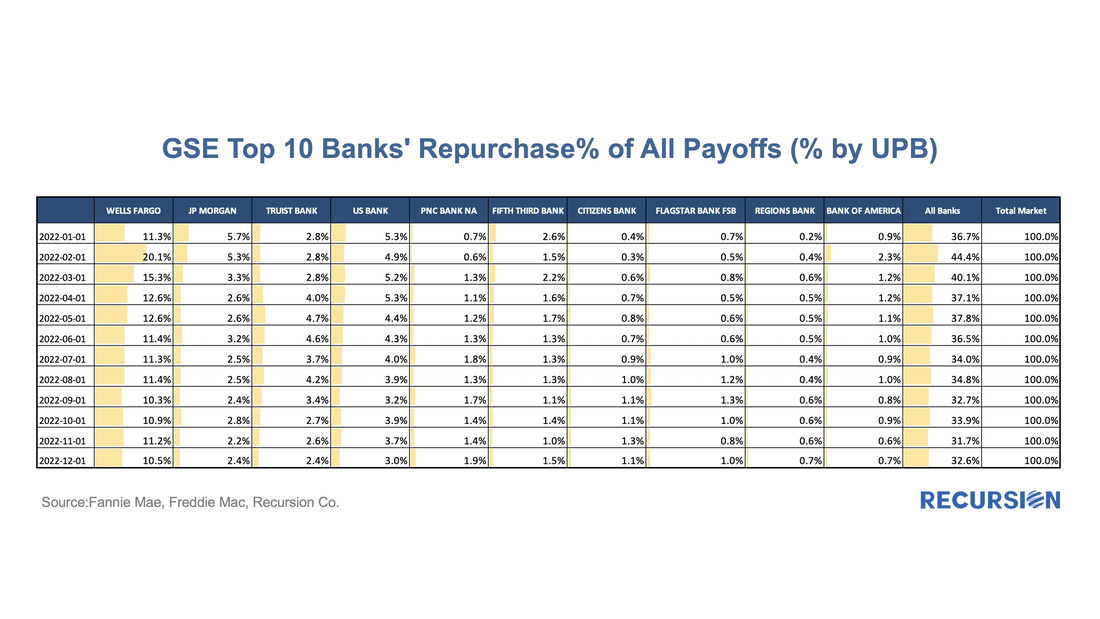
There is a great deal of dispersion between large institutions. In December, the banks with the greatest share of buyouts with their own prepayments were US Bank at about 8.3%. The lowest was JP Morgan, at 2.4%.
​
For nonbanks:
Picture
run underlying query 1
run underlying query 2
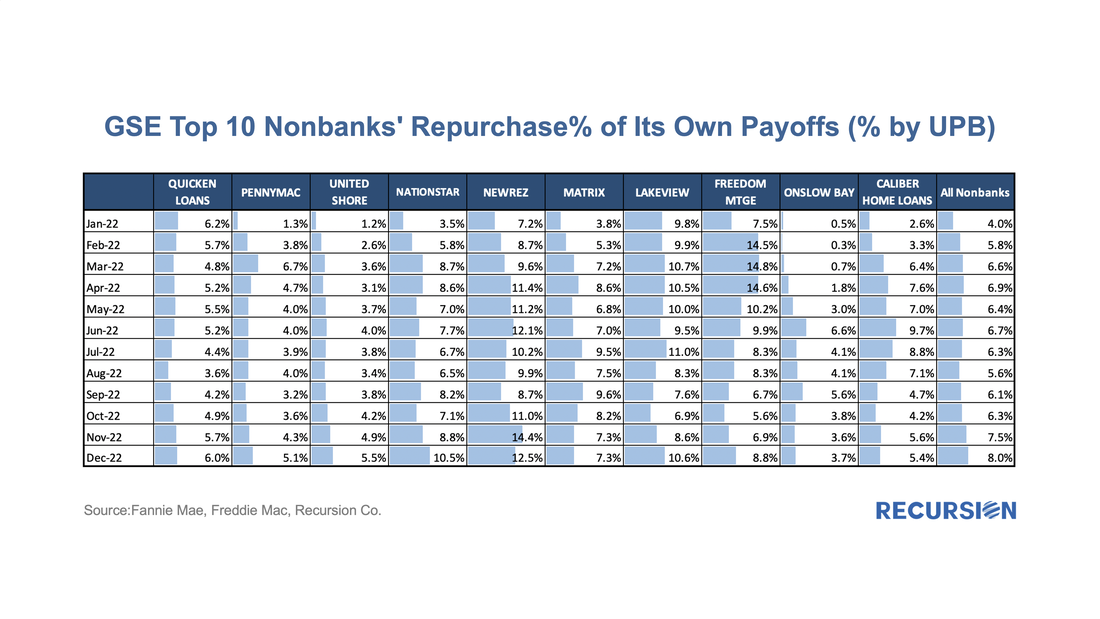
Here NewRez had the highest share in December at 12.5%, while Onslow Bay recorded the lowest share at 3.7%.
​
This analysis opens up a whole new field of institutional-level analysis. Should delinquencies rise more substantially in 2023, this information would be very valuable in searching for relative value between mortgage pools.
Recursion is a preeminent provider of data and analytics in the mortgage industry.
Please contact us if you have any questions about the underlying data referenced in this article.

    Archives

    April 2025
    January 2025
    November 2024
    September 2024
    August 2024
    July 2024
    June 2024
    May 2024
    April 2024
    March 2024
    February 2024
    January 2024
    December 2023
    November 2023
    October 2023
    September 2023
    August 2023
    July 2023
    June 2023
    May 2023
    April 2023
    March 2023
    February 2023
    January 2023
    December 2022
    November 2022
    October 2022
    September 2022
    August 2022
    July 2022
    June 2022
    May 2022
    April 2022
    March 2022
    February 2022
    January 2022
    December 2021
    November 2021
    October 2021
    September 2021
    August 2021
    July 2021
    June 2021
    May 2021
    April 2021
    March 2021
    February 2021
    January 2021
    December 2020
    November 2020
    October 2020
    September 2020
    August 2020
    July 2020
    June 2020
    May 2020
    April 2020
    March 2020
    February 2020
    May 2019
    March 2019
    February 2019

    Tags

    All
    Affordability
    ARM
    Bank Call Report
    Bank\nonbank
    Borrower Assistant Plan
    Buydown
    Cash Window
    Climate Change
    CMBS
    CMO
    Conforming Loan
    Conventional Loan
    COVID 19
    CPR\CDR\CRR\CCR
    Credit Score\DTI\LTV
    Credit Union
    CRT\CAS\STACR
    Delinquency
    DPA
    Early Buyout
    Early Payment Default
    ESG
    ET Pools
    Fannie Mae
    Fed
    FHA
    FHFA
    Forbearance
    Foreclosure
    Foreign Investor
    Freddie Mac
    Freddie Mae
    FTHB\Repeated Purchase
    Ginnie Mae
    Green Loans
    GSE
    HECM
    HELOC
    HMDA
    HUD
    LMI
    Macro
    Manufactured Housing
    Modified Loans
    MSR
    Multifamily
    Multi-issuer
    Occupancy Type\NOO
    Partial Claim
    Payoff
    PIW
    Prepayment
    Property Valuation Methods
    PUD
    Purchase Loans
    Recursion In News
    Recursion In The News
    Refi Loans
    Reperforming
    Repurchase
    RG Pools
    RIN
    Rural Housing
    SEC
    Second Lien
    Single Family
    Special Eligibility Program
    TBA Market
    TIC
    TPO
    UMBS
    US Treasury
    VA

    RSS Feed

RECURSION

SOLUTIONS ​
Recursion Analyzers
​
Mortgage Company Data
Recursion DataCloud
Customized Solutions


ABOUT US  ​
Overview
​Our team
CLIENT LOGIN   ​
Recursion Analyzers

CONTACT

224 West 30th St., Suite 303, New York, NY 10001
Contact Us

Picture
Copyright © 2024 Recursion, Co. All rights reserved.​
  • HOME
  • solutions
    • RECURSION ANALYZERS
    • Mortgage Company Data
    • Recursion DataCloud
    • Customized Solutions
  • BLOG
  • CLIENT LOGIN
    • Recursion Analyzers
  • ABOUT US
    • OVERVIEW
    • OUR TEAM
    • News & Events >
      • Recursion In News
      • Recursion Data Citations
  • CONTACT