|
One of our ongoing themes is that pervasive structural change implies that traditional relationships between measures of market performance and economic fundamentals cannot be relied on to be stable over time. As a result, a broader view across markets is called for. Below see 90+Day delinquency rates as reported by the Federal Reserve Bank of New York’s Household Debt and Credit Report:[1]  There are quite a few points to take away from this chart. Note the peaks around the time of the Global Financial Crisis (2009-2010) and the onset of the Covid Crisis (2020-2021). These correspond well with comparable spikes in the unemployment rate (10% in October 2009 and 14.8% in April 2020). But the composition is quite different. During the GFC mortgage, DQs spiked very much higher for mortgages than those for car loans, while the pattern was reversed during Covid. This can reflect differences in policy between the two periods (mortgage forbearance in 2021 but not 2011), but also, this likely reflects consumer’s views on the value of paying off different types of debt. In 2010, house prices were plummeting, so incentives to pay towards an underwater mortgage were low, but they needed their cars to get to their jobs, so they continued to pay off their auto loans. During the more recent Covid crisis period, homeowners in distress had access to forbearance programs. This brings us to the more recent period. We see that delinquency rates across products started to rise in late 2022 across debt classes. Of note is the sharp increase in 90-day DQs for credit cards from 7.7% in Q4 2022 to 10.7%, above the Covid crisis peak of 10.0% in 2021Q1 and the highest reached since 10.9% in Q2 2012. Car loan DQs rose modestly from 3.7% to 4.4% over this period, while mortgage DQs inched slightly higher from 0.4% to 0.6%. The superior performance in mortgages is no doubt due to the post-Covid surge in house prices, which has created a powerful incentive for homeowners to stay current on their mortgages. But the interesting observation is that these increases occurred even though the unemployment rate has remained less than or equal to 4.0% for the past 18 months. Clearly there is a class of distressed borrowers out there in this relatively strong labor market. Since the NY Fed data contains no detail at all in terms of these borrowers, we take a deep dive into mortgage delinquencies based on agency disclosures. We start by looking at total delinquencies of the total books of business for the GSEs and FHA:  It's interesting to note that the trend in all cases is flat-to-down, in contrast to the slight rise in the NY Fed data[2]. There are many possible explanations for this, including that our data do not contain VA or non-QM loans, and that the NY Fed data is based on a 5% sample while ours covers the entire universe of outstanding mortgages in the GSE and FHA programs[3]. For our purposes, the most interesting program is FHA since these borrowers tend to have lower incomes, lower credit scores, and less experience managing debt compared to other mortgage holders, implying that they have relatively higher vulnerability to adverse economic conditions[4]. The thing is, as mentioned earlier, conditions are not that adverse. To find trends in distress in the FHA program we look at modified loans as these started out as loans that were determined to be unsustainable to begin with. In fact, performance here has deteriorated on trend over the past couple of years:  The 90-day DQ rate for these loans almost doubled from 4.1% in February 2022 to 8.0% in March 2023 and has been in a volatile but flat trend since that time. We look for fundamental trends to scale this trend, in general, from labor market indicators, which we feel is the key driver of mortgage performance. There are many such candidates, but here we look at the Kansas City Federal Reserve Labor Market Condition Indicators (LMCI)[5]. These indicators consist of 24 distinct labor market variables. The indicator we use is the LMCI Level of Activity index. It is scaled so that a number above zero indicates a stronger level of activity than the long-term average. In the chart above, we invert this indicator so as to see the correlation with rising distress in FHA modified loans. It seems that modified loans are sensitive to deceleration in labor market activity. We can dig deeper into this phenomenon by breaking the data down into different categories:  Here, we break the FHA universe into four categories: ET loans, mods ex ET, RG and other purposes. ET is extended term, which are generally 40-year mortgages. RG is Reperforming, which is not a mod but a loan leaving forbearance with a partial claim. All four categories exhibit quite different behaviors with ET loans displaying sharply worse performance than the other categories. It’s important to note that the ET share is quite small but growing:  The above chart points out that while looking at DQ charts is informative, they can be somewhat misleading in situations where programs have been around for different lengths of time. One way to get around this is to look at particular cohorts. Below find DQ’s for the 2022-2024 cohort:  It’s interesting to note here the stability in the Mod ex-ET and other categories. Growing distress is visible for the newer RG and ET programs, although the DQ rates for both peaked earlier this year. Finally, another way of looking at distress over time in a consistent pattern across programs is via Early Payment Defaults (EPDs). These are the share of loans that experience two or more months of missed payments in the first six months after origination:  EPDs jumped with the onset of Covid but quickly fell back after forbearance and other policy programs were instituted. More recently, we can see distress in the various mod programs while loans in the Other category exhibit little such behavior. This difference is interesting because the incentive to pay for more recently-originated mortgages is very much less than those prior to 2021 given the recent jump in home prices. To conclude, examining the behavior of nonpayment of debt is a very complex task, which varies by loan class, and subclass. It depends on the financial health of borrowers, and the state of the economy, particularly with respect to labor markets. It is important to avoid making broad statements about trends in DQs without taking these factors into consideration. Finally, we do not see broad signs of distress in consumer debt markets (particularly credit cards) spilling over to mortgages, except possibly in the most distressed cohorts. We conclude that mortgages are not yet a source of general financial concern, but the situation needs to be closely monitored, particularly within the most distressed category of borrowers. [1] https://www.newyorkfed.org/microeconomics/hhdc
[2] This contradicts a widespread view that FHA loan performance has deteriorated in recent quarters. In fact, the 30-day DQ rate for FHA has been in an upward trend over the past two and a half years. (To as high as 6.5% recently, according to FHA Loan Performance Trends Report). Most of these however, cure before hitting the 90-day threshold. [3] See New York Fed Household Debt And Credit Report (https://www.newyorkfed.org/microeconomics/hhdc), p44, paragraph 1. [4] For 2023 issued GSE and FHA loans (disclosed by Agencies), the WA credit score is 754 vs. 676; while the share of first-time home buyer of purchase loans is 46.5% vs. 75.0%. In addition, according to HMDA 2023, the WA borrower’s income is $301k for conventional loans and $112K for FHA loans. [5] https://www.kansascityfed.org/data-and-trends/labor-market-conditions-indicators/ In recent months, we have witnessed increasing attention being focused on the Government mortgage programs, particularly VA. Two issues in particular have generated considerable discussion. First, last year VA allowed its forbearance programs to expire without a backstop for distressed borrowers wishing to avoid foreclosure. Instead, VA implemented a voluntary foreclosure moratorium for their servicers, which has been extended to the end of 2024. And very recently, VA implemented a new program, the Veterans Administration Servicing Purchase Program (VASP), to help households in need, with full availability required by December 31, 2024[1]. Second, there has been a noticeable pickup in VA prepayment speeds compared to other major programs, including FHA[2]. This is particularly evident in higher coupon securities:  The secondary mortgage market is generally focused on mortgage servicers. These institutions bear substantial risk, and their strategies regarding prepayments and foreclosures impact borrower welfare and investor returns. Yet they are not the whole picture. A buyer of a mortgage pool owns a collection of loans serviced by a variety of financial institutions. However, there are borrower characteristics impacting loan performance that are out of the control of the servicer, notably the strength of underwriting beyond what is captured in disclosed statistics such as credit scores. The originators matter. The issue we face is that loan-level data disclosed by the Agencies does not, in any case, correspond precisely to the notion of “originator” for either the GSEs or FHA besides servicers. In the case of FHA, we see the entities that pool loans to sell in accordance with Ginnie Mae regulations, known as “issuers”. For the GSEs, this is sellers, the firms that deliver loans to Fannie Mae and Freddie Mac to securitize. The sellers and issuers may be the loan originators, but many of these loans may have been purchased from other firms (through what is known as the “wholesale channel”). The purpose of this note is to see to what extent we can utilize supplemental data regarding originators to enhance the information we have at our disposal to assess the valuation of Agency pools. Our ability to perform this analysis relies on our expertise in normalizing massive amounts of mortgage company information. We start with FHA and move on to the GSEs, paying close attention to the institutional differences. FHA For some time, we have mentioned the FHA portfolio snapshot data[1]. This data provides the originators for the universe of all FHA loans. We can usefully compare the distributions of the originators of the loans in this dataset to the issuers of Ginnie Mae pools containing FHA loans. The GSEs As we explored alternative datasets, we noticed that The Security and Exchange Commission (SEC) has for some time been collecting originator information at the pool level for loans securitized by Fannie Mae and Freddie Mac. This discovery has profound implications for enhancing transparency in mortgage production activity. The first issue that arises is concerned with data coverage and quality. The most straightforward approach to this is accomplished by comparing the balance and loan counts of the loans originated in each pool to the number of loans serviced across pools securitized by each agency:  It turns out that the two measures are quite close, with 98.9% of pool-level coverage within 10% and 95.5% within 5% of the Agency data from 2013 to Q1 2024. Fannie Mae’s ratio experienced some bumpiness in 2017 but more recently, has held close to 100%. Freddie Mac experienced a brief period (3 months) of a sharp drop in the ratio in 2014. Interestingly, ever since Covid struck in early 2020, Freddie Mac has experienced a small but persistent deviation averaging 2.7%. Much remains to be explained here. In order to benchmark the new data, the table below provides comparisons between originator and seller/issuer across product types  In the case of the GSEs, the loan counts are extremely close, with a difference of under 700 loans out of almost two million originated. In the case of FHA, there is a difference of 3,800 or 0.5%. This difference primarily reflects the number of FHA loans originated that are held on depositor balance sheets. This factor arises in the FHA category because the data source provides total originations while the SEC data provides information only for originations of loans that are securitized into pools. Bank/nonbank As a final benchmarking exercise, we look at the bank/nonbank composition for originations and sellers of conforming loans:  The shares have been very similar since mid-2020, one year after UMBS implementation, implying that there is minimal bias in this regard in the originator data. The Freddie nonbank seller data has ticked up recently vs. nonbank originations data, however. The Homebuilders An interesting use case of the new data can be found in the category of homebuilders. These are an interesting subset of the mortgage universe for a variety of reasons. In particular, the “mortgage winter” environment, where existing home sales are suppressed by current residents who have low-rate mortgages, doesn’t apply in the new home market. As a result, the share of this segment out of total purchase originations and issuance in agency pools has risen sharply over the past two years:  A key takeaway is that we can now observe that the share of this sector in the securitized market is larger than can be obtained directly from the Agency disclosures. One straightforward but interesting exercise is to calculate the average loan amount for home builders. It is not surprising that the builder loan balances are significantly higher than other loans. What next? Looking forward, the application of the SEC originations data to conforming pools adds a new dimension to the analysis of pool performance. Our Cohort Analyzer will soon be able to break down prepayments and delinquencies by both servicer and originator, offering investors a new approach to determining valuation. We’ll be back. Note: For a more complete version of this report including detailed information on the largest institutions in the various categories discussed above, reach out to [email protected]. [1] We referred to this dataset very recently in an analysis of the use of down payment assistance programs for FHA loans: https://www.recursionco.com/blog/a-deep-dive-into-fha-dpas.
The secondary mortgage market is generally focused on mortgage servicers. These institutions bear substantial risk, and their strategies regarding prepayments and foreclosures impact borrower welfare and investor returns. Yet they are not the whole picture. A buyer of a mortgage pool owns a collection of loans serviced by a variety of financial institutions. However, there are borrower characteristics impacting loan performance that are out of the control of the servicer, notably the strength of underwriting beyond what is captured in disclosed statistics such as credit scores. The originators matter.
The issue we face is that loan-level data disclosed by the Agencies does not, in any case, correspond precisely to the notion of “originator” for either the GSEs or FHA besides servicers. In the case of FHA, we see the entities that pool loans to sell in accordance with Ginnie Mae regulations, known as “issuers”. For the GSEs, this is sellers, the firms that deliver loans to Fannie Mae and Freddie Mac to securitize. The sellers and issuers may be the loan originators, but many of these loans may have been purchased from other firms (through what is known as the “wholesale channel”). Recently, we utilized supplemental data regarding originators to enhance the information we have at our disposal to assess the valuation of Agency pools. Our ability to perform this analysis relies on our expertise in normalizing massive amounts of mortgage company information. Stay tuned for more updates. In a recent post, we summarized the main market indicators from 2023 HMDA[1]. Besides offering a wider view of the mortgage market than contained in the Agency disclosures, HMDA contains a wealth of information about borrower characteristics, harking back to its original purpose of ensuring credit availability across populations. This note provides a look at some of the most-followed characteristics. We start with the race of the borrower. This type of analysis is rather nuanced as HMDA allows for information for up to two borrowers per loan file, with demographic information available for both. The chart below shows the distribution of new conventional and FHA mortgages by the race of the first race category reported by the first borrower only. 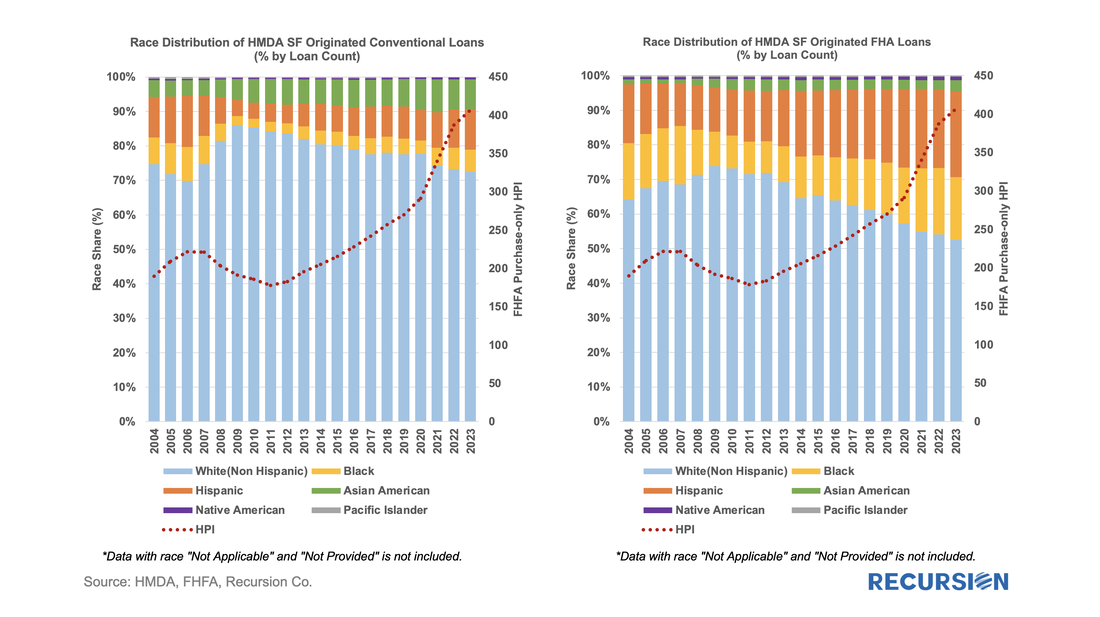 A few salient points can be immediately inferred. First, we can see that the minority share of mortgage recipients has risen steadily over the past 14 years for both loan types. 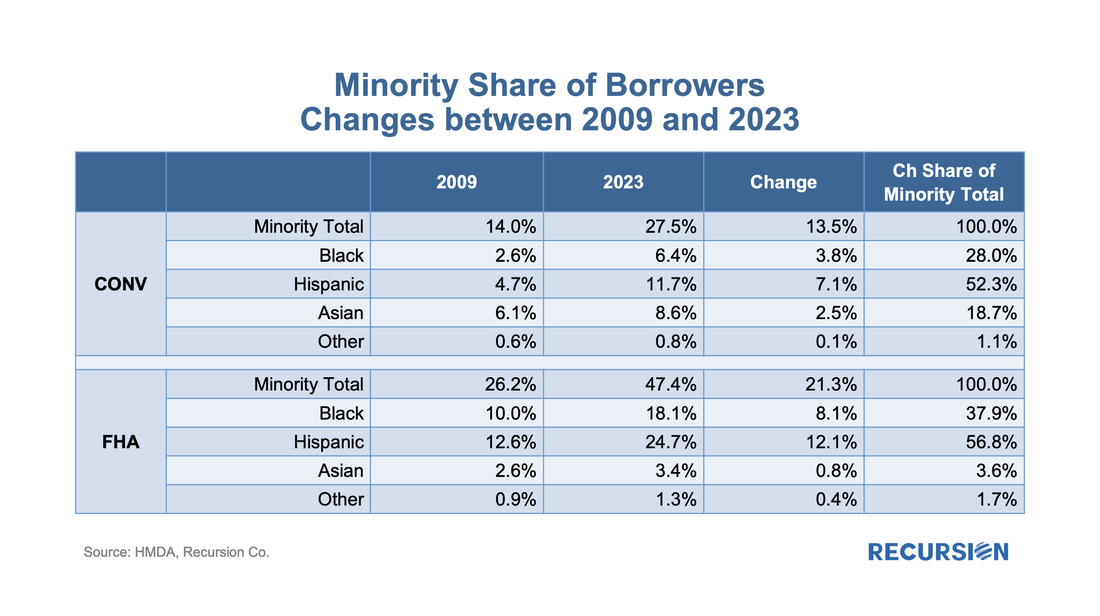 FHA continues to have a higher minority share than conventional, with minority borrowers accounting for almost half (47%) of new loans last year. That said, the share of minority borrowers obtaining conventional loans almost doubled over the 2009-2023 period to 28%, slightly below the 30% peak attained in 2006. In terms of breakdowns by race, the increase in the share of loans going to Hispanic borrowers led minority in both the conforming and FHA markets. Asian borrowers remain more significant to conventional than to FHA. There are many factors that account for these trends, including population growth in each category, policy measures taken to support minority ownership, and overall market conditions. It’s interesting to note that there is a distinct correlation between minority share and house prices in both programs. In the mid-2000, this ended badly as a disproportionate share of minority borrowers were trapped in toxic loans that led to foreclosures when the market collapsed. These concerns do not automatically carry over to the present as credit conditions are much more conservative, and policy is designed to keep distressed borrowers in their homes to the greatest extent possible. Next, we turn to gender. Here is the share of two-borrower loans where the lead borrower identifies as female: 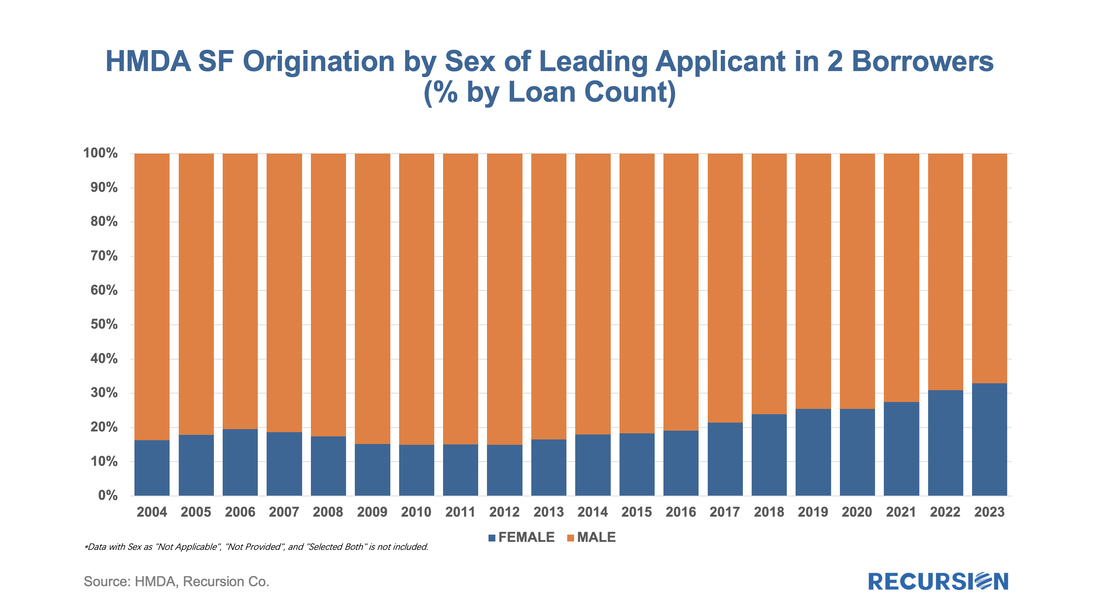 In 2023, the female share rose for the 10th time in 11 years, more than doubling from 14.9% in 2012 to 32.9% last year. HMDA also contains borrower income information, but a detailed analysis awaits the arrival of MSA-level median income data from HUD, which should be out sometime mid-year about when the final version of 2023 HMDA is released. For now, we can look at the distribution of loans by income bucket for the past three years: 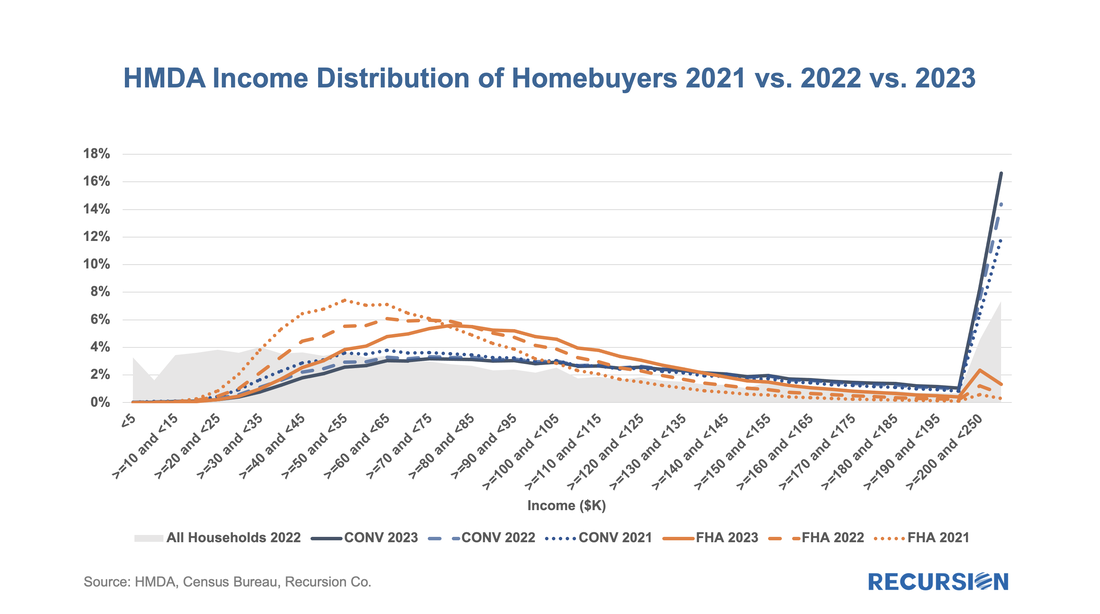 For both conventional and FHA loans, we have witnessed an increase in the weight of the distribution at the right tail, at the expense of the hump in middle-income brackets. This is particularly true for conforming loans where the share of incomes in the greater than or equal to $250 bucket jumped from 11.9% in 2021 to 16.6% in 2023. In the next blog, we will look at manufactured housing, a topic receiving increased policy scrutiny in the current era of unaffordable housing. This rich and robust dataset can accomplish much more. Feel free to contact us with specific questions. In a recent post, we reviewed the market for mortgages with down payment assistance features[1]. We noted that our loan-level data for FHA showed a rate that was about half of that reported by the FHA Portfolio Snapshot database. Since the agency disclosures are at the loan level, we use this dataset to do a deep dive into which servicers are most active with this product and what loan performance looks like across institutions. Unlike the previous note, which covered all deliveries, here we focus on the market for new purchase mortgages. Below find a table of the DPA usage for the top ten FHA purchase mortgage issuers in 2023, along with summary statistics for 2022 and 2021: 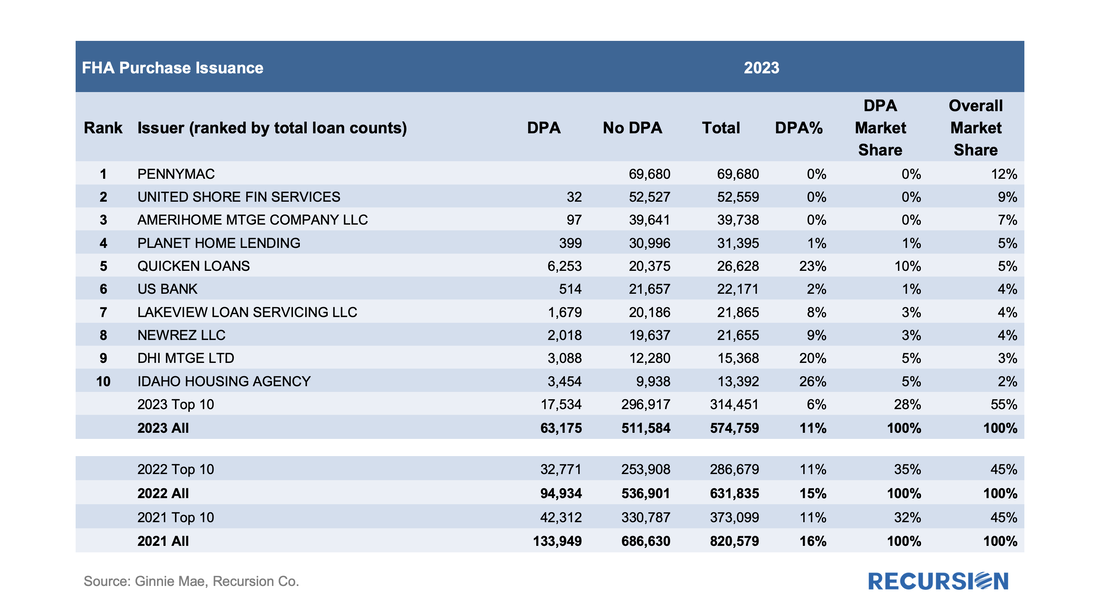 On March 8, 2023, Silicon Valley Bank (SVB) announced a loss of $1.8 billion in a sale of assets and collapsed two days later. The ensuing market turmoil resulted in a string of bank failures and a temporary surge in Federal Reserve lending to the banking sector. What impact has this event had on the mortgage market? To answer this question, we need to be able to distinguish the impact of the SVB collapse from other factors that can impact bank lending. The economy in general and labor markets in particular have posted robust performance statistics over the past year. Mortgage rates, which were about 6.75% in early March last year, surged to a 23-year peak of 7.75% in November and currently stand nearly unchanged from a year ago at about 6.75%.  In Mortgage Winter, affordability is job one for housing policy. In our most recent quarterly macro report, we noted that the share of loans with buydowns posted significant increases across all three agencies in the second half of 2023[1]. To see how widespread these sorts of supportive actions are, we look at down payment assistance (DPA) programs. To start, the GSEs only allow downpayment assistance through specified second lien programs: “Community Seconds” for Fannie Mae[2] and “Affordable Seconds” for Freddie Mac[3]. While there are technical differences between programs, they are second liens funded by an approved list of government agencies, nonprofits, and private sector lenders. The liens are subordinate to the first mortgage and face various limits on combined LTV (CLTV) and note rates. These liens are neither securitized by the Enterprises nor directly reported in the data disclosures. However, we could identify those (we call it “piggyback”) by looking for loans with the original combined LTV higher than its original LTV. Below find the number of owner-occupied loans containing “piggyback” liens for the HFA programs, the low-income programs (FNM “Home Ready” and FHL “Home Possible”), and other[4]: 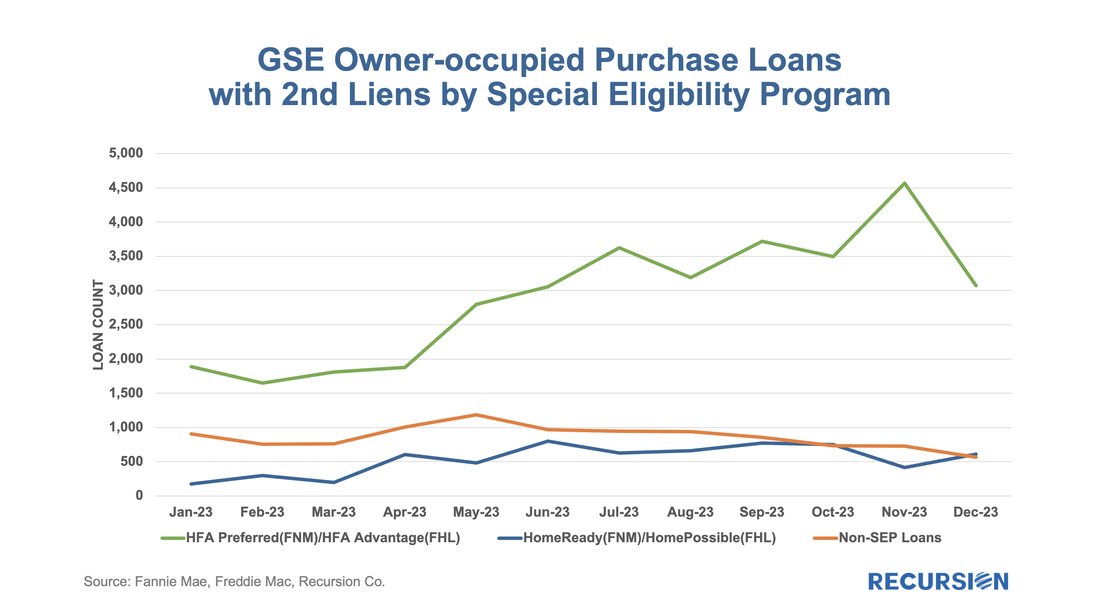 |
Archives
July 2024
Tags
All
|
 RSS Feed
RECURSION |
|

Copyright © 2022 Recursion, Co. All rights reserved.