|
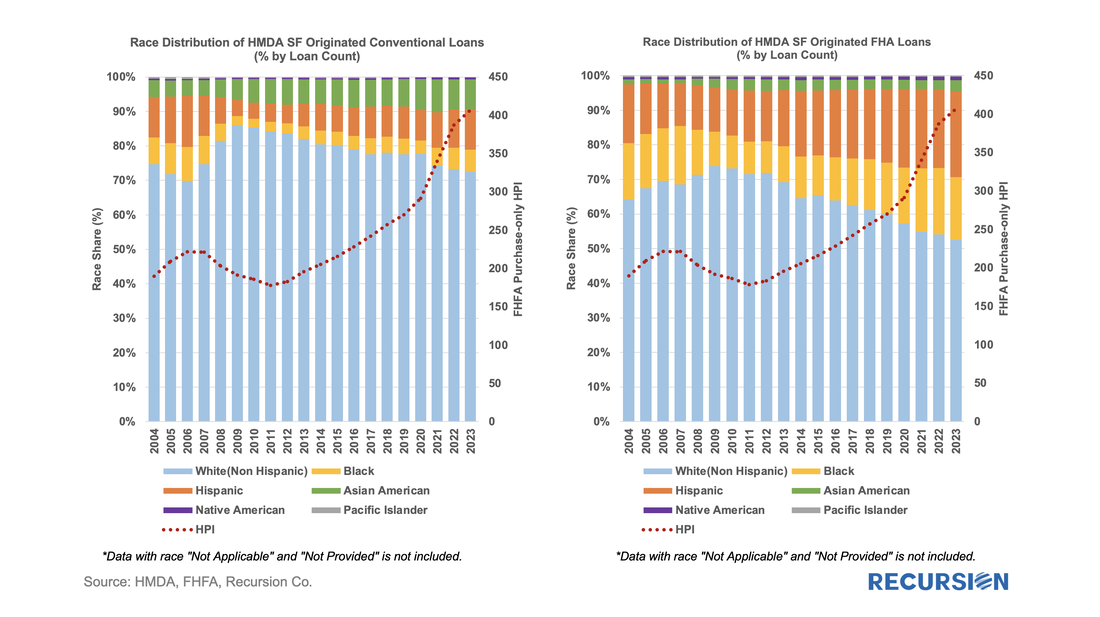
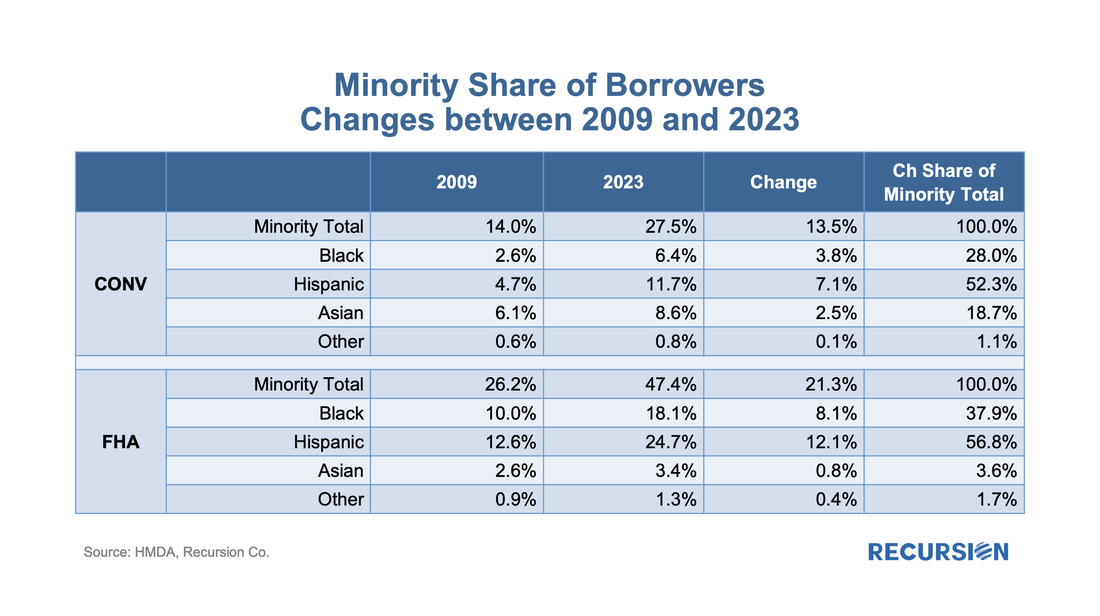
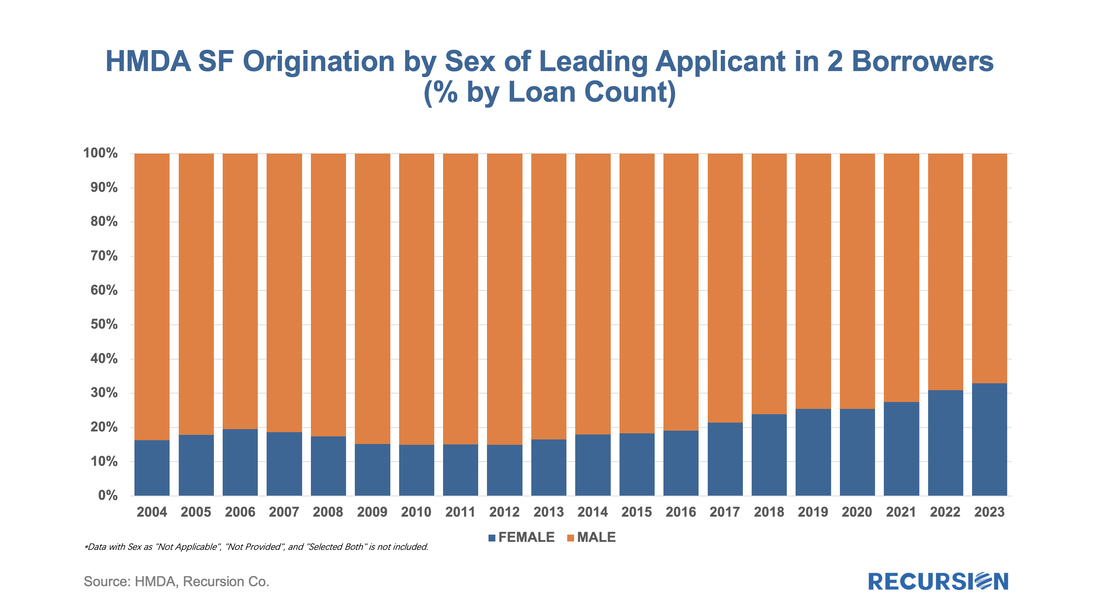
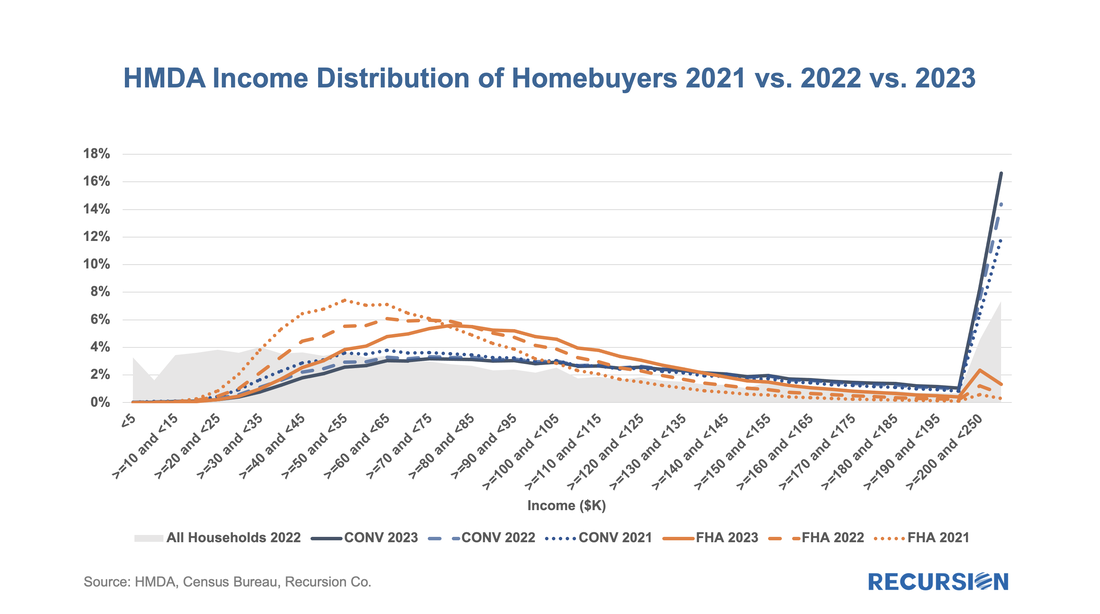
In a recent post, we summarized the main market indicators from 2023 HMDA[1]. Besides offering a wider view of the mortgage market than contained in the Agency disclosures, HMDA contains a wealth of information about borrower characteristics, harking back to its original purpose of ensuring credit availability across populations. This note provides a look at some of the most-followed characteristics. We start with the race of the borrower. This type of analysis is rather nuanced as HMDA allows for information for up to two borrowers per loan file, with demographic information available for both. The chart below shows the distribution of new conventional and FHA mortgages by the race of the first race category reported by the first borrower only. A few salient points can be immediately inferred. First, we can see that the minority share of mortgage recipients has risen steadily over the past 14 years for both loan types. FHA continues to have a higher minority share than conventional, with minority borrowers accounting for almost half (47%) of new loans last year. That said, the share of minority borrowers obtaining conventional loans almost doubled over the 2009-2023 period to 28%, slightly below the 30% peak attained in 2006. In terms of breakdowns by race, the increase in the share of loans going to Hispanic borrowers led minority in both the conforming and FHA markets. Asian borrowers remain more significant to conventional than to FHA. There are many factors that account for these trends, including population growth in each category, policy measures taken to support minority ownership, and overall market conditions. It’s interesting to note that there is a distinct correlation between minority share and house prices in both programs. In the mid-2000, this ended badly as a disproportionate share of minority borrowers were trapped in toxic loans that led to foreclosures when the market collapsed. These concerns do not automatically carry over to the present as credit conditions are much more conservative, and policy is designed to keep distressed borrowers in their homes to the greatest extent possible. Next, we turn to gender. Here is the share of two-borrower loans where the lead borrower identifies as female: In 2023, the female share rose for the 10th time in 11 years, more than doubling from 14.9% in 2012 to 32.9% last year. HMDA also contains borrower income information, but a detailed analysis awaits the arrival of MSA-level median income data from HUD, which should be out sometime mid-year about when the final version of 2023 HMDA is released. For now, we can look at the distribution of loans by income bucket for the past three years: For both conventional and FHA loans, we have witnessed an increase in the weight of the distribution at the right tail, at the expense of the hump in middle-income brackets. This is particularly true for conforming loans where the share of incomes in the greater than or equal to $250 bucket jumped from 11.9% in 2021 to 16.6% in 2023. In the next blog, we will look at manufactured housing, a topic receiving increased policy scrutiny in the current era of unaffordable housing. This rich and robust dataset can accomplish much more. Feel free to contact us with specific questions. |
Archives
July 2024
Tags
All
|
RECURSION |
|
Copyright © 2022 Recursion, Co. All rights reserved.


 RSS Feed
