|
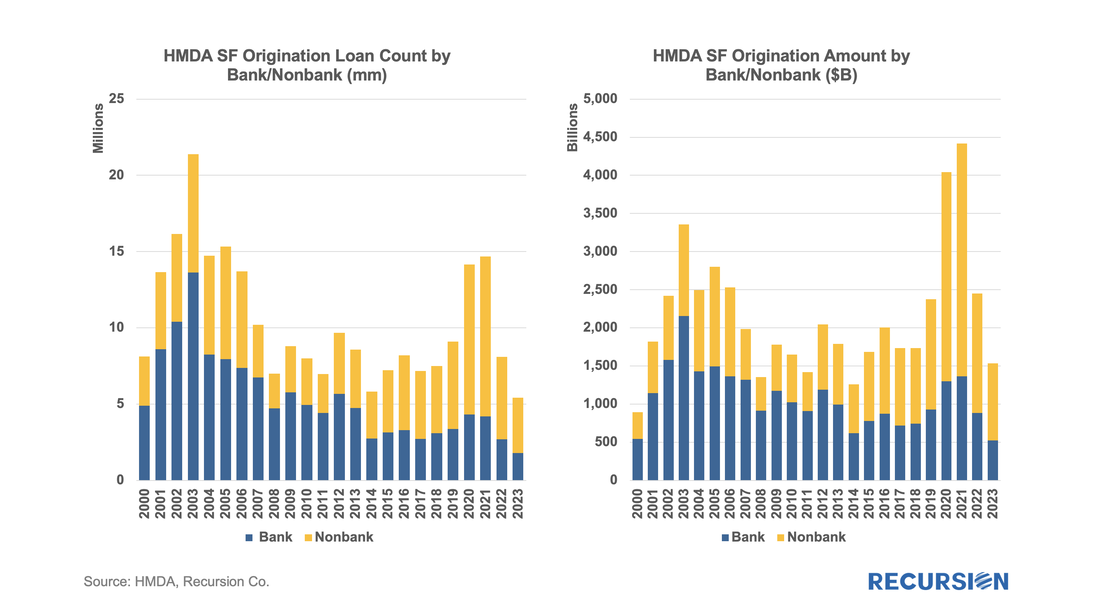
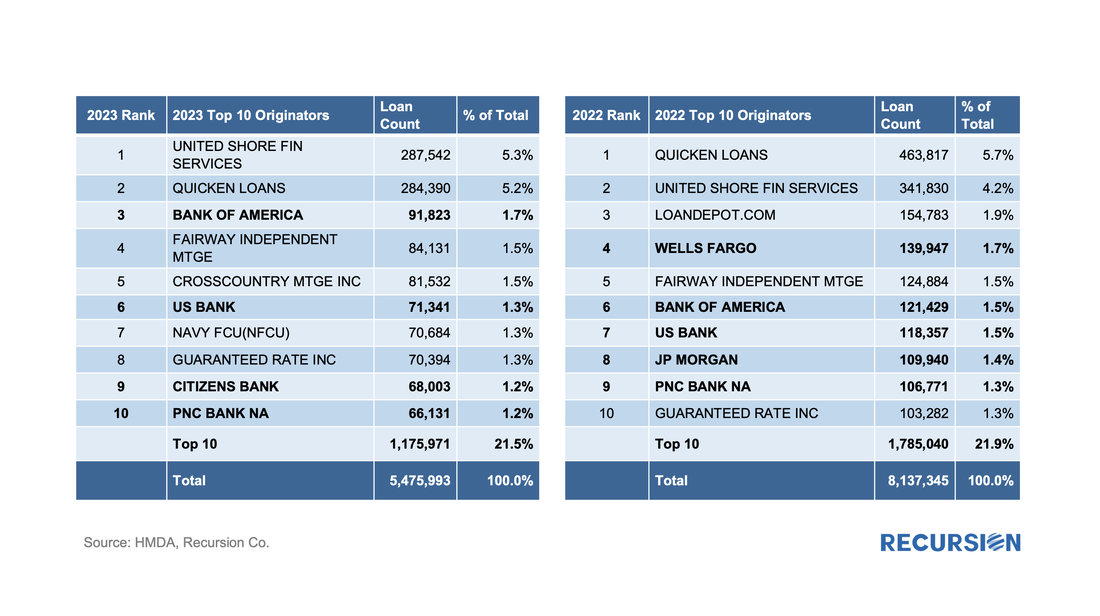
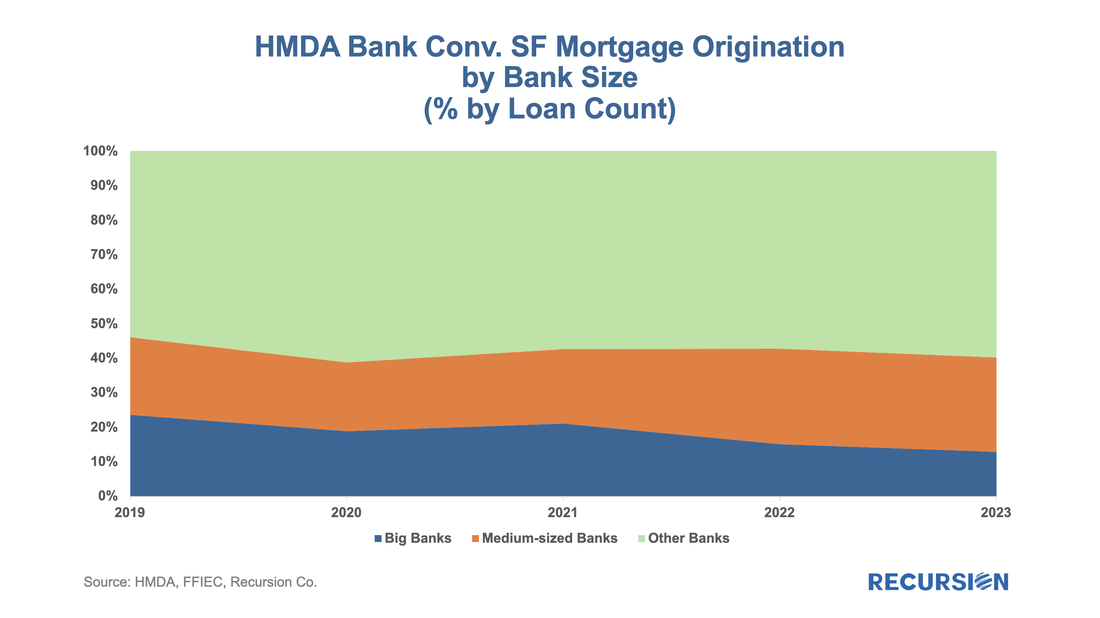
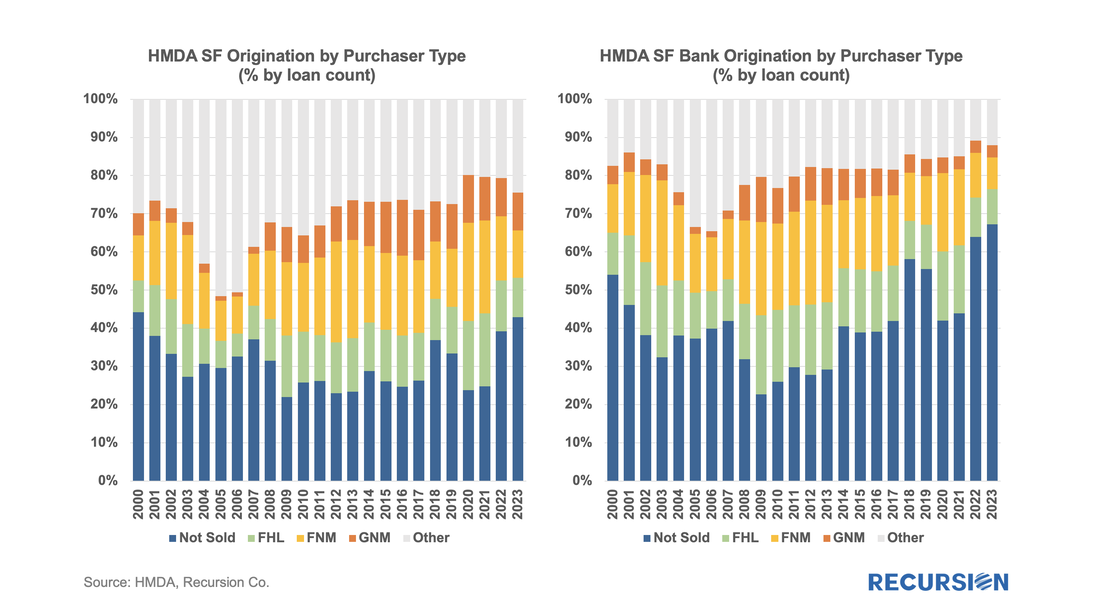
The preliminary HMDA data came out last week, and we have it fully processed and available on our Recursion HMDA Analyzer. While always notable, this release has been particularly eagerly awaited as it represents the first complete view of market conditions in “Mortgage Winter”, the extraordinary period of sustained high house prices and mortgage rates. Not surprisingly, volumes are down compared to 2022, more so for balances than loan counts: There were just 5.4 million single-family mortgages originated last year, remarkably beating out the 5.8 million figure reported in 2014 to become the lowest production year thus far in the 21st century. This number includes 1.3mm junior lien mortgages, which decreased slightly from a historical record of 1.4mm in 2022. The bank share by loan count dipped very slightly to 33.0% from 33.1% last year, above the recent low of 28.6% in 2021, but half that attained 15 years ago. Looking at the top 10 largest originators, we see: Once again, the market was dominated by the two nonbank giants, United Shore and Quicken. Their combined share rose from 9.9% in 2022 to 10.5% last year. The number of banks in the top 10 fell from five to four in 2023, with the share of volumes within the category declining from 33.4% in 2022 to 25.3% last year. Interestingly, the Navy Credit Union burst into the top 10 in 2023. Banks had an interesting year in 2023 with the collapse of SVB and others early in the year. This raises the question of the share of bank originations by the size of institution. Using our Recursion Call Report Analyzer[1], we can break originations down by asset size. We focus here on the conforming market: The share of the biggest banks by loan count out of all banks declined for the second straight year to 13% in 2023 from 15%. Over this period, the share of medium-sized banks dropped by 1% to 27%, and the smaller bank share jumped by 3% to 60%. We conclude with the share of originations by purchaser type. The most important “new” information we obtain from this report is the bank’s “held on book” category, as this is not available in the more timely Agency disclosure data. Below we look at this both for the total market and for banks alone: The held-on-book share out of the total market rose to 42.9%, from 39.2% in 2022, the high obtained since 44.2% reported in 2000. Looking at just the bank originations, the held-on-book share rocketed higher to 67.2% from 64.0%. Bank behavior promises to be a rich source of commentary in 2024 given the active regulatory calendar. The other source of “new” information that comes with a new HMDA release is borrower demographic data. This will be the subject of a future report. Note: All charts and tables are based on the preliminary data. The complete dataset will be available around June 2024. |
Archives
July 2024
Tags
All
|
RECURSION |
|
Copyright © 2022 Recursion, Co. All rights reserved.


 RSS Feed
