|
As the economy slows and the impact of inflation weighs on many households, we have noted signs of distress in mortgage performance in parts of the market despite the resilience observed in the labor market[1]. Another corner of the market that is drawing attention is reverse mortgages. The metric used to assess performance in this space is the number of mandatory purchase events. Unlike the situation in the forward mortgage market, these occur not when the borrower faces financial distress[2], but when the servicer is compelled to purchase a loan out of a pool once the balance reaches 98% of a pre-set amount -- the “Maximum Claim Amount (MCA)”[3]. This amount is capped so as to reduce the risk of the loan amount surpassing the valuation of the collateral. The fundamental factor driving this event is interest rates as HECMs are floating-rate loans, and a higher rate brings the loan balance up faster. Recursion’s HECM Analyzer tool allows us to quantify the number of prepayments that are due to this factor, both in absolute dollar amount and as a share of total prepayments. 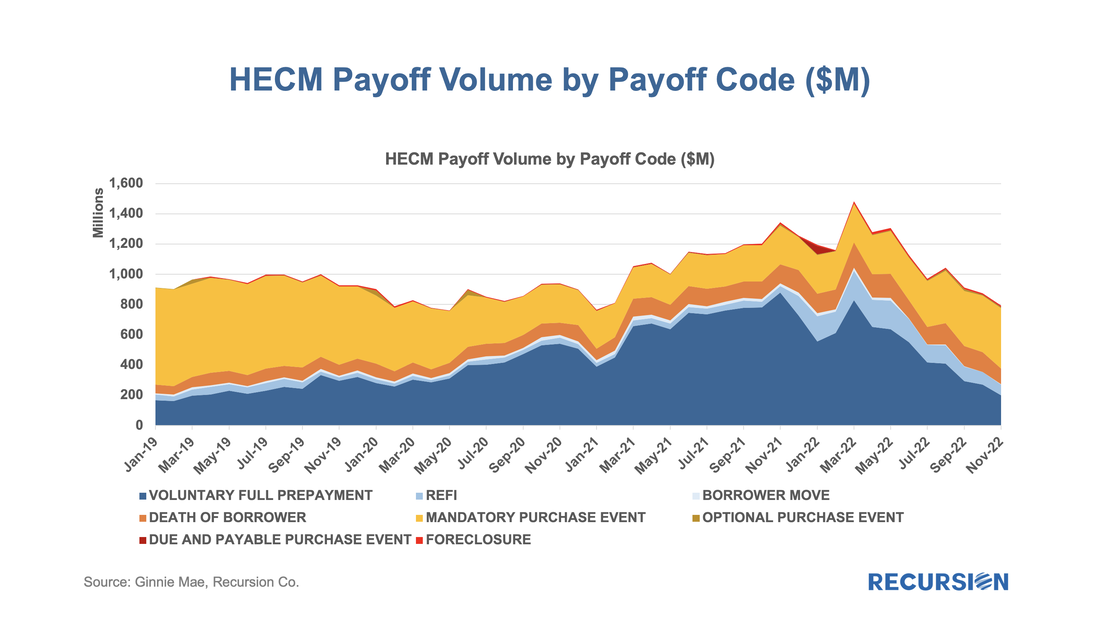 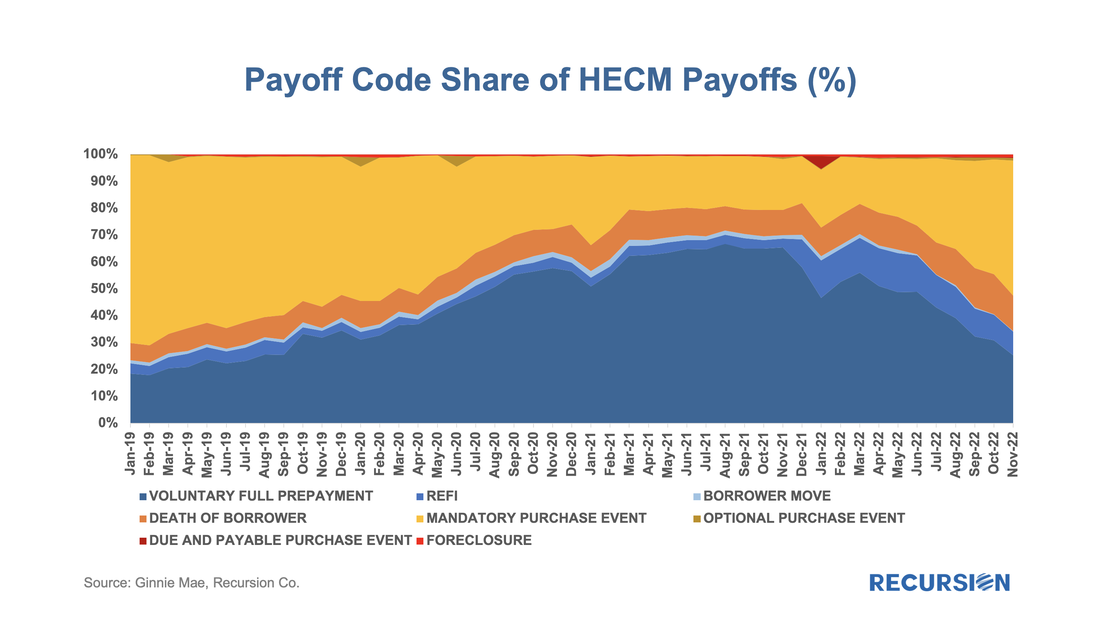 Recursion has undertaken an intensive effort to compute the size of the Agency CMO market back to 2000. The size of the Agency CMO market is calculated by building up from the loan level. This data is provided by agency disclosure of the portfolio of each collateral group and collected from text files, pdfs, and other formats across single-family and multifamily CMOs. The formats of the disclosure files differed across agencies and changed over time, presenting a challenge to unify. 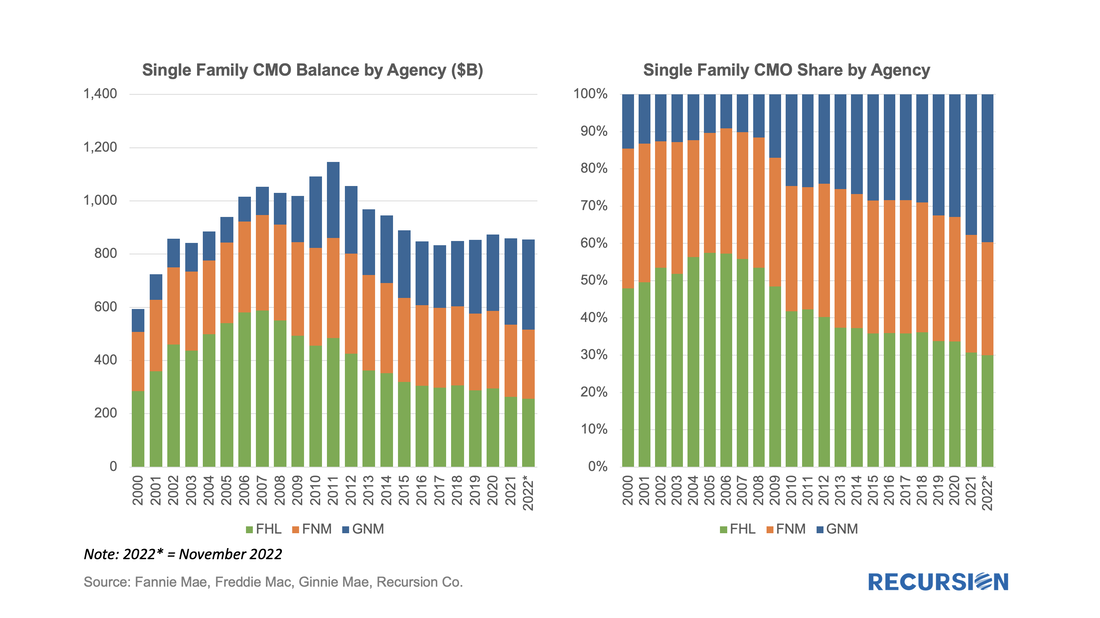 To read the full article, please send an email to [email protected] For some time, we have been following the trends in appraisal waiver usage for loans delivered to the GSEs[1]. Now it’s interesting to revisit these trends in the wake of the recent sharp volatility in economic and market conditions. Appraisal waiver usage by originators is one of a number of decisions that reflect the risk appetite of loan-producing firms. All else being equal, a waiver serves to reduce costs, and potentially volumes, at a cost of increased uncertainty about a property’s valuation. As the mortgage market is currently dominated by purchase mortgages in this high interest rate environment, we limit our analysis to this loan purpose. The risk aspect can be clearly seen by the tendency for waivers to be more widely available for borrowers with strong credit profiles: 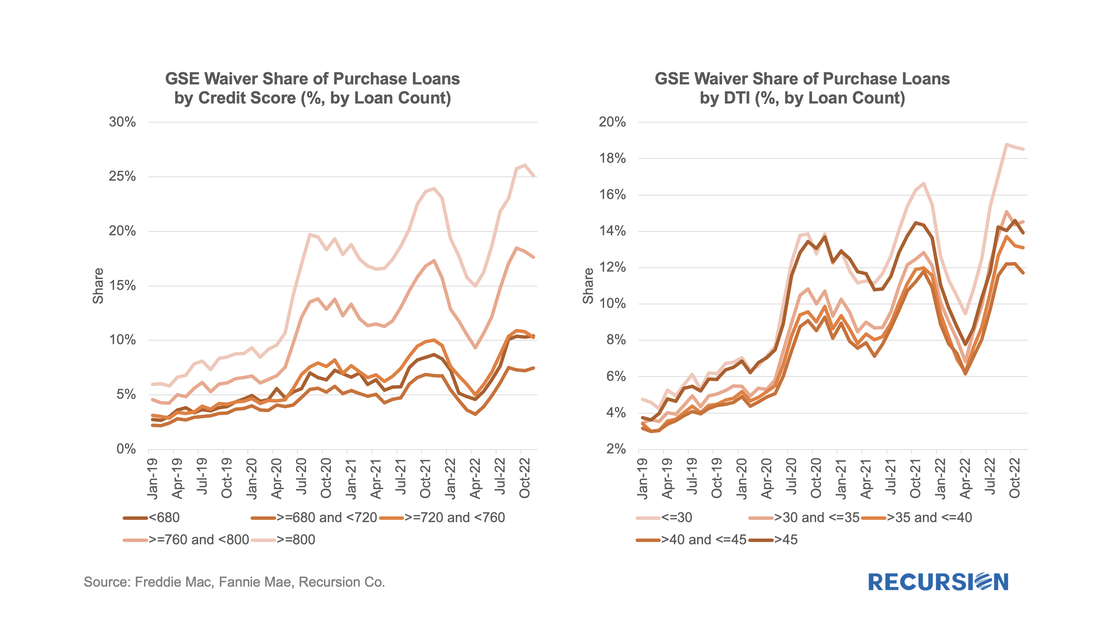 |
Archives
July 2024
Tags
All
|
 RSS Feed
RECURSION |
|

Copyright © 2022 Recursion, Co. All rights reserved.