|
On March 8, 2023, Silicon Valley Bank (SVB) announced a loss of $1.8 billion in a sale of assets and collapsed two days later. The ensuing market turmoil resulted in a string of bank failures and a temporary surge in Federal Reserve lending to the banking sector. What impact has this event had on the mortgage market?
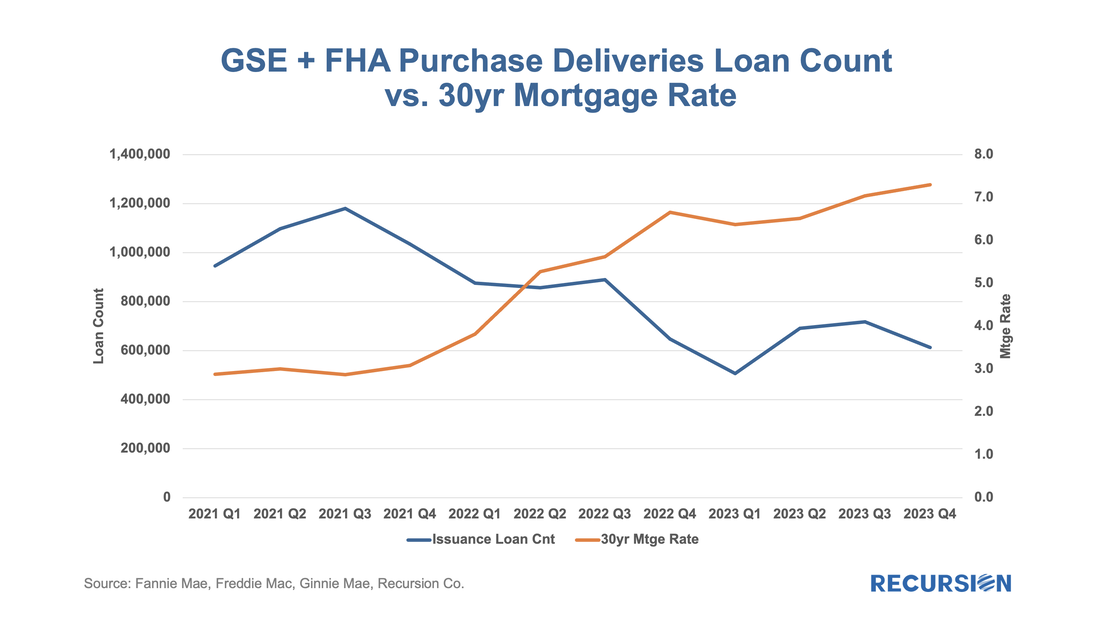
To answer this question, we need to be able to distinguish the impact of the SVB collapse from other factors that can impact bank lending. The economy in general and labor markets in particular have posted robust performance statistics over the past year. Mortgage rates, which were about 6.75% in early March last year, surged to a 23-year peak of 7.75% in November and currently stand nearly unchanged from a year ago at about 6.75%. Some months ago, we set off to assess the impact of high interest rates on the usage of appraisal waivers. It soon became clear that we first needed to look in some detail at recent developments in the structure of the new market for appraisal modernization[1]. In this piece, we return to the original question.
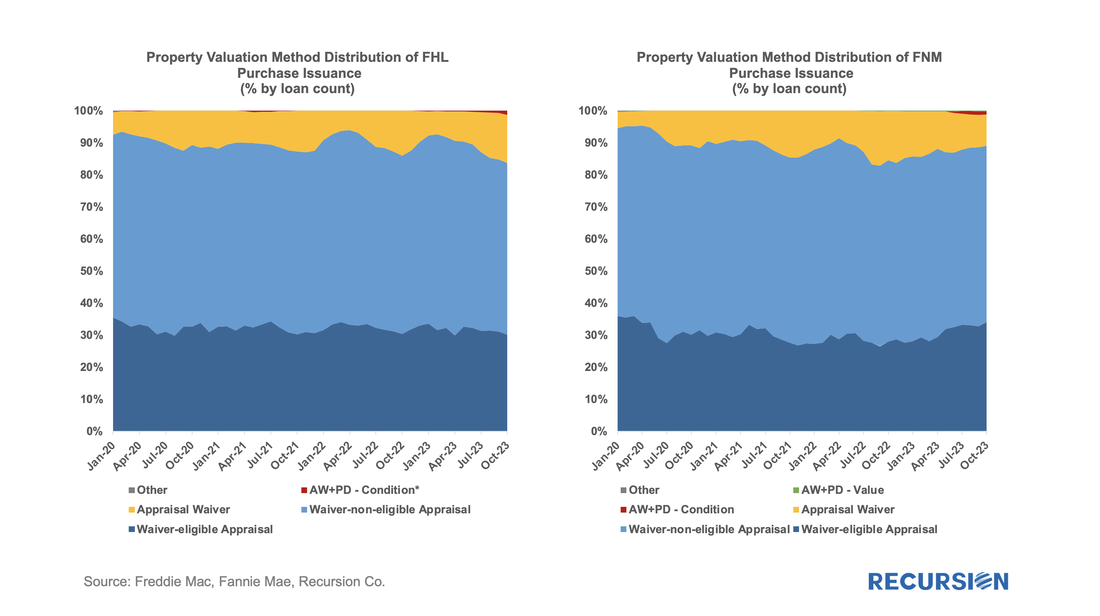
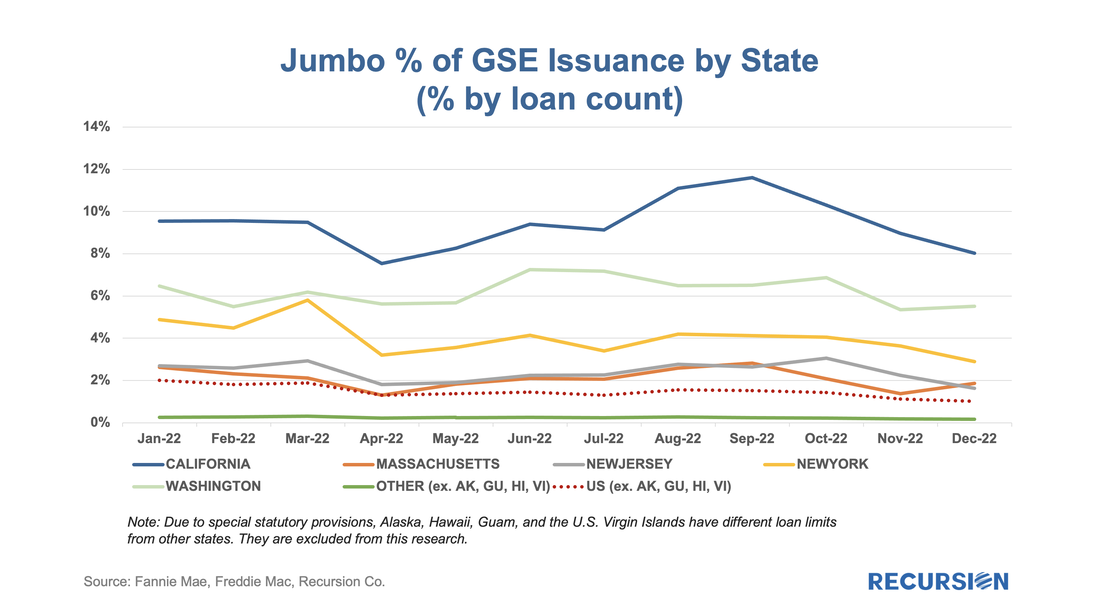
To begin we look at the landscape of loan deliveries for Freddie Mac and Fannie Mae across the suite of available approaches towards appraising property values. Below find such charts for purchase mortgages. Last week’s announcement by FHFA of elaborate changes in the GSE’s upfront fee matrixes to be implemented in May[1] reminded us that this is just the latest in a series of announcements made by the housing regulator over the past year. Just over a year ago, FHFA announced fee hikes for second homes and high balance loans.[2] At the time, we looked at the impact of the second home fee hike on the market through the lens of the relative impact compared to investor properties, which did not experience such an increase. To complete the picture, here is a chart for high-balance loans:
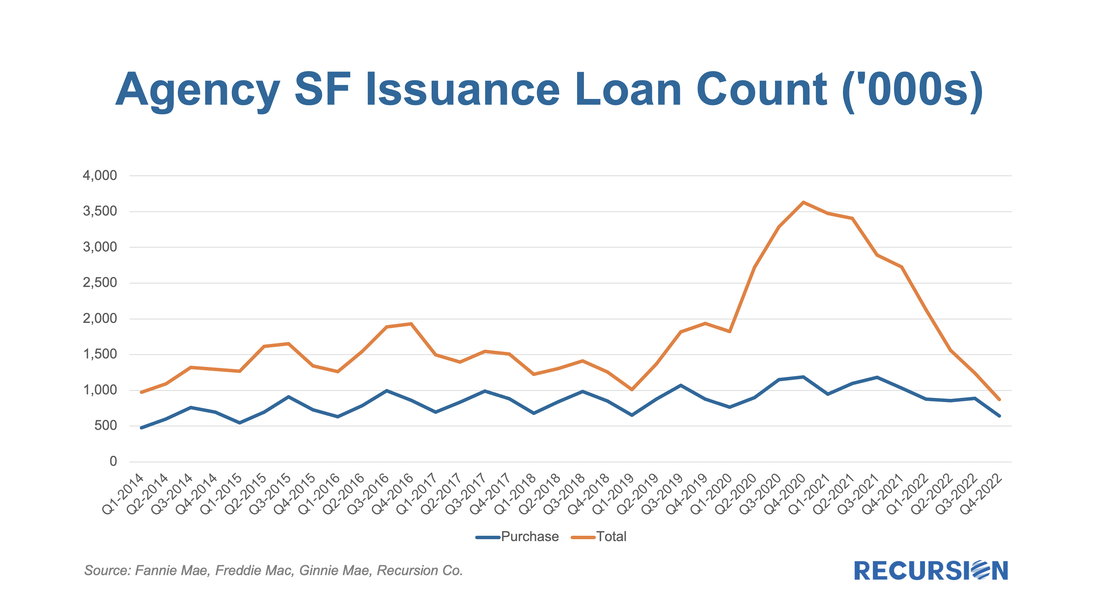
With 2022 at a close, we can begin to assess the impact of the extraordinary shocks of the past few years on the mortgage market landscape. The boom-bust nature of the housing market since the onset of the Covid-19 pandemic has resulted in an unprecedented degree of uncertainty about the outlook. Most commentary in this regard is understandably focused on home prices, but in the end, real estate is a transactional business, and we focus on that market aspect here:
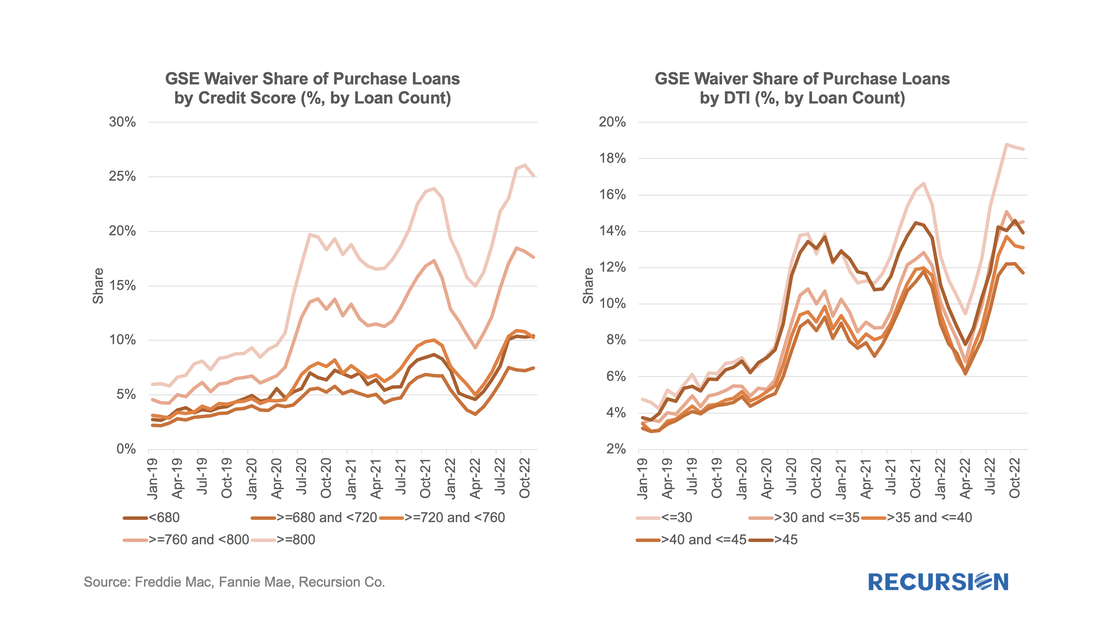
For some time, we have been following the trends in appraisal waiver usage for loans delivered to the GSEs[1]. Now it’s interesting to revisit these trends in the wake of the recent sharp volatility in economic and market conditions. Appraisal waiver usage by originators is one of a number of decisions that reflect the risk appetite of loan-producing firms. All else being equal, a waiver serves to reduce costs, and potentially volumes, at a cost of increased uncertainty about a property’s valuation. As the mortgage market is currently dominated by purchase mortgages in this high interest rate environment, we limit our analysis to this loan purpose.
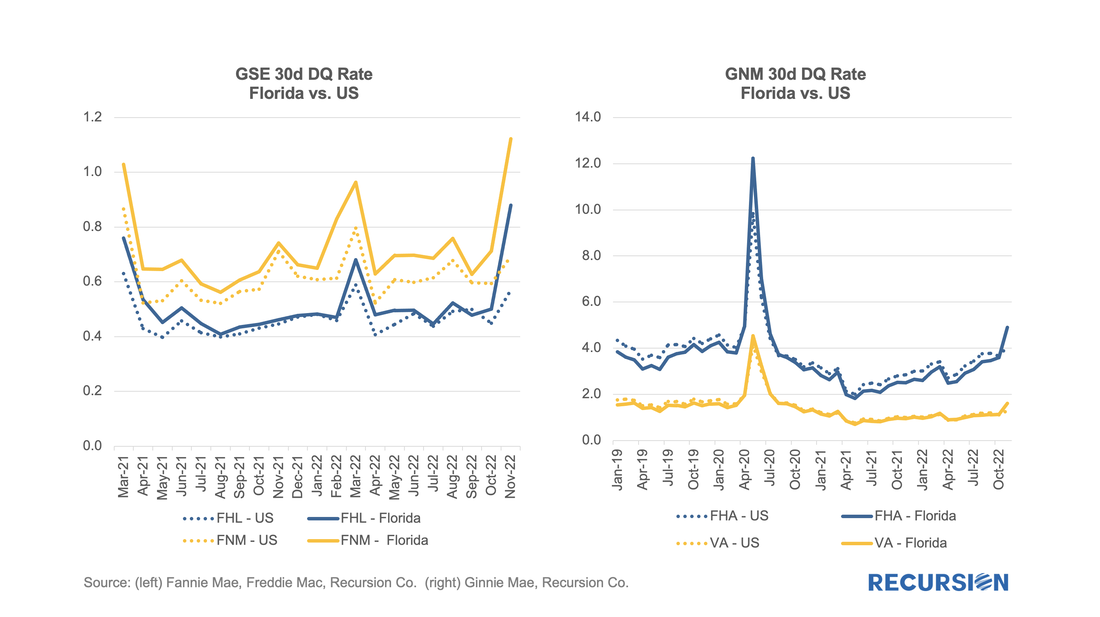
The risk aspect can be clearly seen by the tendency for waivers to be more widely available for borrowers with strong credit profiles: As policy interest rates continue to rise and economic activity begins to slow, attention in the mortgage market shifts towards concerns about the potential for borrower distress. We are early in this process as the labor market continues to add jobs, and there continue to be more job openings than people looking for work. Nonetheless, signs of strain begin to be seen, and it's worthwhile to point out early trends and consider implications.
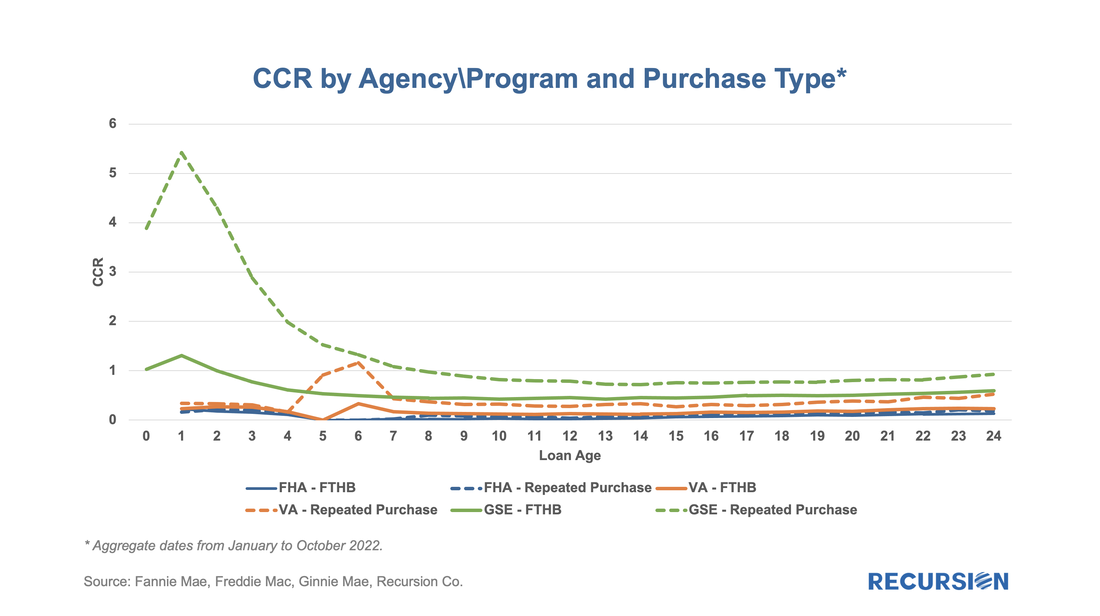
Notably, the impact of Hurricane Ian could be seen in the short-term delinquency data: We’ve written before about curtailments, which are particularly interesting during times of rising interest rates when refinancings are at low levels[1]. We believe that investors and modelers would benefit from examining this aspect of borrower behavior. A good way to demonstrate this is to look at the home payment patterns of repeat homebuyers. In the recent environment of skyrocketing home prices, buyers of new homes have been confident about their ability to sell their current residence and have been more likely to purchase their new home before they pay off their old mortgage. If this story is true, we would expect to see significant curtailment activity within a few months of the purchase of a residence on the part of repeat buyers. In our previous note, we introduced the concept of a “Constant Curtailment Rate”, and implemented the calculation in Cohort Analyzer to quantify this effect:
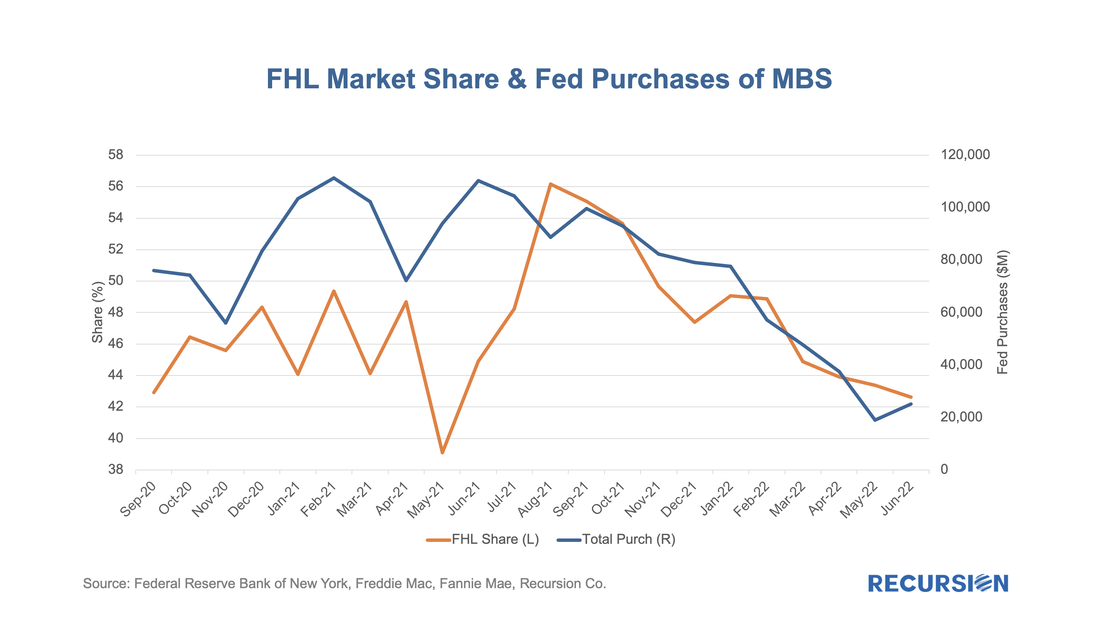
With data in hand for the first half of 2022, it seems a good time to revisit the topic of the share of issuance between the two GSEs. This is also, at least implicitly, a hot topic in policy circles following the announcement on the part of the GSEs that they will be imposing a 50 bp fee on commingled Super and CMO pools starting on July 1[1]. Regular readers of our blog will recall how we pointed out that the Fed purchases of Super pools created an imbalance in favor of Freddie Mac loans that may have been a contributing factor to their rise in market share in 2020 and 2021[2].
Interestingly, the Freddie Mac share of GSE purchase loans has fallen back. As shown in this chart, the FHL share of delivery peaked in August 2021 at 56%, while most recently it stood at 42%. |
Archives
July 2024
Tags
All
|
RECURSION |
|
Copyright © 2022 Recursion, Co. All rights reserved.

 RSS Feed
