|
With mortgage rates near 40-year highs, there has been a pronounced collapse in refinance activity reflected in agency loan originations: 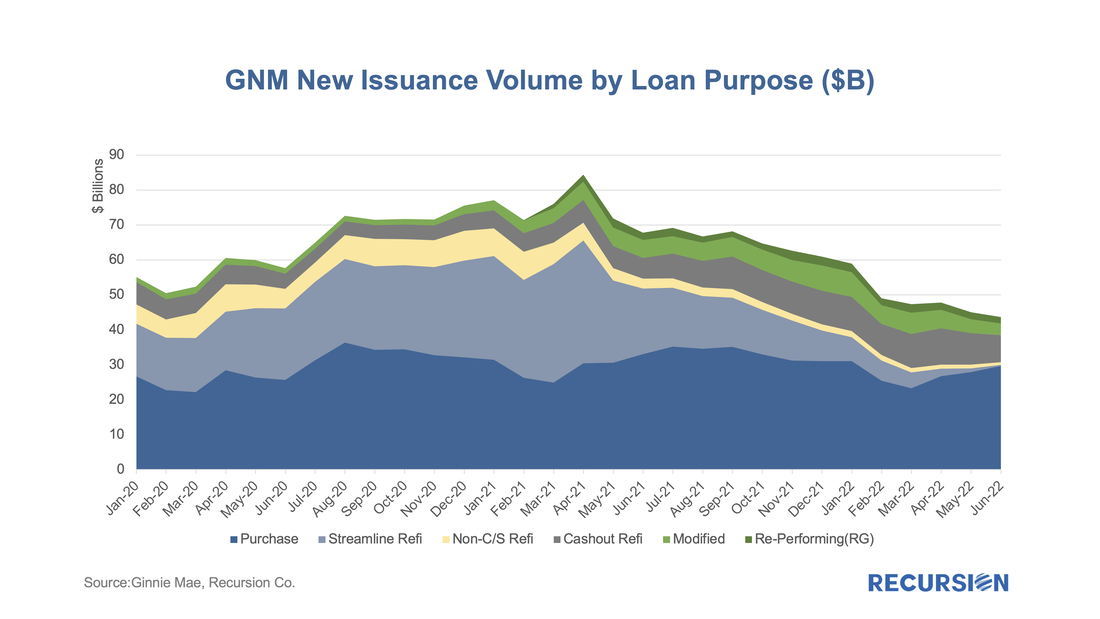 With the 30-year mortgage rate surging to a 13-year high near 5 ¼% and the FHFA purchase-only house price index at a record-high 19.42% in February (edging out the prior record of 19.39% in July 2021), we are in an unprecedented environment in the mortgage market. As such, it makes sense to update our analysis of the trend in issuance updated through April. Of particular interest in this regard are the FHA and VA programs. Let’s start by looking at FHA. By loan count, there were 107,500 FHA loans issued in GNM pools in April, with a decline of over 1/3 from the same month a year earlier. One special interest is the evolution of the share of issuance by loan purpose: 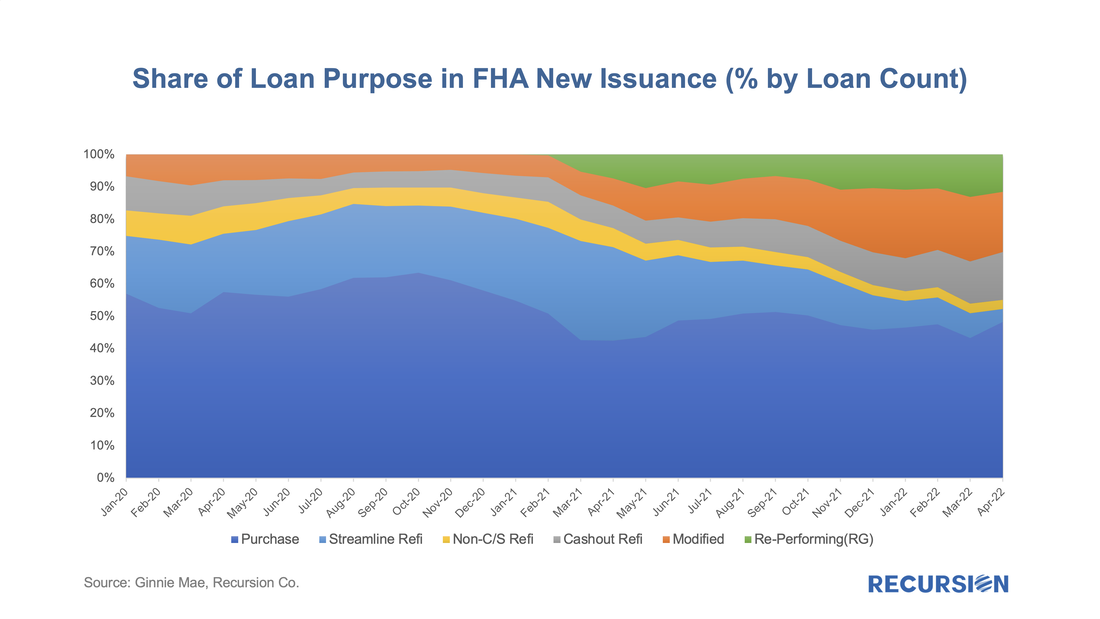 As mortgage rates have moved up recently, we have observed some changing trends in underwriting characteristics associated with GSE new issuance. According to Freddie Mac, the US weekly average 30-year fixed mortgage rate stood at 3.89% as of Feb 24, 2022, which is about a 1.3% increase since the record low level of 2.65% was reached on Jan 7, 2021. 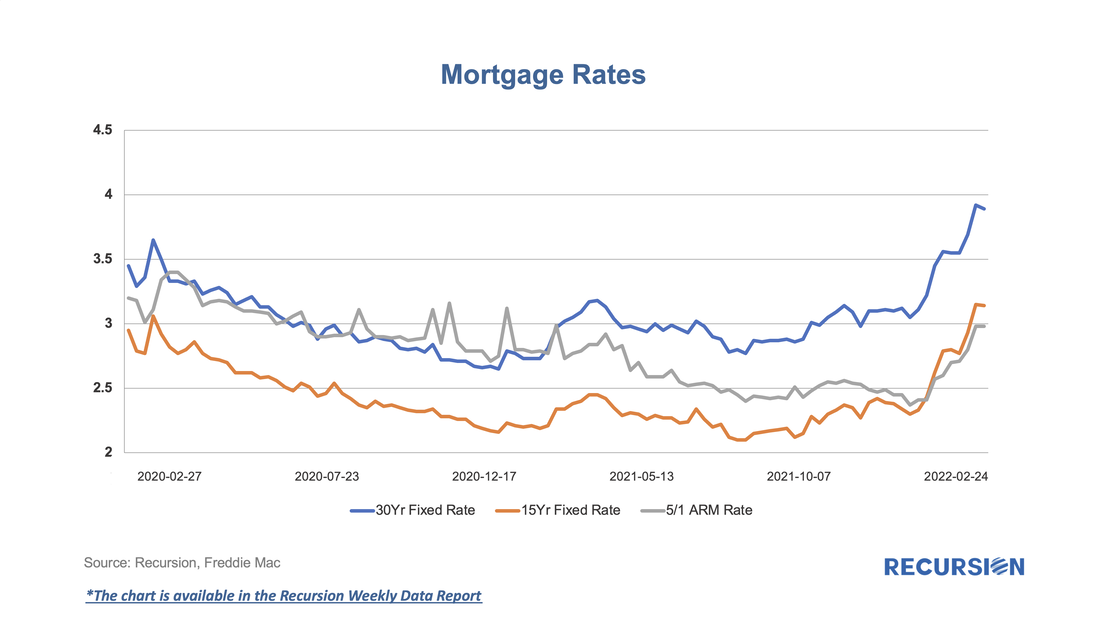 As mortgage rates decline, originators become capacity constrained and allocate credit to the highest-quality borrowers. Similarly, to keep lending pipelines full, originators are likely to loosen up their underwriting standards when rates rise. After declining in recent years when interest rates were low, GSE new issuance purchase loans with DTI over 45 started to increase again in the second half of 2021, especially for Fannie Mae, as mortgage rates began to rise. Nonbanks have historically been more active in lending to higher DTI borrowers, but recently the gap between banks and nonbanks has narrowed. 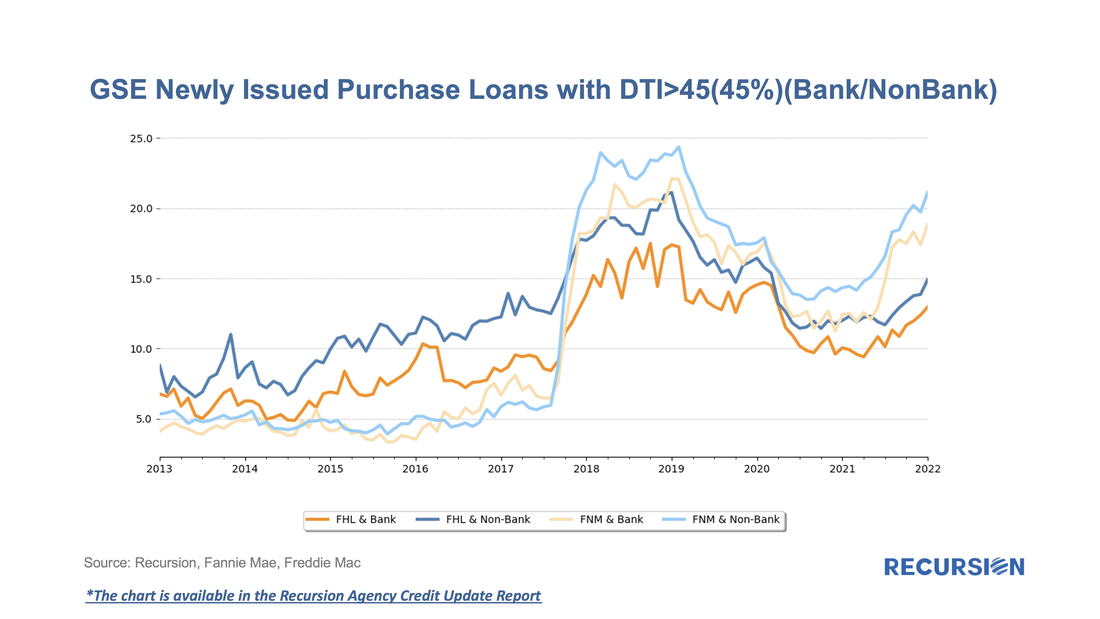 We have observed similar trends in credit scores. After the decline in the shares of low credit score borrowers in 2019 and 2020, sellers have recently been delivering an increasing share of loans with credit score less than 680 to the GSEs. 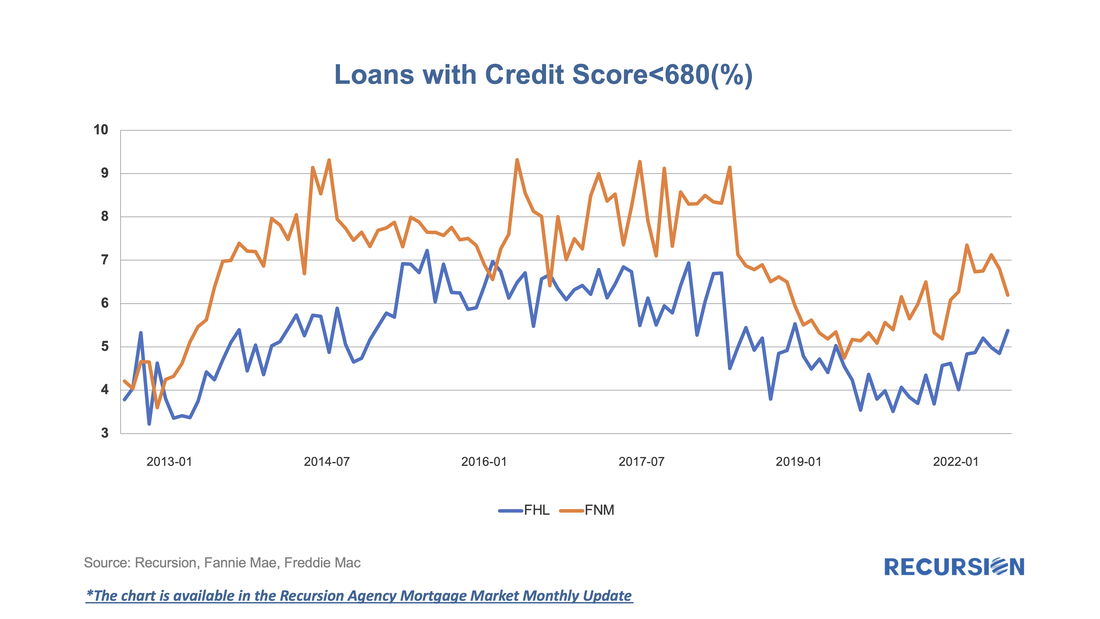 We observe these trends by tracking our monthly data reports. If you are interested in the outlook for mortgage market developments, reach out to inquiry@recursionco.com and subscribe to Recursion Reports!
Recently, the Federal Reserve released its May 2021 Financial Stability Report[1], with a particular emphasis on asset valuations. Valuations are raised as a concern as “Prices of risky assets have generally increased since November with improving fundamentals, and, in some markets, prices are high compared with expected cash flows”. While not cited as a matter of high alarm the report commented that “House price growth continued to increase, and valuations appear high relative to history.” On May 25, FHFA released the purchase-only house price index for March, showing a record-high growth rate of 13.9%, far above the bubble-era peak of 10.7% attained in 2005[2]. Housing fundamentals are of course supportive with mortgage rates below 3% and economic activity rebounding as vaccine optimism spreads. The unique factor now in housing is the impact of the pandemic on preferences for housing away from density and towards suburban and smaller-urban centers. This new fundamental can easily be seen via booming housing demand during the pandemic as measured here by purchase mortgage deliveries to Freddie Mac[3]. 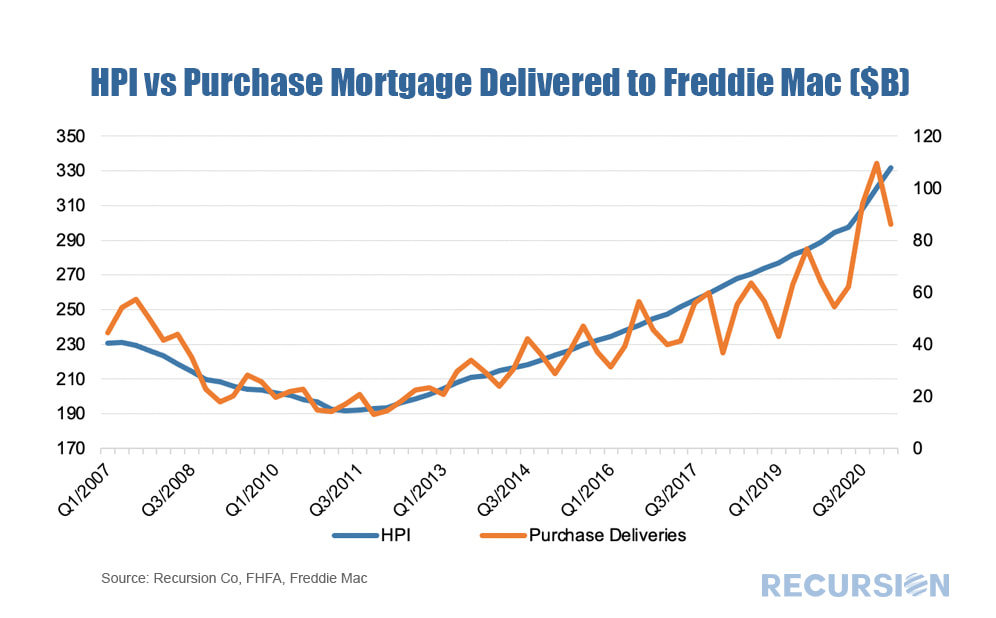 Last August we reported that we had downloaded 2019 HMDA and detailed queries were accessible to our clients via HMDA Analyzer[1]. Recently, the CFPB provided a preliminary release of 2020 data, with information from smaller reporters coming a bit later in the year. Nevertheless, the new data is available on HMDA Analyzer and several insights can already be gained. 1. Total Origination loan count grew to its highest level since the runup to the Global Financial Crisis, driven by a surge in refinancings: 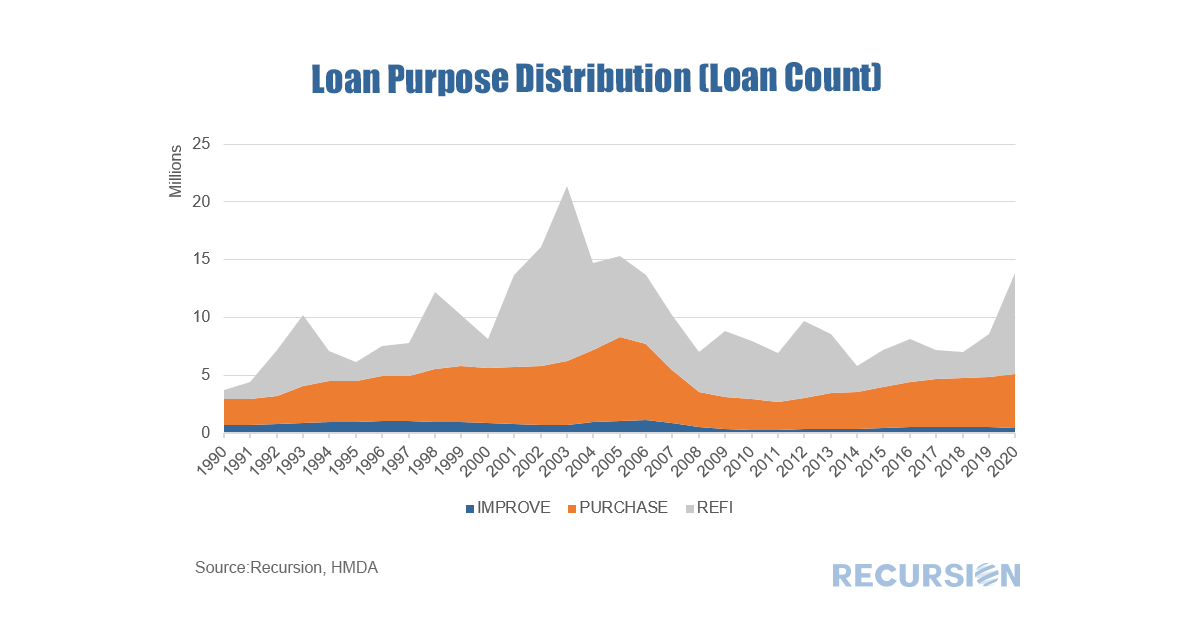 2. Nonbanks Rule – Covid 19 accelerated the long-term trend increase in nonbank lending share: 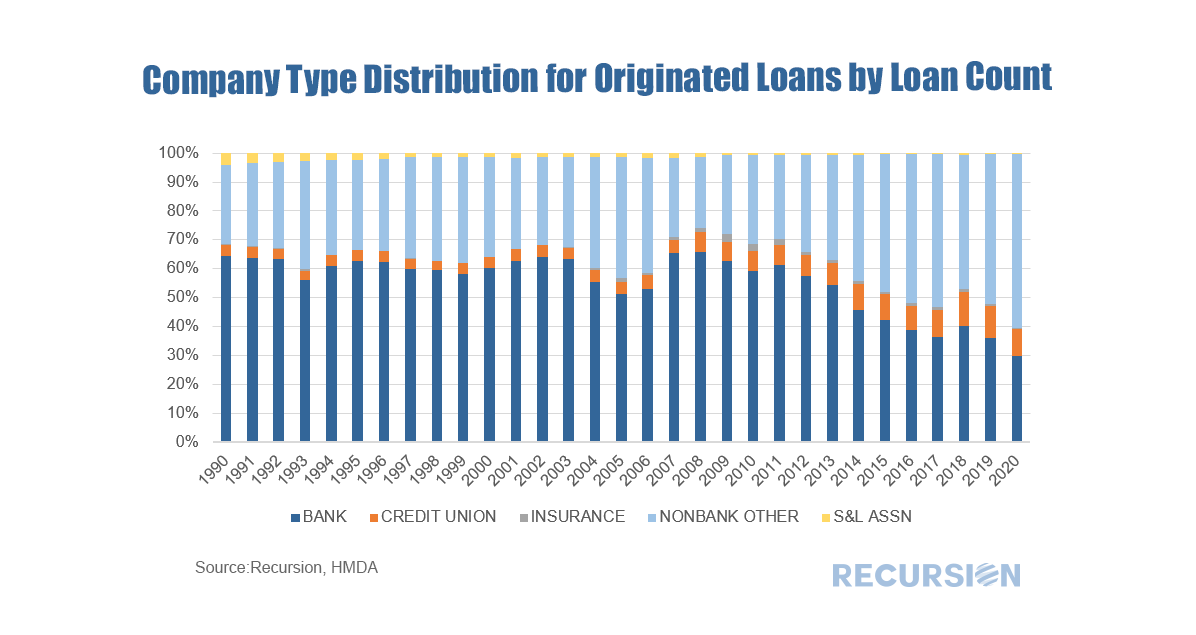 3. The held on book share collapsed, as banks preferred to hold mortgage risk in the form of MBS to avoid the potential for credit losses: 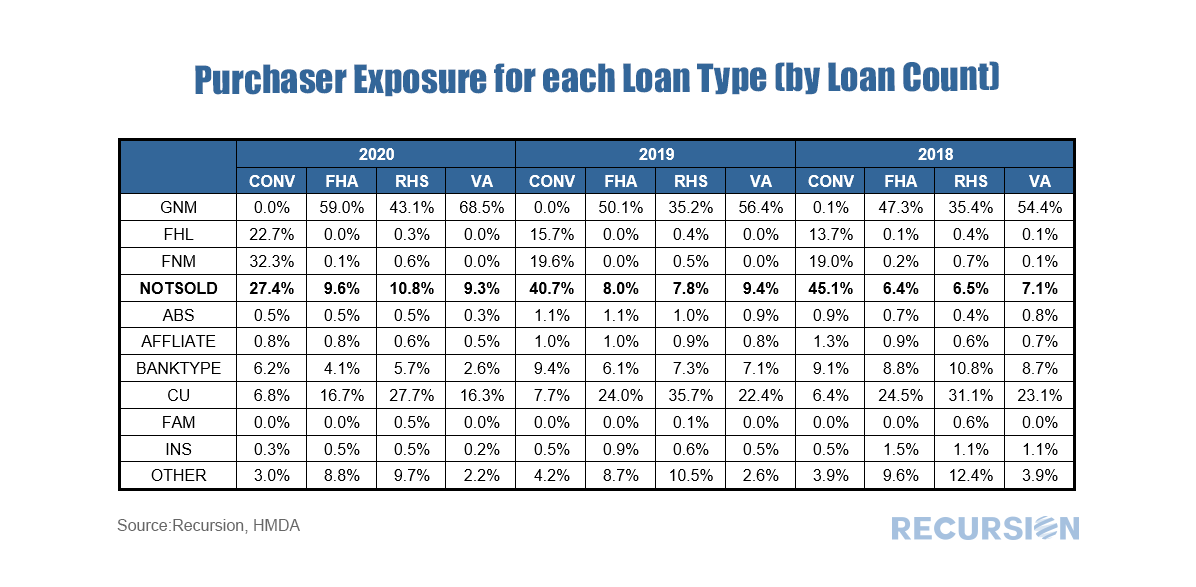 Much more can be found through with just a few clicks of the button. The increase in the number of cashout refis has led to some concerns about the implications for the quality of household balance sheets, similar to what occurred in the run-up to the Global Financial Crisis[1]. At that time, many homeowners were tempted to use their houses as a “piggy bank” as the national savings rate hit all-time lows. In the runup to the Global Financial Crisis, the national savings rate hit a sixty-year low of 2.2% while over the 2016-2019 period the rate averaged a much healthier 7.6%[2]. It is useful to scale the magnitude of assets being cashed out and Freddie Mac releases a very useful file documenting this quarterly for their book of business back to 1994[3]. In the fourth quarter of 2020, the amount cashed out reached $48.4 billion, about 58% of the $84.0 billion peak attained in the second quarter of 2006. As a share of household net worth, the most recent data point is 3.7%, well below the peak of 12.7% reached in Q2 2006. 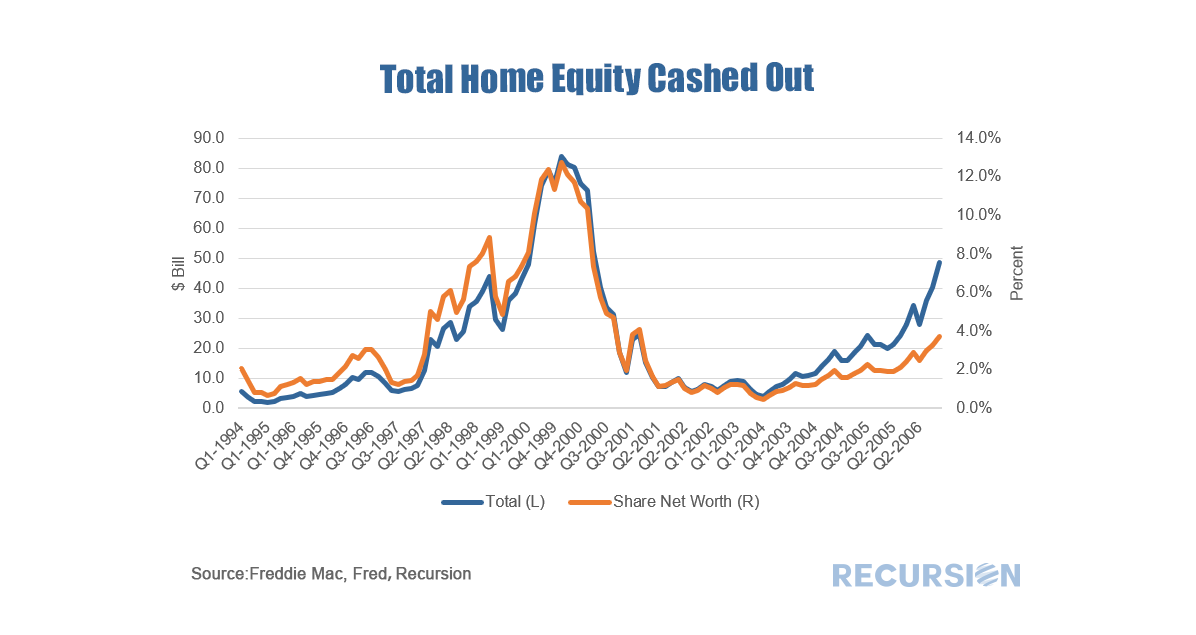 It’s useful along these lines to ask about the credit profile of cashouts compared to other refinancings. Freddie Mac didn’t report cashout refi separately until 2008 Q3, but the following useful picture can be obtained. 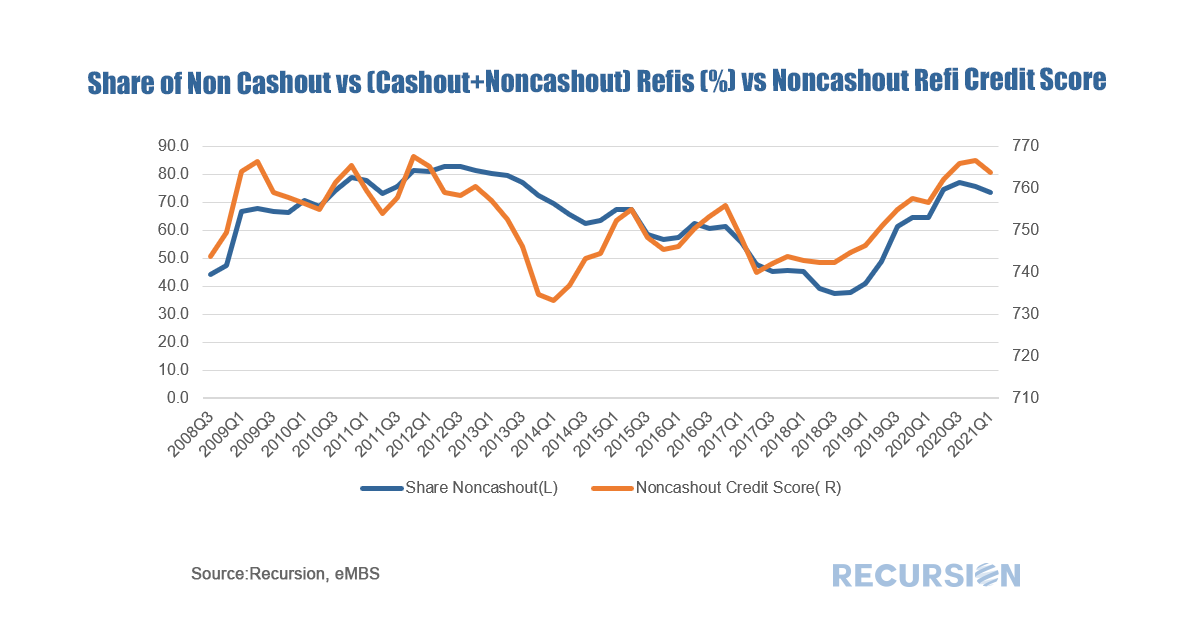 In general, lenders tend to “lean against the wind” by loosening credit conditions when demand for credit declines, and vice versa. Interestingly, it appears that the share of noncashout loans follows a pattern in which the share rises when credit in general is tightened. At the present time, the average FICO score in March for noncashouts was a tight 764, vs 753 for cashouts. It is difficult to pin the rise in equity cashouts in the current cycle to loosening credit conditions. Of course, the proof is in performance, and now that we have loan-level DQs for the GSE’s beginning last month, we can look at this broken down by loan purpose for the Freddie Mac book: 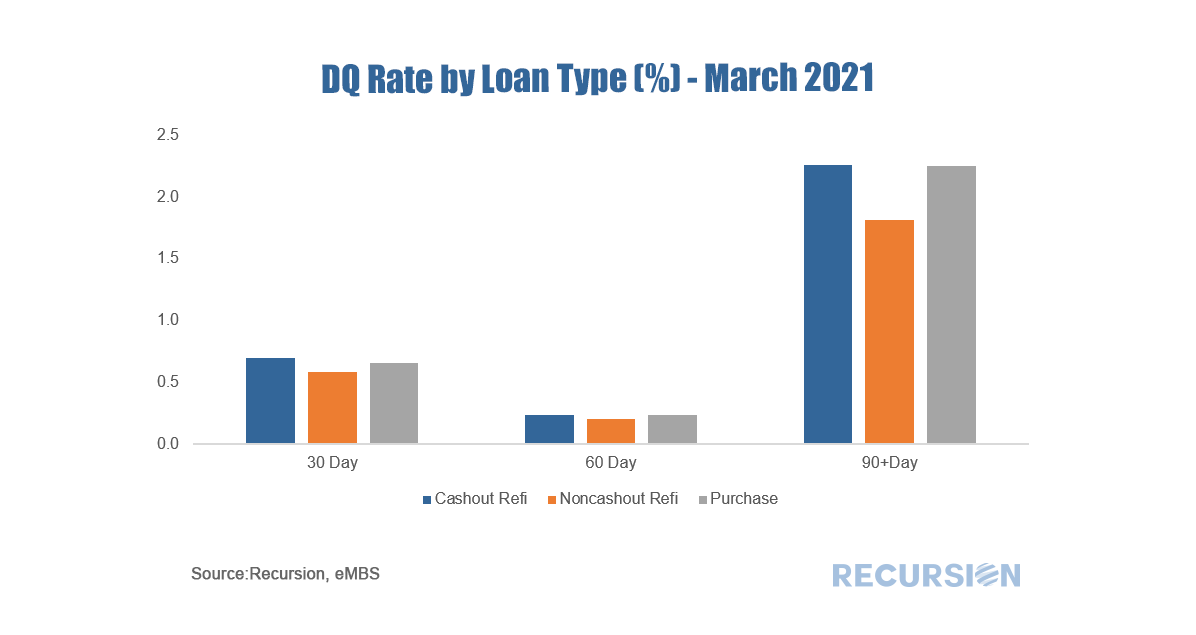 The performance of cashouts is mildly worse than that for noncashouts, but more in line with purchase mortgages. These statistics will bear watching in future months, particularly as forbearance programs begin to expire towards the end of the year. We received complete GSE data for November late last week and as always there is a lot to churn on. Another record high of issuance was achieved, although this was entirely due to a surge in refi deliveries (+$16 Bln from October) while purchase deliveries declined slightly (-$7 Bln). Lack of supply and softer seasonal demand appear to be weighing on purchase volumes. 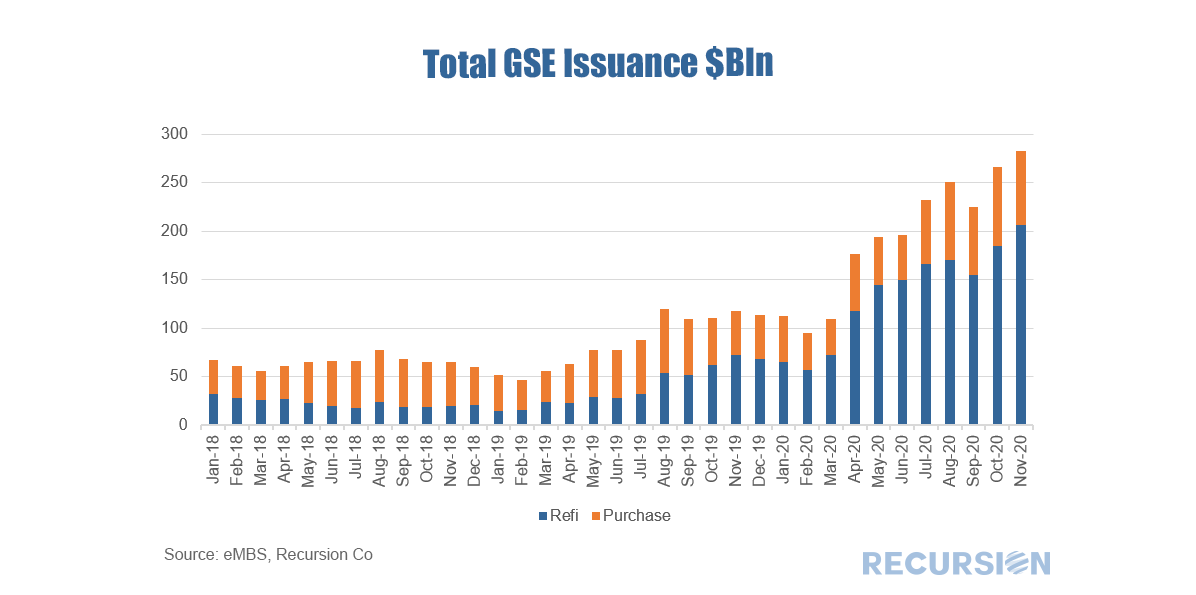 A long-term trend in these comments is the trend decline in the bank share of deliveries to the GSE’s[1]. We have commented that the Covid-19 pandemic has played to the natural technological advantage of nonbanks, while eroding the value of the bank branch networks, particularly for purchase mortgages. Interestingly, a little bit of a reverse trade can be seen the last couple of months, at least in purchase mortgages. The chart below looks at the bank share, graphed against the gap in the weighted average coupon between nonbanks and banks (“WAC Gap”). 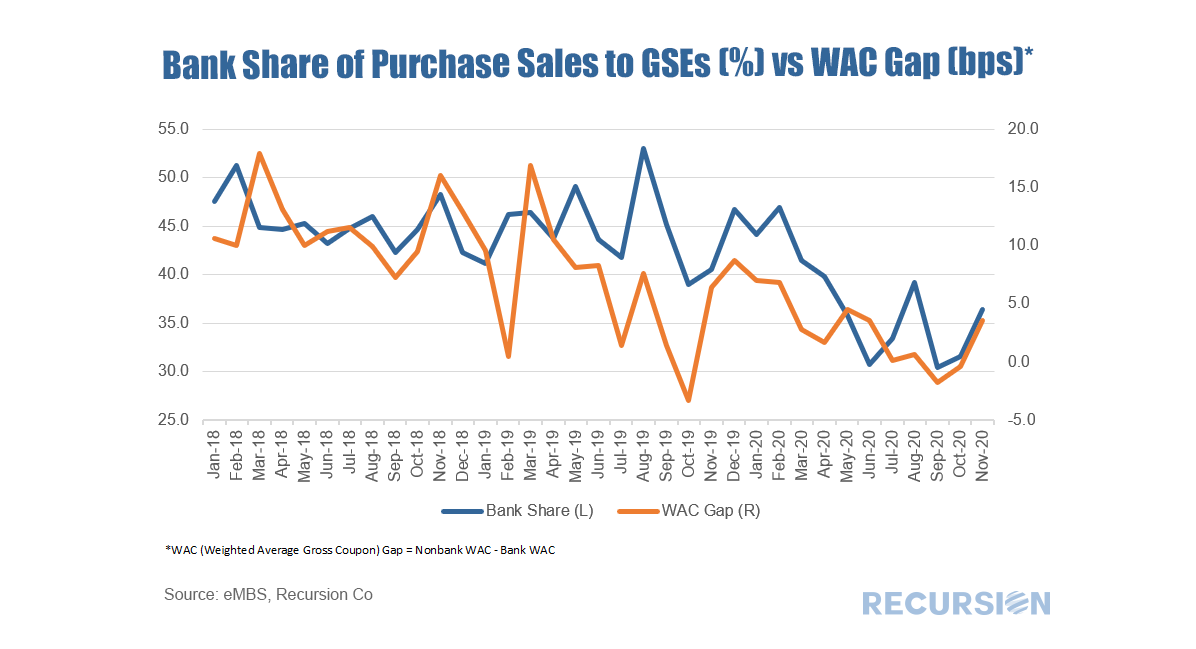 There is a distinct correlation between these two series, although considerable noise is also apparent. Many factors drive market share including underwriting characteristics and product types, but the basic relationship comes across. In November, the gap in the WAC between Nonbanks and Banks increased by almost 4 basis points from October, which was attained by a 3 bp drop in the nonbank WAC being exceeded by a 7 bp drop in that of banks. In a market measured in tens of billions, a single bp has significance. The question going forward is whether the decline in the rates of banks’ offerings is supported by efficiency enhancements or simply reflects reduced profitability. The answer to this is key in determining the question of their long-term role in this market. [1] See, for example: https://www.recursionco.com/blog/besieged-banks
In a recent post we noted the recent striking rise in the GSE refinance share and commented that the rate of this activity in GNM programs, while still rising, has lagged[1]. This seems to be related to the tendency of capacity constrained lenders to provide credit to the highest quality borrowers, and to a looming 0.5% fee hike on GSE refinance deliveries scheduled for December 1. Focusing on FHA alone, the share of refinance loans compared to those delivered to the GSE’s has plummeted in recent months: 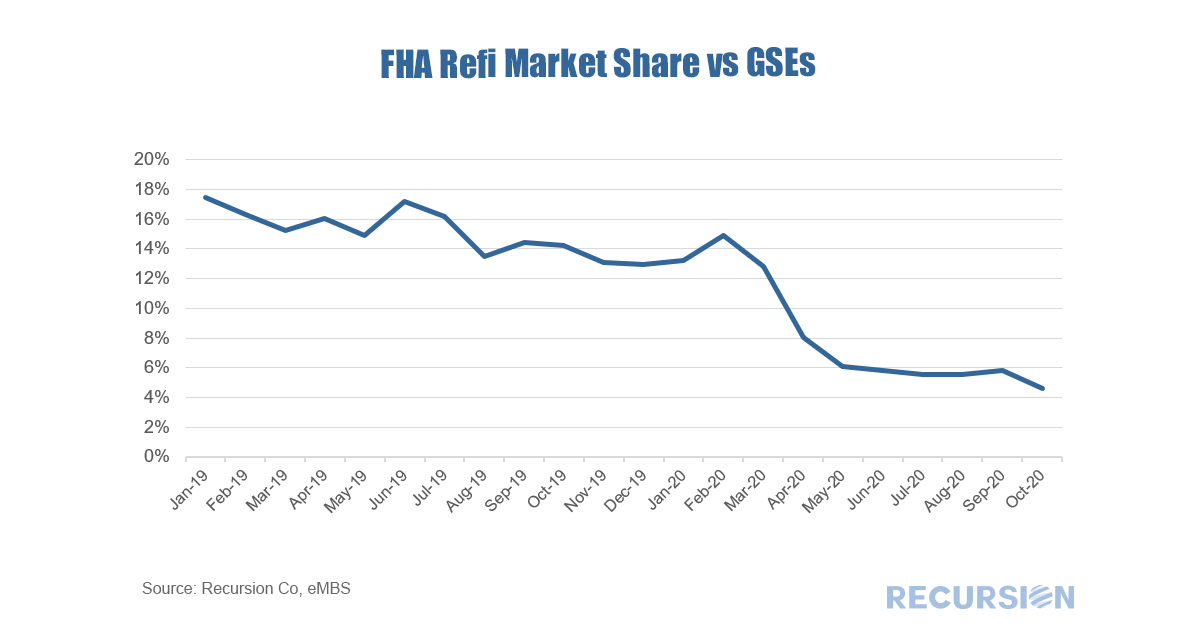 |
Archives
February 2024
Tags
All
|
 RSS Feed
RECURSION |
|

Copyright © 2022 Recursion, Co. All rights reserved.