|
Some months ago, we set off to assess the impact of high interest rates on the usage of appraisal waivers. It soon became clear that we first needed to look in some detail at recent developments in the structure of the new market for appraisal modernization[1]. In this piece, we return to the original question. To begin we look at the landscape of loan deliveries for Freddie Mac and Fannie Mae across the suite of available approaches towards appraising property values. Below find such charts for purchase mortgages. 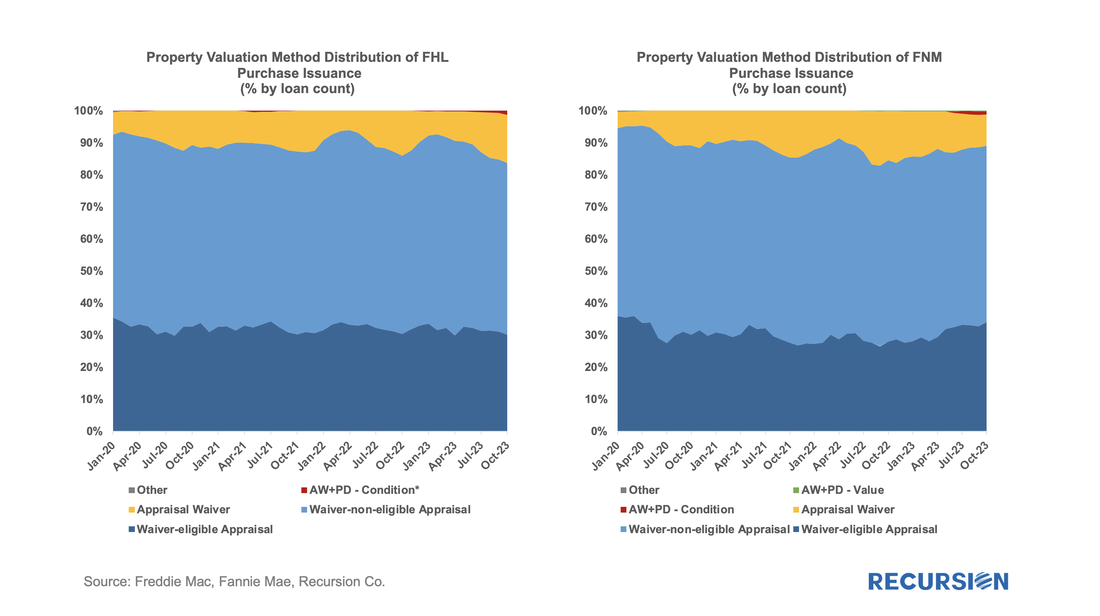 We have mentioned previously that rigorous analysis of the market for appraisal choice requires being careful to calculate the take-up rate of waivers as the number of loans that receive waivers against the number of loans eligible to receive them. Since the eligibility criteria depend on loan purpose (purchase, cashout refis, and non-cashout refis) [2], we need to look at this issue across these categories rather than in total. For example, since the eligibility standards for a waiver are looser for non-cashout refis than for purchase mortgages, a drop in interest rates that boosts the refi share may serve to boost the aggregate waiver take-up rate even though it is unchanged within each loan purpose category. It’s natural to start by looking at the purchase market. One of the great things about research is when you see a result that you didn’t expect: 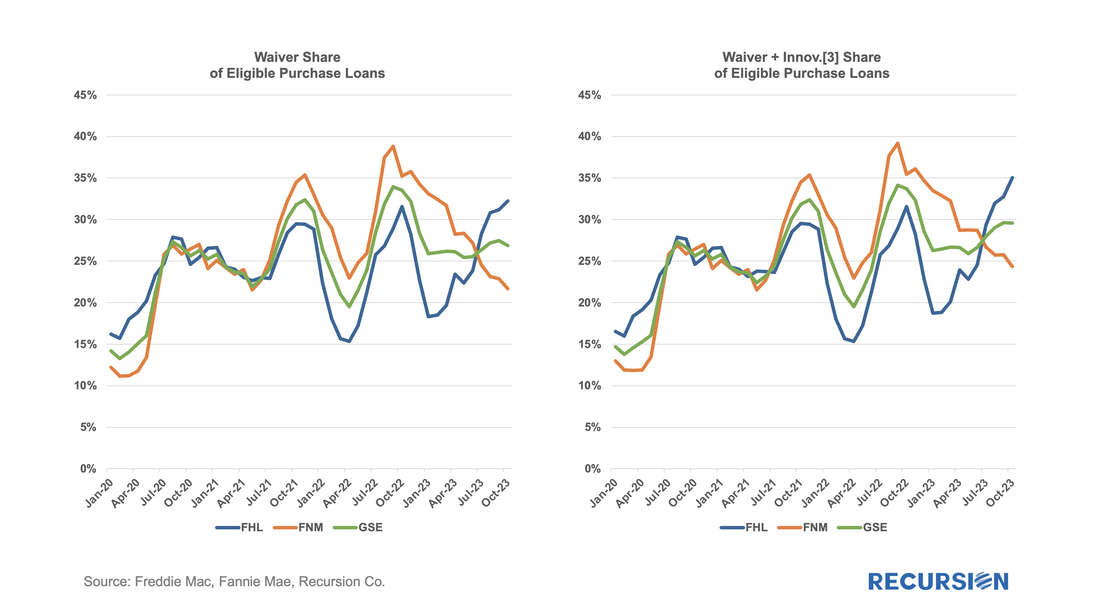 A comprehensive explanation of the pace of waiver usage over time remains out of reach, but we now have a new puzzle: What is going on with the divergence in the rate of waiver usage across the two Enterprises over the course of 2023? Well since the new innovative waiver techniques have largely been utilized this year it makes sense to look here first. The above chart on the left is the rate of waiver usage; on the right, we show that plus innovative approaches which can be interpreted as “the share of loans without traditional waivers”. Since the beginning of 2023, a new pattern of a growing rate for eligible loans delivered to Freddie Mac and a decline for such loans delivered to Fannie Mae has been presented. So there remain two other explanations. First, it could mean that Freddie Mac is switching its delivery sources to sellers with a greater waiver utilization rate, while Fannie Mae is doing the opposite. It’s possible this has something to do with the bank/nonbank share of deliveries: 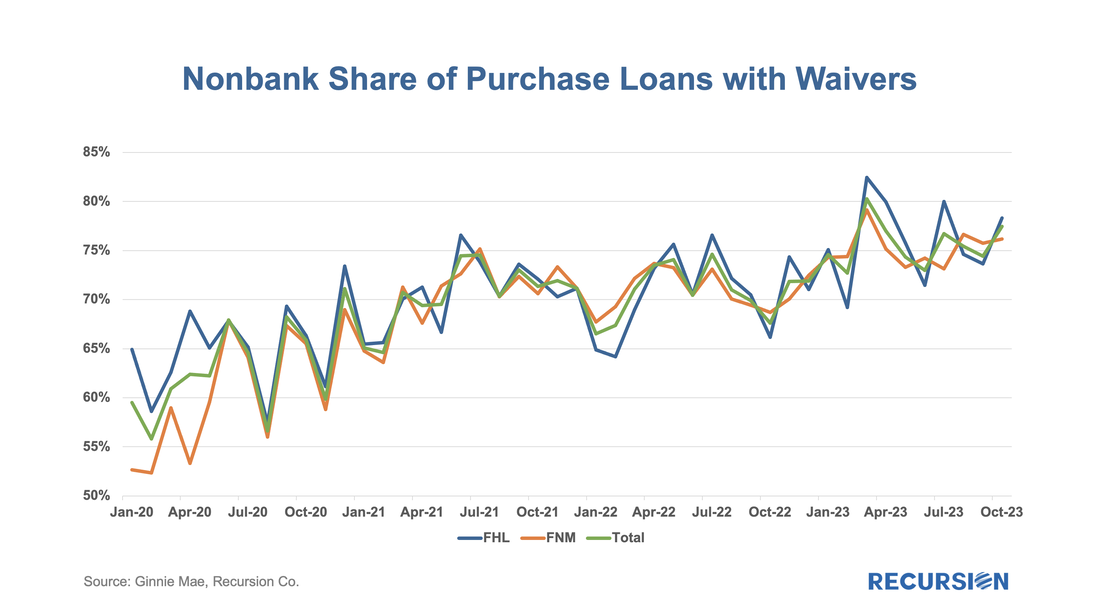 The upward trend in nonbanks is fairly consistent and very close between Enterprises. The impact on the waiver shares of this breakdown for this class of loans is here: 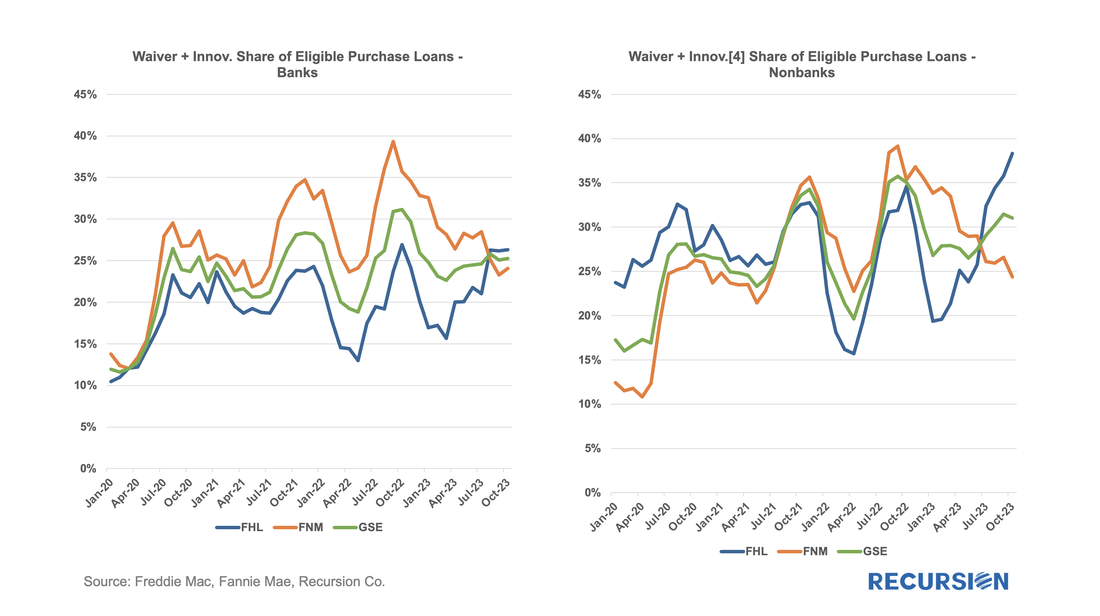 In recent months, the bank share has converged while the nonbank share has substantially diverged. So, we tilt towards nonbanks as the primary source of the divergence but the question of changing originators vs. changes in waiver and innovative deliveries across lenders remains. A comprehensive look into this is a substantial exercise, but we can get some idea by looking at the behavior of the top 20 sellers[5] by Enterprise: 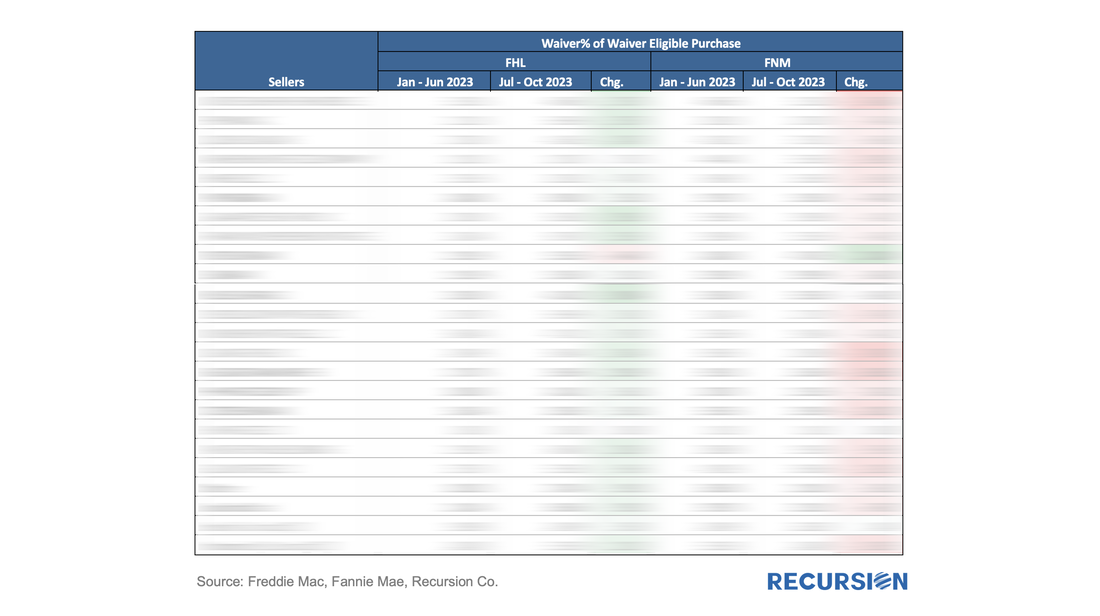 The tendency of every seller, both individually and by group, to deliver a greater share of its purchase loans with waivers to Freddie Mac and a smaller share to Fannie Mae is clear. The tendency is (considerably) more pronounced for the nonbanks in the top 20 list compared to the banks, but the trend can be seen almost everywhere. The single significant exception is Truist Bank. Given that the only choice of an explanation for this behavior is either collusion or changing preferences on the part of the GSEs, we go with changing preferences. Up top, we mentioned that an important distinction to be made in this analysis is by loan type. Briefly, we look at non-cashout and cashout refis: 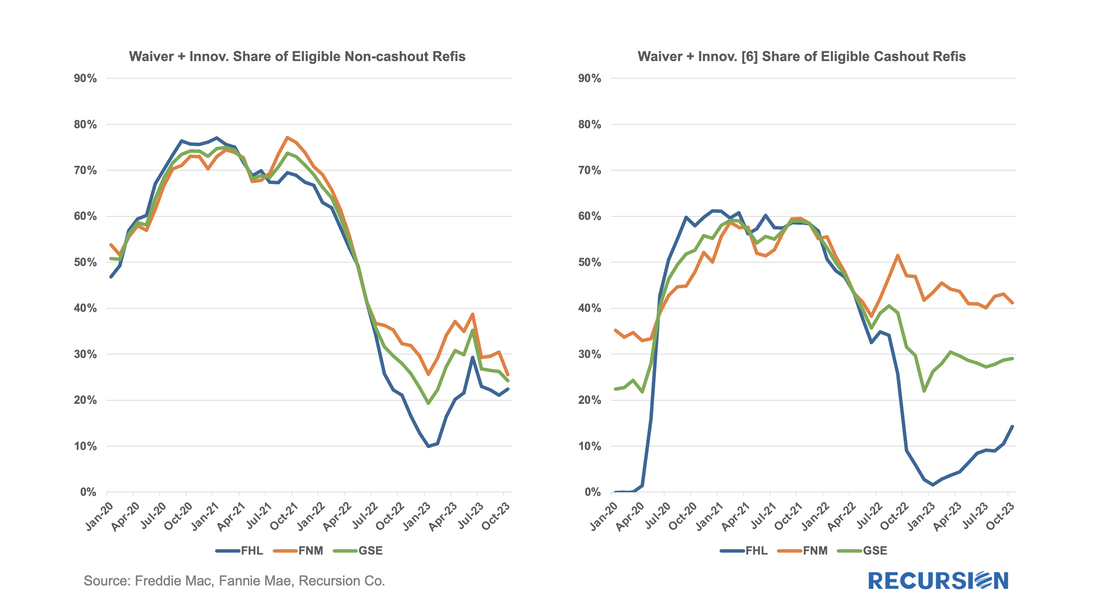 For non-cashout refis, there is virtually no evidence of changes in behavior towards the appraisal category between Enterprises. This risk is, for the most part, already owned. In the case of cashout refis, we do see changes, but these are mostly derived from the decision on the part of Freddie Mac to offer its “ACE + PDR” product in lieu of waivers starting in July 2022[7]. The main takeaway is that traditional modeling of loan performance should consider taking agency into account along with traditional factors of loan type, appraisal choice, and lender. This is a new development over the course of 2023, with significant possible implications for the mortgage risk landscape. While this is a new consideration, it is not too early to consider looking into the possibility of differing performance based on this new factor. More to come. [1]https://www.recursionco.com/blog/appraisal-modernization-analytics
[2]https://guide.freddiemac.com/app/guide/bulletin/2022-6#:~:text=ACE%20APPRAISAL%20WAIVER%20ELIGIBILITY%20UPDATE,cash%2Dout%22%20refinance%20Mortgages https://singlefamily.fanniemae.com/media/5916/display [3] Innovation approaches include the “Appraisal Waiver plus Property Data Collection – Value” program and the “Appraisal Waiver plus Property Data Collection – condition” program. [4] Same as above. [5] Top 20 sellers are ranked by the number of waiver-eligible purchase loans delivered to GSEs. [6] Same as above. [7]https://guide.freddiemac.com/app/guide/bulletin/2022-6#:~:text=ACE%20APPRAISAL%20WAIVER%20ELIGIBILITY%20UPDATE,cash%2Dout%22%20refinance%20Mortgages. |
Archives
July 2024
Tags
All
|
 RSS Feed
RECURSION |
|

Copyright © 2022 Recursion, Co. All rights reserved.