|
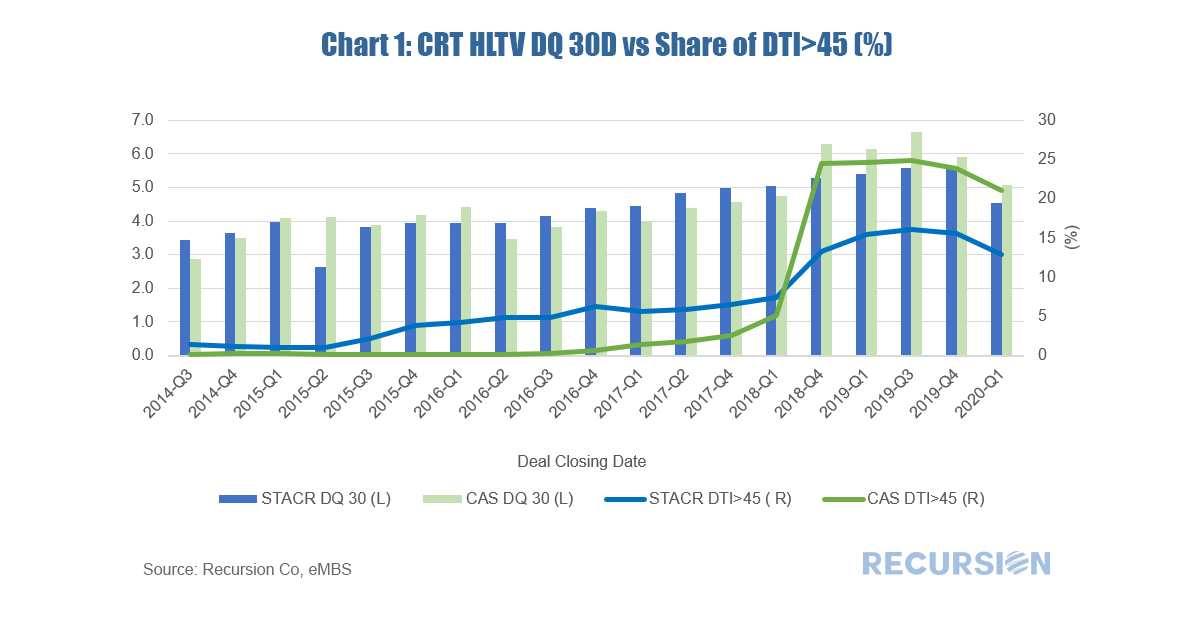
In a recent post we established a correlation between the 30 day dq rate of the loans in the reference pools for the Freddie Mac High LTV STACR CRT program and the share of these loans with high indebtedness as measured by DTI>45 for the month of May[1]. Recently Fannie Mae released the corresponding data for its CAS program and the results are striking. First, the pattern of results we saw for STACR is confirmed. This can be clearly seen if the results of the two programs are overlaid one over the other[2]. *The Chart 1 and Chart 2 can be duplicated using the following two queries
Earlier this month we discussed the new pool-level forbearance and delinquency data released by the GSE’s[1]. At that time, we noted that the delinquency data looked reasonable for May, but that the forbearance data fell short of other reported measures, particularly for Freddie Mac.
The release of the Ginnie Mae loan-level forbearance data[1] earlier this week enabled us to see the impact of the Covid-19 crisis on forbearance.
An immediate question is how this data relates to delinquency. We have commented previously that forbearance and delinquency are distinct concepts as borrowers may choose to enroll in a forbearance program as an option to stop paying their mortgage on short notice in the future[2]. The pool level data released earlier this month by the GSE’s is not of high quality and showed forbearance rates less than those released from other sources. The Ginnie Mae loan level data appears to be very accurate, and in synch with other reports. Within the category of forbearance loans, 27.9% of Covid related are still paying. The portion for not Covid related is 15.5%[3]. This result provides confirmation that a significant portion of borrowers have availed themselves of the option to stop paying without exercising it yet. Appraisals play an important role in managing the risks associated with residential mortgages. Since 2017, both Fannie Mae and Freddie Mac (GSEs) have published multiple rules (see Appendix below) for lenders to qualify mortgage applications for property inspection waivers (PIW). PIW can reduce the cost of mortgage transactions. However, PIW raised concerns of improper usage among investors, mortgage insurers, regulators and other players in the mortgage market. In particular, research has shown that loans with PIWs prepay much faster than loans without.
In March 2020, both Fannie Mae and Freddie Mac released loan level information regarding “Property Valuation Method” which included the Appraisal Waiver information. The new data regarding PIW’s offers the opportunity to study how this program affects the market. We received loan-level forbearance data from Ginnie Mae for May earlier today. The data are of high quality and appear to be broadly in line with the data reported by the Mortgage Bankers Association for the month of a little over 11% (no breakdown by program is given). The data appear to be a much better representation of market conditions than the pool-level data released by the GSE’s earlier in the month[1].
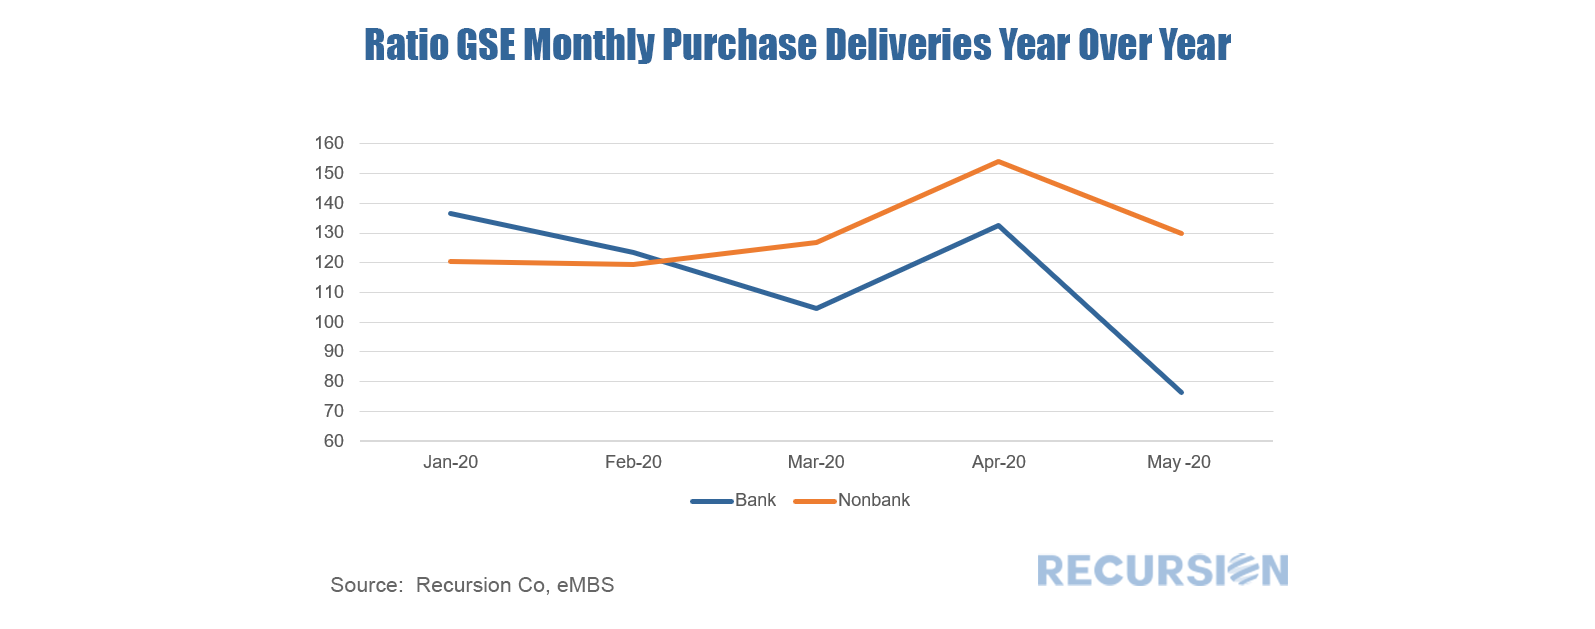
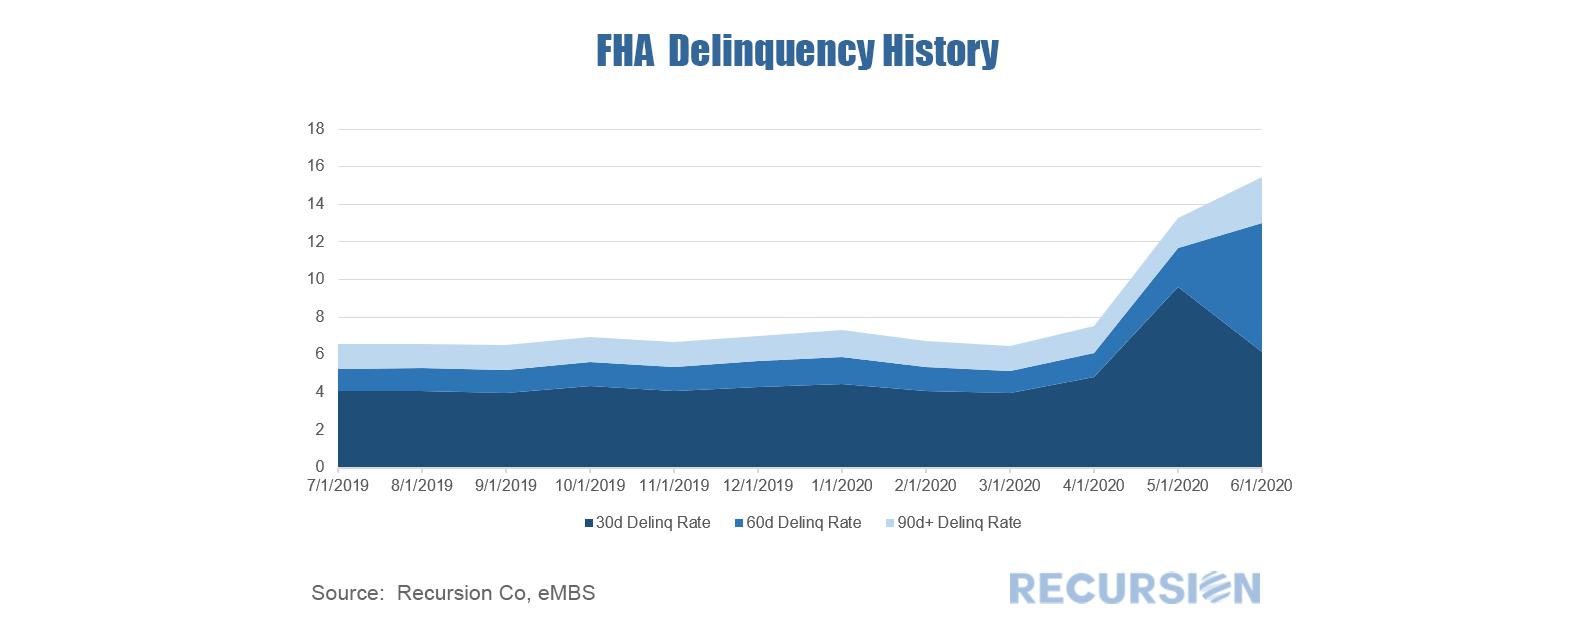
As this data is on the loan level, we can look at the relationship between this and delinquency data by state level geography and other characteristics such as bank/nonbank and underwriting characteristics and we will provide some analysis of this sort in upcoming posts. With the release of the GSE delivery data for May late last week we can start to see the impact of the Covid-19 crisis on the spectrum of loans delivered to Freddie Mac and Fannie Mae. First, deliveries of purchase mortgages have so far held up, with May deliveries up 3.5% from a year earlier. The notable development, however is the discrepancy between bank and nonbank deliveries, with Nonbank lenders in May delivering 30% more loans compared to a year earlier, while banks delivered 24% less. In general, mortgage production has held up because mortgage rates are at record lows in the face of the economic crisis. The question is why they hold up better for nonbanks than banks. The bank data are more complicated to analyze than nonbank because banks have the option of holding loans on their balance sheets so a decline in deliveries may be due to an increase in loans retained rather than a drop in originations. Such a decline seems unlikely at present because banks have an incentive to sell loans that might go into forbearance because the two agencies charge the lenders substantially for such purchases[1]. We have commented previously that banks are reducing loan balances but adding MBS to their balance sheets to reduce these risks[2]. Another possibility is that banks are tightening lending standards due to concerns about rep and warrant issues if loans become delinquent. It is also possible that the virus has accelerated the trend to fintech lending, much like it has online shopping. There leaves many paths to investigate in future posts. The Ginnie Mae loan tape for May came in last night. The data showed the FHA overall delinquency rate jumped from 13.3% to 15.5% from last month. This compares to overall rates based on pool level data for Fannie Mae and Freddie Mac of 5.4% and 6.2%, respectively.
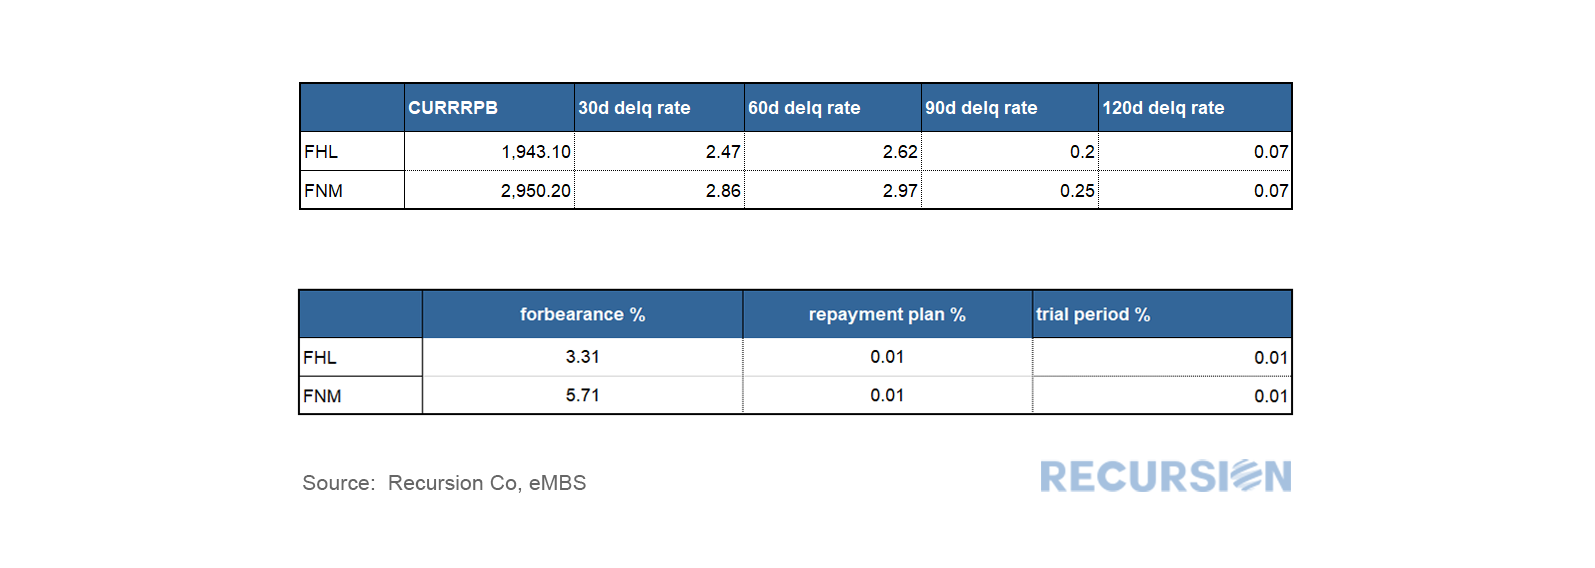
We received delinquency and forbearance information for the GSE pools late last night. By balance, the pools with such information cover over 99% of FHL and 92% of FNM pools, which is satisfactory.
In terms of delinquency, Fannie Mae reported higher delinquency rate than Freddie Mac, which is in line with the relatively higher DTI’s seen in FNM deliveries in recent years. Freddie’s 30d delinquency rate reported in May was 2.47%, about 0.4% below the same figure for Fannie Mae . |
Archives
July 2024
Tags
All
|
RECURSION |
|
Copyright © 2022 Recursion, Co. All rights reserved.


 RSS Feed
