|
Some months ago, we set off to assess the impact of high interest rates on the usage of appraisal waivers. It soon became clear that we first needed to look in some detail at recent developments in the structure of the new market for appraisal modernization[1]. In this piece, we return to the original question. To begin we look at the landscape of loan deliveries for Freddie Mac and Fannie Mae across the suite of available approaches towards appraising property values. Below find such charts for purchase mortgages. 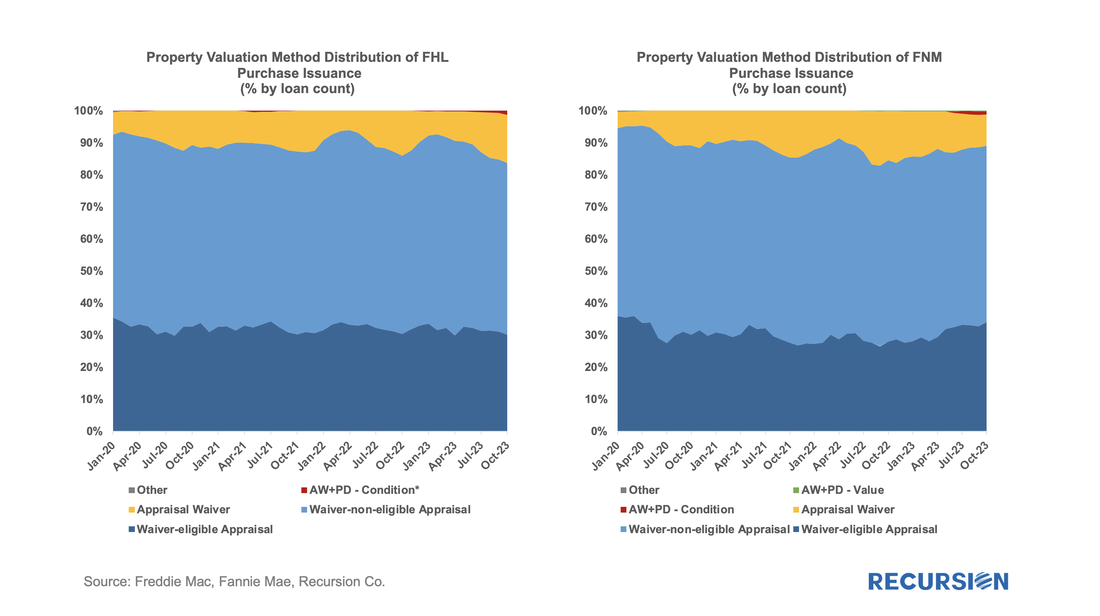 With home prices at record high levels and mortgage rates at their record highs since the turn of this century, it’s natural to ask if the housing market will be the source of new systemic risk. Over the past year, we have written extensively about “mortgage winter”, a condition where housing demand is held back because of affordability, while at the same time, supply is constrained by current homeowners who are locked into properties by mortgages with rates far below those available in the prevailing market. This is what economists would call a “bad equilibrium”, a state of great strains in the market that tends to persist. While the housing finance industry is under great duress, the spillover to the broader economy remains limited, as for example, the labor market has held up well despite soaring borrowing costs. Within housing, the notable good economic news is that the extraordinary surge in house prices in the wake of the Covid-19 pandemic has resulted in an astounding 50% surge in the value of homeowner’s equity in real estate since Q1 2020 to over $30 trillion. 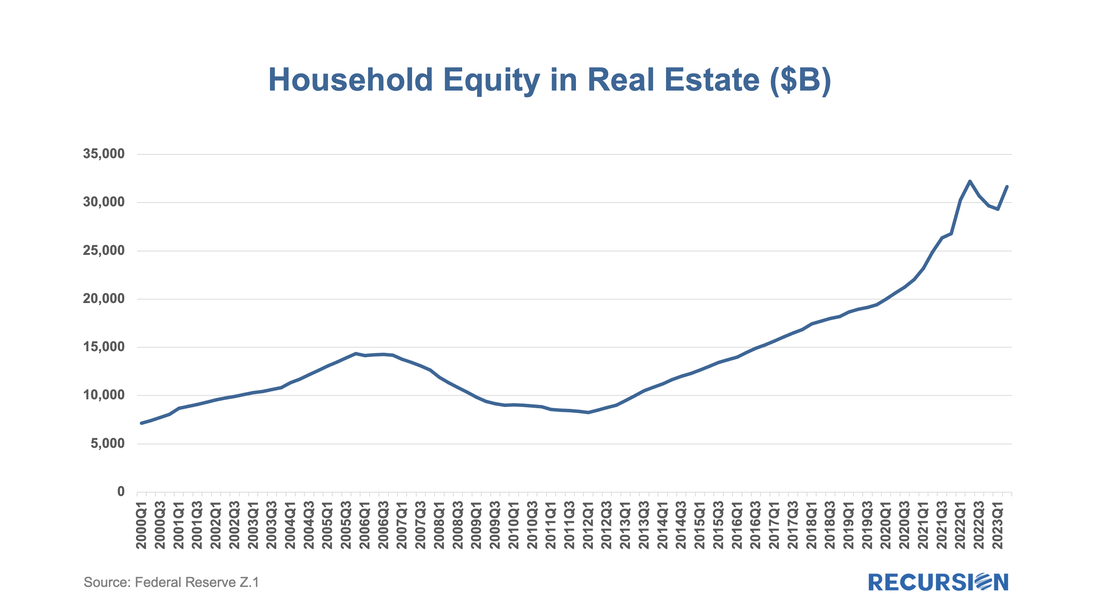 As we head into the end of summer, we note that the housing market remains locked into “Mortgage Winter”. Refinance activities are muted as mortgage rates are at a 22-year high. Even purchase mortgage applications are at the lowest level seen since 1995 as homeowners are not willing to give up their mortgages at historical low rates. It’s not hard to imagine that in such a world we will see new behaviors as mortgage lenders struggle to remain viable. PennyMac stood out as one of the more creative lenders that was able to refinance the mortgages it services, indicated by the following chart: 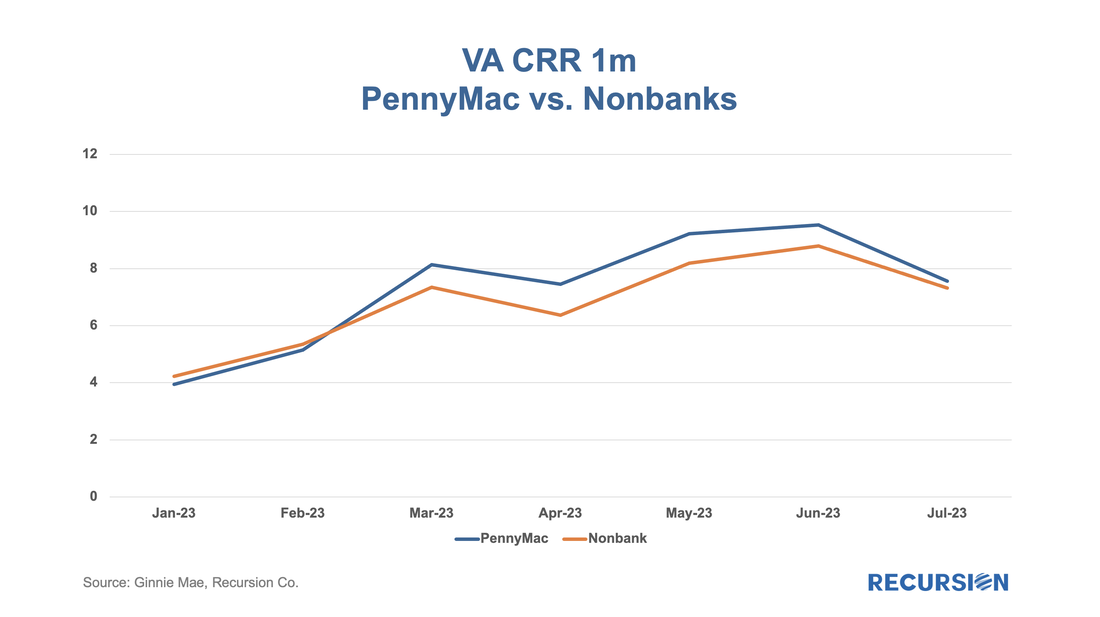 To read the full article, please send an email to [email protected]
As policy interest rates continue to rise and economic activity begins to slow, attention in the mortgage market shifts towards concerns about the potential for borrower distress. We are early in this process as the labor market continues to add jobs, and there continue to be more job openings than people looking for work. Nonetheless, signs of strain begin to be seen, and it's worthwhile to point out early trends and consider implications. Notably, the impact of Hurricane Ian could be seen in the short-term delinquency data: 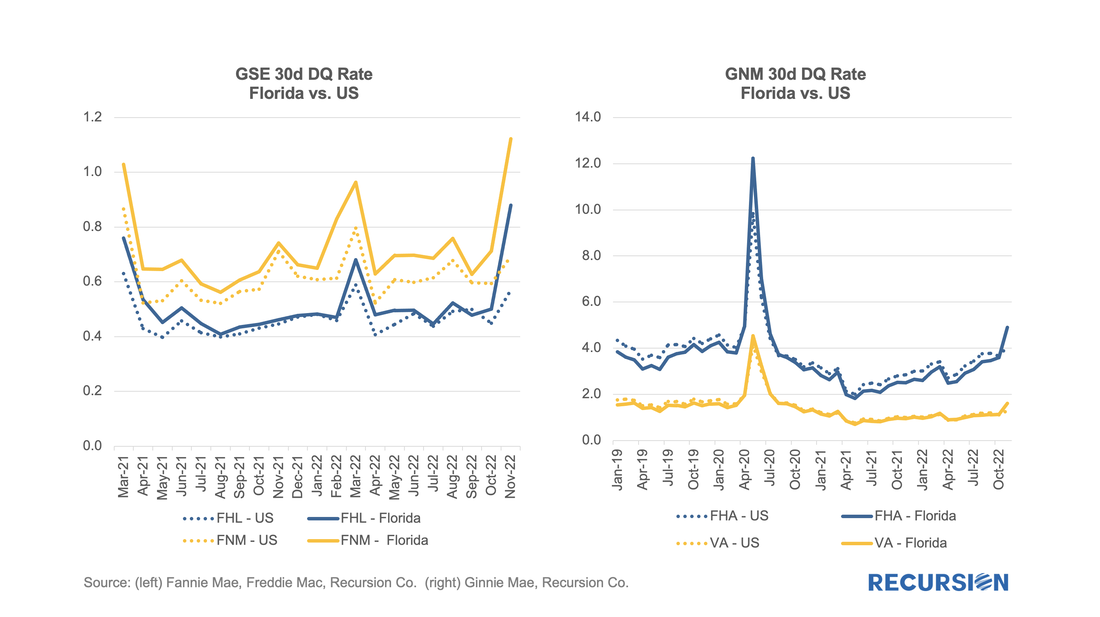 With mortgage rates near 40-year highs, there has been a pronounced collapse in refinance activity reflected in agency loan originations: 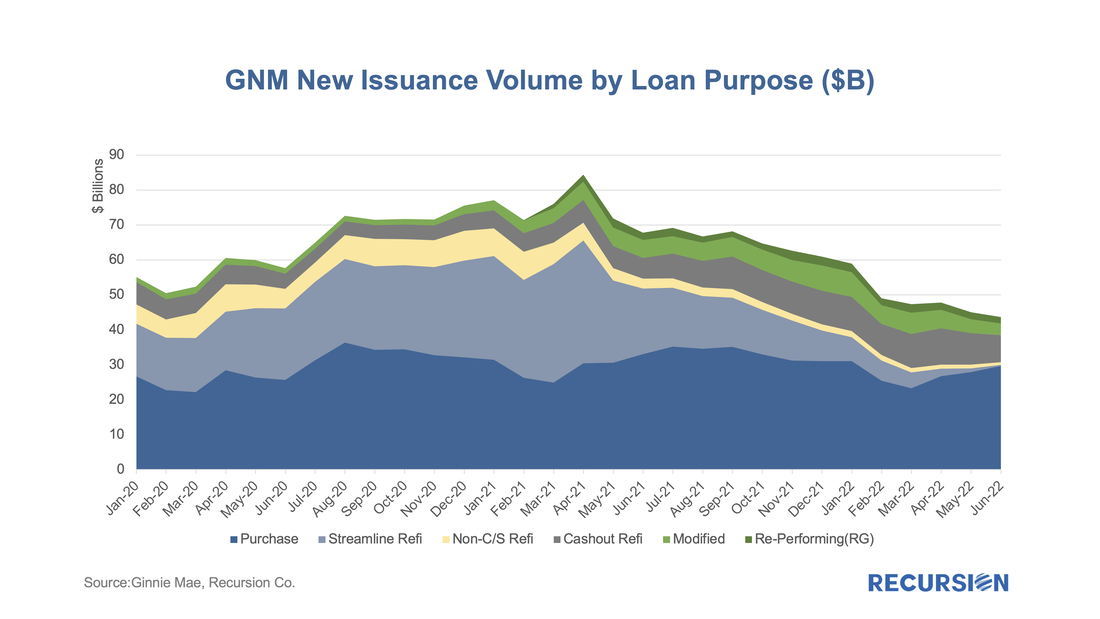 With the 30-year mortgage rate surging to a 13-year high near 5 ¼% and the FHFA purchase-only house price index at a record-high 19.42% in February (edging out the prior record of 19.39% in July 2021), we are in an unprecedented environment in the mortgage market. As such, it makes sense to update our analysis of the trend in issuance updated through April. Of particular interest in this regard are the FHA and VA programs. Let’s start by looking at FHA. By loan count, there were 107,500 FHA loans issued in GNM pools in April, with a decline of over 1/3 from the same month a year earlier. One special interest is the evolution of the share of issuance by loan purpose: 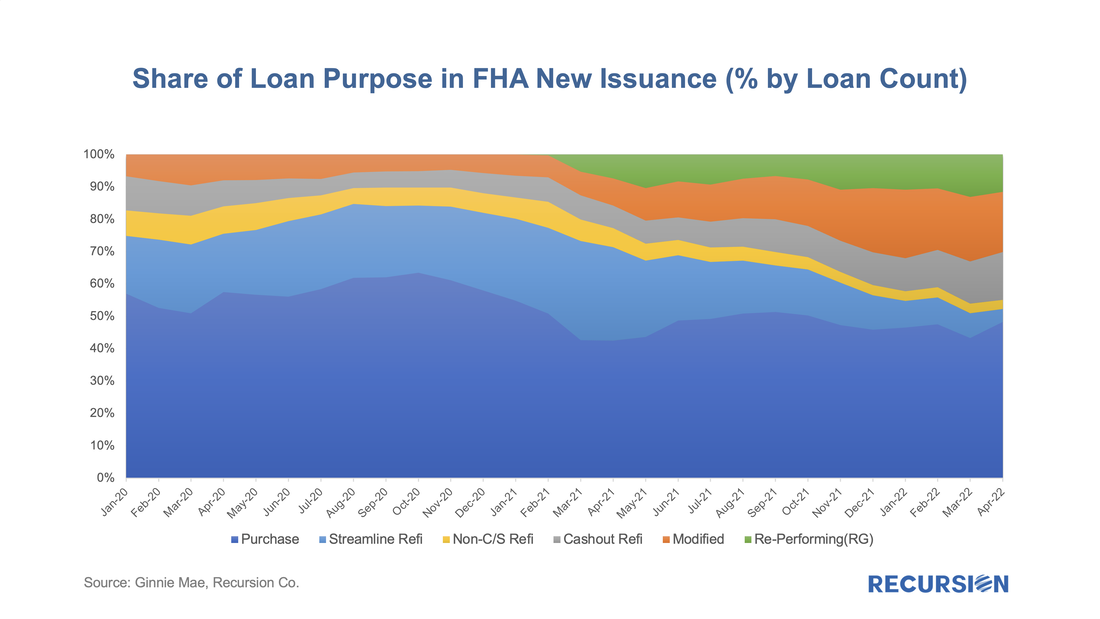 Recently, the GSE’s Fannie Mae and Freddie Mac released loan-level data associated with their “Special Eligibility Programs” that look to extend credit to low-income borrowers. As housing policy is increasingly focused on providing this market segment access to this market segment, this data will prove useful to housing analysts looking to assess the effectiveness of these programs as well as to traders looking to understand the impact on the performance of MBS containing these loans. Briefly, each agency has three programs. There are many differences in details between the programs.
As the refi programs are relatively new and volumes are small, in this post we focus on the first two. For convenience, we refer to the first as the “Low-Income Programs” and the second the “HFA Programs”. Below find the market share of Home Ready and Home Possible out of total volumes for their respective Agencies by loan count: 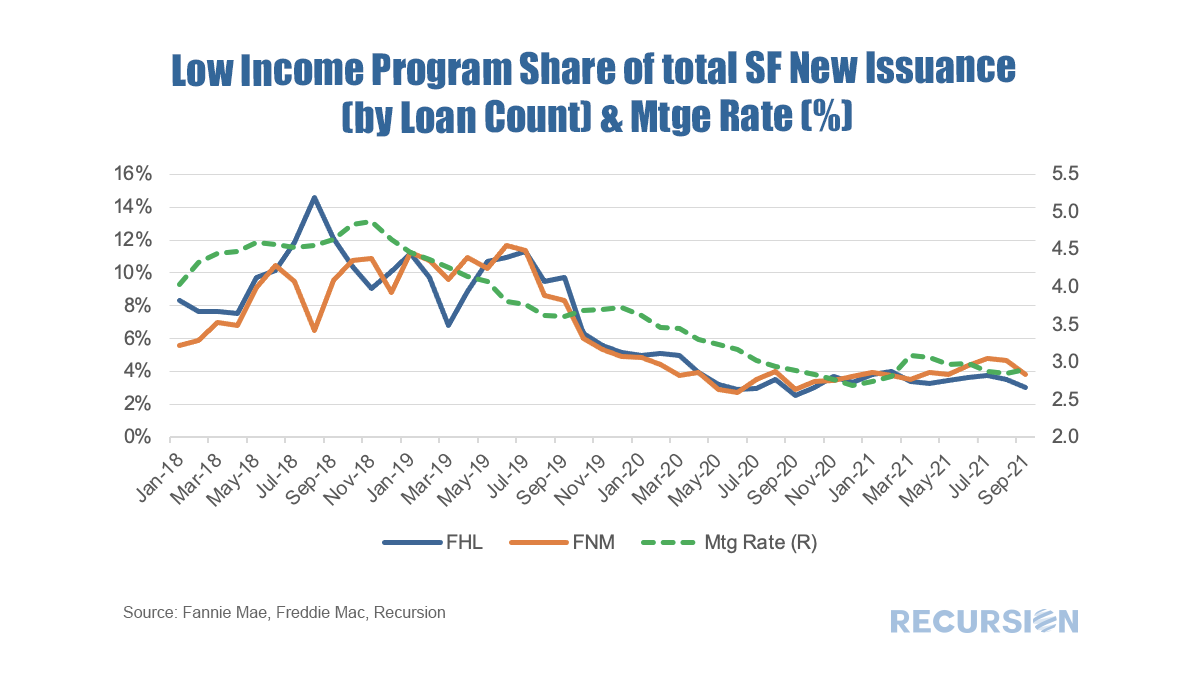 Credit provision is one of the great areas of concern addressed by the New Housing Policy. In a previous post[1], we mentioned that we have integrated HUD LMI Neighborhood information with our tools. We can view aggregate credit creation through Cohort Analyzer, and its composition through HMDA Analyzer. 2020 marked an unprecedented year for mortgage production as the pandemic sparked aggressive moves by the Federal Reserve driving mortgage rates to record lows, coupled with a flight of households away from density towards more sparsely populated areas. Trends in the major programs by loan count can be seen here: 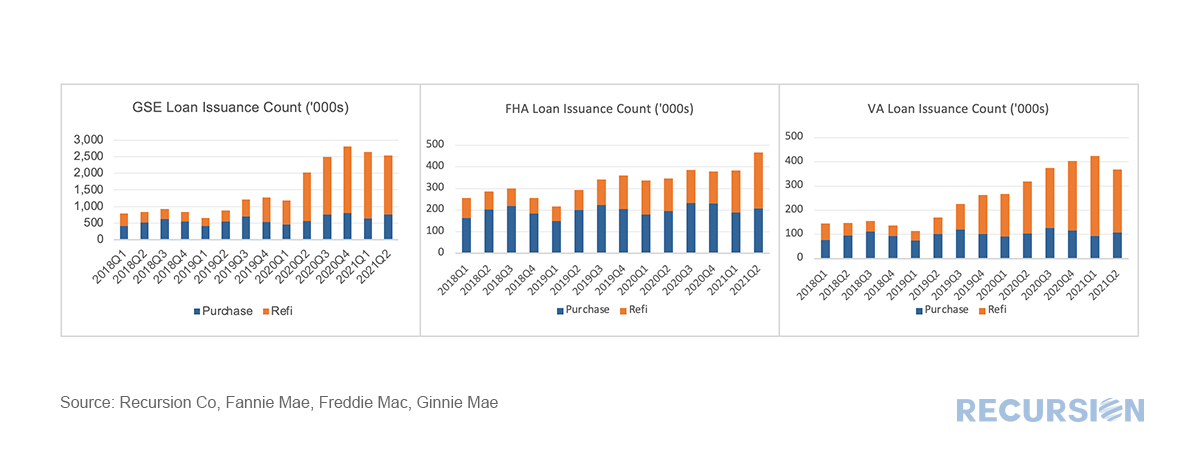 *This chart can be duplicated using the above two queries
|
Archives
July 2024
Tags
All
|
 RSS Feed
RECURSION |
|

Copyright © 2022 Recursion, Co. All rights reserved.