|
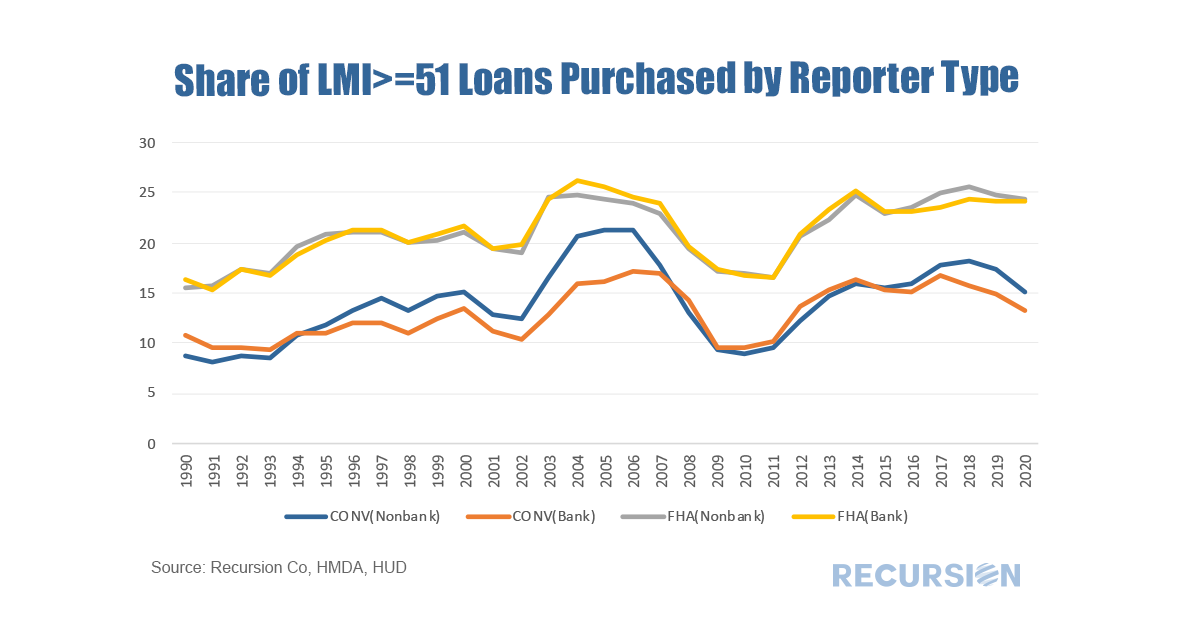
As we accumulate more data at a fine local level, the opportunities to evaluate policies derived from insights into lender, borrower and supervisor behavior grow massively. Our recent post looking at the potential impact of FHFA’s new rate mod policy[1] is our most recent example of the application of digital tools in the policy space, but as noted previously[2], the new policy framework is designed to focus on wealth creation and housing sustainability at the local level. To look at this issue, we need to have data at hand that tells us which local areas have a preponderance of low-income borrowers on which we can overlay the HMDA data set, which reports census tract level indicators related to the policy issue at hand. It turns out that the income data can be found in the American Community Survey (ACS)[3]. A key facet of this survey is information regarding the share of every census tract where low and moderate income (LMI) people comprise less than or equal to 51% of the total population. This data is available through the HUD Exchange[4]. With that, we now have a robust tool for analysis. An immediate challenge in this regard is to come up with specific queries out of the myriad of possibilities that demonstrate their power. Below finds a chart that provides a big-picture view of lender behavior in LMI neighborhoods broken down between banks and nonbanks[5]. Specifically, we look at the trend in purchases from third-party originators of both FHA and conventional loans: A great deal can be inferred from this chart, but for now let’s just focus on the differences in behavior by loan types before and after the global financial crisis (GFC). Prior to the crisis, banks and nonbanks devoted similar shares of their LMI purchases to FHA loans, but after the crisis banks piked up their purchases of these loans relative to nonbanks. A very different picture emerges for conventional loans. In this case, nonbanks devoted a greater share of their LMI purchases to this category than banks while after the financial crisis the two groups’ behavior converged. Of course, this raises numerous questions about the motivations for these behavior changes. Much more work needs to be done in this area, but two possible explanations come to mind. First, the sharp increase in regulation in the wake of the financial crisis fell more on banks than nonbanks. This has led to diminished levels of bank underwriting of FHA loans. As the Community Reinvestment Act requires banks to demonstrate their service to LMI communities in the areas they serve, these institutions are now purchasing rather than manufacturing these mortgages. Second, prior to the GFC, nonbank origination was muted as their distribution channels were underdeveloped, so they turned to purchasing loans to keep their production lines fully utilized. After the GFC, nonbank technology-fueled advancement in production processes mitigated the need for loan purchases. A final note. This exercise clearly serves to demonstrate the power of the new tools to address current policy issues. But in addition, the additional complexity inherent in these new techniques underscores the importance of expertise in sifting through all the possibilities inherent across so many loan characteristics. This approach is designed to supplement judgment, not replace it. Much more to come. [1] https://www.recursionco.com/blog/quick-action-in-the-new-housing-policy
[2] https://www.recursionco.com/blog/the-dfa-the-scf-and-the-new-housing-policy [3] https://www.census.gov/newsroom/press-kits/2020/acs-5-year.html [4] https://www.hudexchange.info/programs/acs-low-mod-summary-data/ [5] Note this is from the FY 2021 ACS 5-Year 2011-2015 Low and Moderate-Income Summary Data |
Archives
July 2024
Tags
All
|
RECURSION |
|
Copyright © 2022 Recursion, Co. All rights reserved.


 RSS Feed
